Abstract
Nowadays, climate change is the primary factor shaping the future of food and nutritional security. To investigate the interactive effects of various climate variables on photosynthetic efficiency, an experiment was conducted using 10 dryland wheat genotypes. These genotypes were exposed to different conditions: temperatures of 25 ± 3 °C and 34 ± 3 °C, carbon dioxide concentrations of 380 ± 50 ppm and 800 ± 50 ppm, and irrigation regimes of 50% field capacity and well-watered. Our results indicated that the wheat genotypes responded differently to both individual and combined climate stress factors. The traditional winter wheat genotype *Sardari*, along with the newly developed dryland wheat genotype *Ivan*, exhibited resilience to anticipated climate conditions. This resilience was reflected in enhancements in photochemical quantum efficiency parameters (Y(II), qP, and qL) under combined stress conditions. Resilient genotypes demonstrated superior regulation of the stomatal conductance (GS) and electron transport rate (ETR) under elevated temperature and CO2 levels. Principal component analysis (PCA) revealed significant correlations between chlorophyll fluorescence parameters and climate factors, such as NPQ with temperature, Y(NO) with CO2, qL in response to drought stress, and both qP and Y(II) with the interactions among temperature, CO2, and drought stress. Elevated CO2 reduced the ETR and GS across all genotypes. Our findings underscore the importance of assessing not only fundamental chlorophyll fluorescence parameters like Fm and Fo but also the efficiency of NPQ and Y(II) to understand climate change impacts on dryland wheat genotypes. We suggest that these parameters could serve as valuable biomarkers for breeding programs aimed at improving plant adaptation to future dryland climate conditions.
Supplementary Information
The online version contains supplementary material available at 10.1038/s41598-024-80164-0.
Keywords: Chlorophyll fluorescence, Climate changes, Electron transport rate, Dryland wheat, Stomatal conductance
Subject terms: Developmental biology, Plant sciences, Climate sciences, Environmental sciences
Introduction
Iran has a diverse and complex climate pattern, with most areas classified as arid to semi-arid. The average annual precipitation is 228 mm, less than one-third of the global average. In contrast, the annual evaporation rate ranges from 1500 to 2000 mm, about three times the global average1. Under climate change, the frequency of droughts is expected to increase significantly, particularly in arid and semi-arid regions.
According to the Intergovernmental Panel on Climate Change (IPCC) report, if greenhouse gas emissions are not controlled, global warming is expected to increase by 1.5 to 2 °C during the twenty-first century2. Greenhouse gas emissions, including carbon dioxide, ozone, nitrogen oxides, and methane, directly influence the growth of plants. Ozone, as a potent oxidizing agent, can harm various plant species when present in high concentrations, leading to diminished growth and yield3. A reduction in chlorophyll content, often recognized as a biochemical indicator of damage, was noted across ozone exposure4. Nitrogen oxides (NOx) rank among the most prevalent pollutants released globally. They can cause direct harm to plant cells and can also hinder growth by facilitating the formation of ozone (O3) and aerosols5. Methane (CH4) is a significant greenhouse gas that may interact with reactive oxygen species (ROS), various gaseous signalling molecules such as nitric oxide (NO), carbon monoxide (CO), and hydrogen sulfide (H2S), as well as glutathione (GSH)6. As temperatures rise, the photosynthesis and growth of C3 crops, such as wheat, decrease7. Predictions indicate a 4.4–6.1 percent reduction in global wheat yield with just a 1 °C increase in temperature by the middle of the twenty-first century8. Temperatures above 30 °C are particularly detrimental to wheat, with the pollination stage being the most sensitive to heat stress, leading to irreparable impacts on grain yield9,10.
The photosynthetic pathway is a crucial metabolic process for determining how environmental stresses affect plant performance, influencing electron transfer, photosystem II (PSII), and photosynthetic pathway proteins1,11,12. Drought stress, the most significant environmental limitation, directly affects photosynthetic variables and yield12,13. Under water stress, decreased leaf water conductivity causes stomatal closure, directly impacting photosynthesis14. Drought stress also reduces the electron absorption capacity in leaves, confirmed by an increase in the energy required to close reaction centers15,16. Water stress affects the electron transport capacity between PSII and the PSI acceptor part, increasing the time needed to reach maximum fluorescence15.
Depending on our efforts to reduce CO2 emissions, atmospheric CO2 concentrations are projected to be between 550 and 1000 ppm by the end of the century, leading to global mean air temperature increases of 1–3.7 °C17,18. Increasing CO2 generally reduces stomatal conductivity19, indirectly impacting plant performance through its effects on air temperature and water stress. However, CO2 also directly influences plant metabolism, primarily through its role in photosynthesis, the entry point for carbon into the biosphere. It is generally accepted that crop yield increases with rising leaf photosynthesis under higher CO2 levels20.
Among all metabolic processes in plant cells, photosynthetic activity in chloroplasts is the most heat-sensitive. Photosynthesis can either tolerate moderately high temperatures due to reversible changes in the photosynthetic apparatus or suffer damage from severe heat21. Temperature is the primary factor controlling the functional performance of the photosynthetic apparatus in plants22. High temperatures can directly damage the photosynthetic apparatus21,23, with PSII being the primary target of heat-induced inactivation of photosynthetic membranes24. The direct destruction of PSII in vivo typically occurs above 40–45 °C25. Temperature conditions influence photosynthesis through direct or indirect effects on various thermally sensitive sites and processes, such as the electron transport chain, photosynthetic carbon reduction, sucrose synthesis, and carbon partitioning26.
Wheat (Triticum aestivum L.) is one of the world’s most important food crops27, providing 20% of the calorie intake for people worldwide28. Increasing greenhouse gas emissions have led to global warming and climate change, with elevated CO2 concentrations, water stress, and extreme temperatures posing serious threats to the photosynthetic efficiency and adaptation of plants, adversely affecting agricultural yields. Therefore, the main objective of this paper is to evaluate dryland wheat genotype photosynthesis under the individual and combined effects of climate change factors.
Materials and methods
Experimental regimes and plant growth set-up
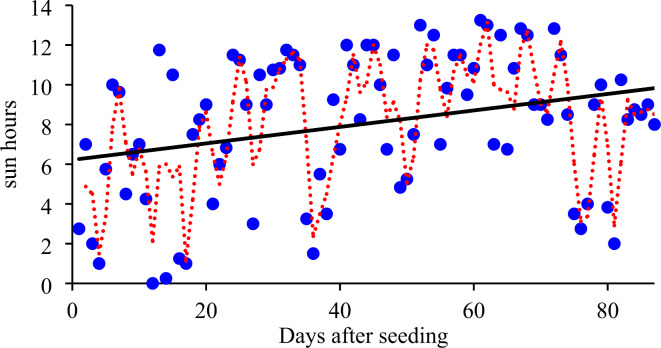
The experiment began by establishing climate conditions to simulate key factors associated with ongoing climate change: air temperature, water availability, and atmospheric CO2 concentration. A split-split-plot design with two replications was conducted in a greenhouse under natural light and a constant humidity of 41.7% RH (Fig. 1). The complete randomized design (CRD) included temperature (optimal 25 ± 3 °C and elevated 34 ± 3 °C) as the main plot factor, CO2 concentration (380 ± 50 and 800 ± 50 ppm) as the sub-plot factor, and irrigation regimes (50% field capacity and well-watered) as the sub-sub-plot factor across 10 wheat genotypes (Table 1) in 2022.
Fig. 1.
Changes in sun hours during the experiment at the site of study.
Table 1.
Type of the studied wheat genotypes.
| Name of variety | Variety type | Genome |
|---|---|---|
| Sardari | Winter | Bread wheat (hexaploid) |
| Ohadi | Winter | Bread wheat (hexaploid) |
| Baran | Winter | Bread wheat (hexaploid) |
| Varan | Winter | Bread wheat (hexaploid) |
| Hashtrod | Winter | Bread wheat (hexaploid) |
| Sadra | Winter | Bread wheat (hexaploid) |
| Ivan | Facultative | Bread wheat (hexaploid) |
| Rahmat | Winter | Bread wheat (hexaploid) |
| Rascon | Facultative | Durum wheat (tetraploid) |
| Zardasht | Facultative | Durum wheat (tetraploid) |
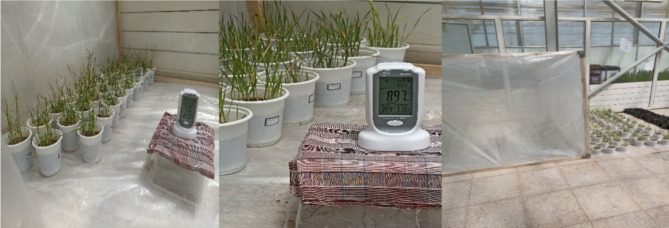
Genotypes were not considered a separate factor for chlorophyll fluorescence parameters; instead, the effects of each climate variable were assessed individually on each genotype. However, for electron transport rate (ETR) and stomatal conductance (GS), genotypes were treated as sub-sub-sub-plots. The elevated temperature and CO2 levels were selected based on projections for the year 2100 and previous studies. During the CO2 treatment, pots were placed in plastic enclosures, and CO2 was supplied from an industrial capsule, with concentrations monitored using a portable sensor (Fig. 2).
Fig. 2.
Pictures of the controlled site of the experiment in the greenhouse of Maragheh University.
The Dryland Agricultural Research Institute supplied seeds of the dryland wheat genotypes. After sterilization with Carboxin-tiram (2 per 1000), seeds were planted in a standard substrate. Seedlings were initially grown in pots (200 × 200 mm) and placed in climate chambers for treatment. During the first 10 days, seedlings were acclimated to conditions of 15/10 °C (maximum/minimum temperature), CO2 concentration of 400 ± 50 ppm, RH of 65–90%, light intensity of 800 µmol m-2 s-1, a 15/9-h light/dark cycle, and well-watered conditions. After acclimation, pots were subjected to the experimental treatments for temperature, CO2, and irrigation, while maintaining the same light intensity and duration.
Physiological parameters measurement
Two weeks after plant acclimatization, photosynthetic efficiency was assessed in the youngest fully developed leaves on the main shoot. Chlorophyll fluorescence parameters were measured using a Pulse Amplitude Modulated fluorometer (PAM–2500, Walz, Germany). Light-adapted chlorophyll fluorescence parameters were recorded between 11:00 and 12:00 h under sunny conditions, while dark-adapted parameters were measured after a dark adaptation period.
For dark-adapted measurements, leaves were acclimated to darkness for 15 min using dark leaf clips (DLC-8). Basal and maximum fluorescence were then measured with a low-intensity light pulse (8,000 μmol photons m-2 s-1, white light) applied for 1 second29. Following this, the stable fluorescence (Ft) was recorded under actinic light (685 μmol m-2 s-1). A light saturation pulse (8,000 μmol m-2 s-1) was then applied to measure minimal and maximal fluorescence, variable fluorescence, photochemical (qP, qL, and Y(II)), non-photochemical (qN, NPQ, Y(NPQ), and Y(NO)) quantum efficiency, and PSII electron transfer rate (ETR) in light-adapted leaves30.
Simultaneously with photosynthesis data collection, stomatal conductivity was recorded using a digital porometer (Korea Tech, 1301).
All chlorophyll fluorescence parameter data were analyzed using analysis of variance (ANOVA) based on the experimental design, with SAS version 9 software. The significance of chlorophyll fluorescence characteristics was evaluated under different climate change factors relative to the control (current climate conditions). Mean comparisons for GS and ETR were conducted using the LSD test at a 5% significance level, while the Duncan multiple range test (5%) was applied to other chlorophyll fluorescence parameters. Principal component analysis (PCA) and dendrogram analysis were performed using Minitab 21.4.1 software.
Results
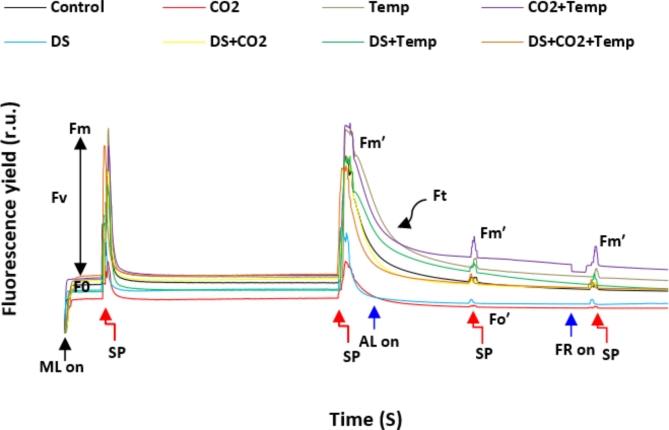
Our results indicated that the effects of elevated temperature (E temp), as well as its interactions with elevated CO2 (E CO2) and drought stress (DS), had a more pronounced impact on chlorophyll fluorescence performance (Ft) than other variables. The highest levels of maximal (Fm) and minimal (Fo) fluorescence in dark-adapted samples were observed under the combined treatments of E CO2 + E temp and E CO2 + E temp + DS. Increases in maximal (Fmʹ) and minimal (Foʹ) fluorescence were most noticeable under the E temp and E CO2 interaction. Conversely, the lowest maximal and minimal fluorescence values in both dark- and light-adapted conditions were recorded under the E CO2 treatment alone (Fig. 3).
Fig. 3.
Relative fluorescence yield curve with light saturation pulse and quenching analysis in dryland wheat under different variables of climate changes. ML, SP, AL, FR, control, CO2, Temp and DS are low-level of light, saturated light pulse, actinic light and far-red light, control, carbon dioxide, temperature and drought stress, respectively.
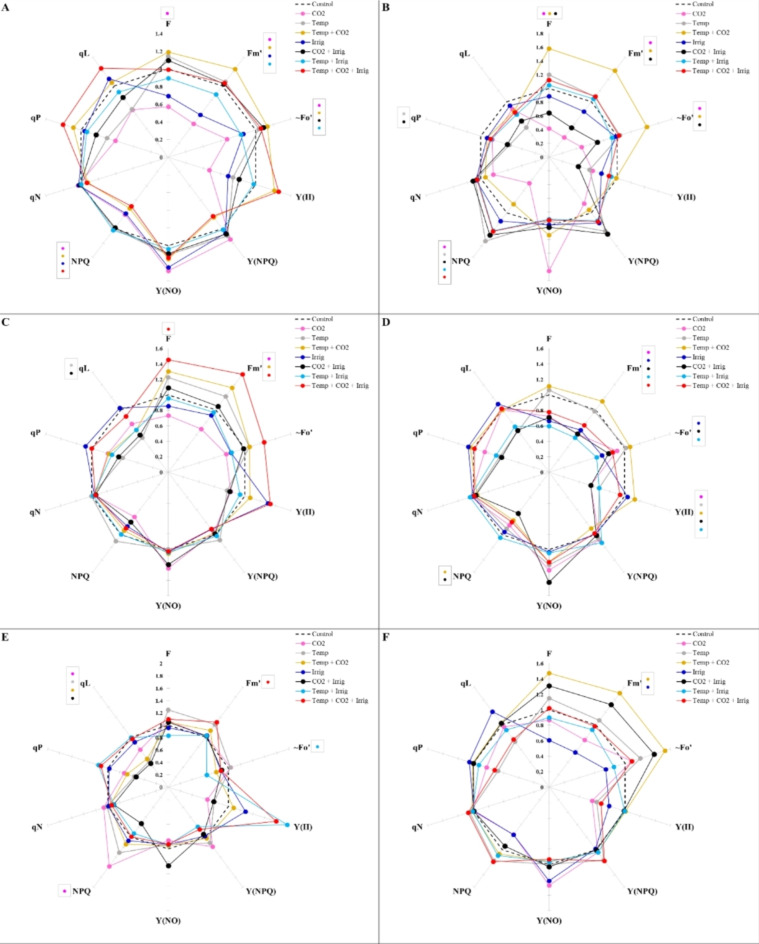
The evaluation of the spider plot for chlorophyll fluorescence parameters under different climate change variables compared to control conditions revealed that dryland wheat genotypes responded differently to single and combined climate change factors (Fig. 4). The effects of E CO2 and DS individually decreased F, Fmʹ, Foʹ, and NPQ in the Sardari genotype. The combination of E CO2 + E temp significantly increased Fmʹ and Foʹ while decreasing NPQ. Additionally, Foʹ increased with E CO2 + DS interaction, while E temp + DS interaction reduced both Fmʹ and Foʹ. The combined effects of all three variables (CO2, temp, and DS) significantly affected NPQ and qP, decreasing NPQ and increasing qP (Fig. 4A).
Fig. 4.
Spider plot curves of chlorophyll fluorescence parameters change in dryland wheat genotypes (A-Sardari, B-Ohadi, C-Sadra, D-Baran, E-Hashtrod, F-Varan, G-Ivan, H-Rahmat, I-Rascon, J-Zardasht) due to the single and combined effects of temperature, CO2 and drought stress. The various colors within the box representing the chlorophyll fluorescence parameters signify statistically significant differences at the 5% level, as determined by Duncan multiple range tests, when comparing climate change variables to the control (current climate condition).
In the Ohadi genotype, E CO2 alone reduced F, Fmʹ, Foʹ, and NPQ. Under E CO2 + E temp interaction, F, Fmʹ, and Foʹ increased, while these parameters decreased under E CO2 + DS. E temp alone and its combination with E CO2 + DS enhanced NPQ but reduced qP (Fig. 4B). In the Sadra genotype, the combination of E CO2 + E temp + DS increased F and Fmʹ. E CO2 + E temp alone also raised Fmʹ, though it decreased under E CO2 alone. E temp and the E CO2 + DS interaction reduced qP (Fig. 4C).
In the Baran genotype, individual effects of E CO2, DS, their interactions, and E temp + DS, as well as the combined impact of all three factors, decreased Fmʹ. DS alone, along with its interactions with E CO2 and E temp, reduced Foʹ. The effects of E CO2 and E temp individually decreased Y(II), but this parameter increased under their interactions. DS combined with E CO2 and E temp lowered Y(II) and NPQ (Fig. 4D).
For the Hashtrod genotype, significant effects were observed for Fmʹ under combined climate change variables, increasing this parameter. E temp + DS reduced Foʹ, while E CO2 increased NPQ. qL was sensitive and decreased under E CO2, E temp, and their interactions with DS (Fig. 4E). In Varan, only Fmʹ was significantly affected, increasing under E CO2 + E temp and decreasing under DS alone (Fig. 4F).
Ivan genotype was highly responsive to climate change factors, with significant effects from nearly all individual and combined treatments. E CO2 and DS alone reduced F, Foʹ, and Fmʹ, while E temp increased F and Fmʹ. NPQ decreased under E CO2 alone. The interaction of E CO2 + E temp increased Fmʹ, Y(II), qP, and qL, while Y(NPQ), NPQ, and qN declined. CO2 + DS interactions raised Fmʹ and Y(II). E temp + DS increased Y(II) and reduced NPQ. Combined climate change variables raised Foʹ, Y(NO), and qL, while lowering Y(II) and NPQ (Fig. 4G).
In the Rahmat genotype, E CO2 alone, along with E temp + DS, reduced F, Fmʹ, and Foʹ. F decreased while Y(II) increased under DS alone. The combination of E CO2 + E temp + DS reduced F and Fmʹ (Fig. 4H). For the Rascon genotype, E CO2 alone did not significantly impact F, Fmʹ, or Foʹ. However, E temp, DS, their interactions, and all three variables combined increased these parameters. Y(II) increased under the influence of all three variables, while Y(NPQ) and NPQ decreased under two- and three-way interactions. E temp and DS individually reduced Y(NO), whereas E CO2 + E temp increased it. Both qP and qL decreased with E temp interactions with E CO2 and DS but increased under all three variables combined (Fig. 4I).
Finally, in the Zardasht genotype, E CO2 alone decreased Fmʹ. E CO2, in combination with DS or with E temp + DS, reduced Y(II) (Fig. 4J).
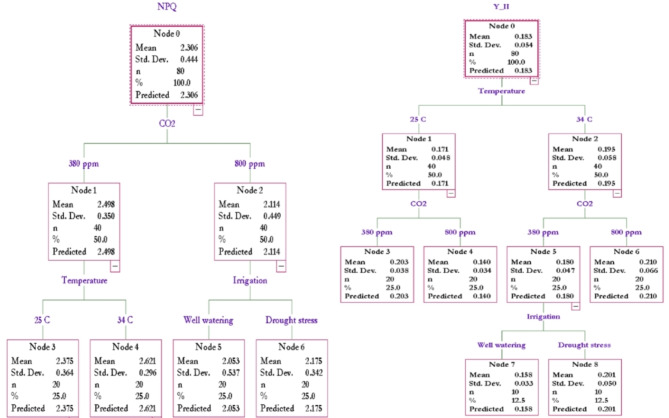
Classification and regression tree (CART) analysis was conducted on NPQ and Y(II) parameters. The results indicated that CO2 had a stronger influence on NPQ than temperature and drought stress. Under ambient CO2, temperature had a more significant effect than irrigation, with plants exposed to elevated temperatures showing higher NPQ levels compared to those under ambient temperature conditions. Under elevated CO2, the irrigation regime became more influential, with drought-stressed plants exhibiting higher NPQ levels.
The CART analysis for Y(II) revealed that temperature had a greater impact than CO2 levels and irrigation regimes. In ambient temperature (A temp), plants exposed to ambient CO2 (A CO2) showed higher Y(II) values, whereas under elevated temperature (E temp), plants under elevated CO2 (E CO2) had increased Y(II). Additionally, in conditions of E temp with A CO2, drought-stressed (DS) samples recorded elevated Y(II) levels (Fig. 5).
Fig. 5.
Classification and Regression Trees (CART) analysis on NPQ and Y(II) parameters under climate change variables (temperature, CO2 and drought stress) in dryland wheat. Means ± Standard Deviation (Std. Dev.).
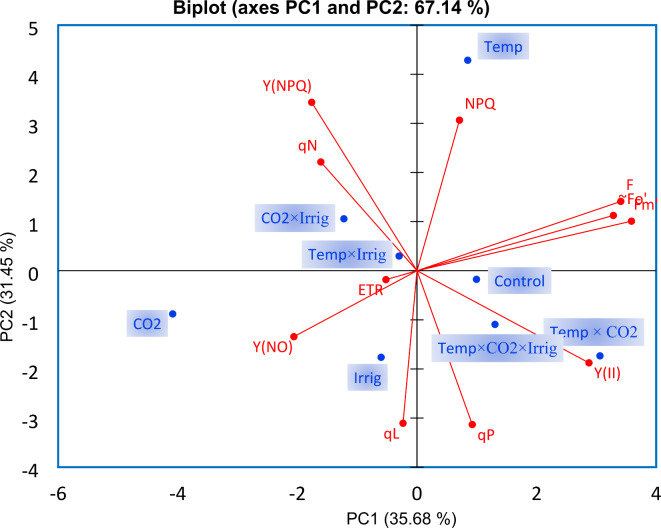
Principal component analysis (PCA) was utilized to identify relationships among various chlorophyll fluorescence parameters and climate change factors. The resulting model, comprising two components, explained 67.14% of the total variance. The first component (PC1) accounted for 36% of the variability, emphasizing key parameters linked to photosynthetic activity, particularly positive values of qP and Y(II). The second component (PC2), explaining 31% of the variability, highlighted qN and Y(NPQ) as primary variables, with an inverse relationship indicated by negative contributions from Y(NO) and qL.
Our analysis revealed notable relationships between chlorophyll fluorescence parameters and climate change variables, specifically: NPQ with temperature, Y(NO) with CO2, qL with drought stress, and both qP and Y(II) with the combined effects of temperature, CO2, and drought stress (Fig. 6).
Fig. 6.
Principal component analysis (PCA) was applied to the chlorophyll fluorescence parameter related to the climate change variables (temperature, CO2 and irrigation regimes). Two principal components (PC1 and PC2) resulted in a model that explained 67.14% of the total variance.
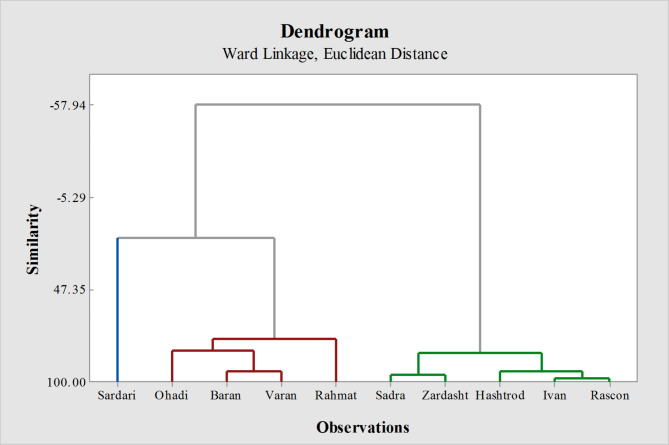
Cluster analysis of chlorophyll fluorescence led to the classification of the 10 genotypes into three primary groups. Sardari was placed in its own distinct cluster, while the other clusters included the Ohadi, Baran, Varan, and Rahmat genotypes. Additionally, Sadra, Zardasht, Hashtrod, Ivan, and Rascon were categorized into another separate cluster (Fig. 7).
Fig. 7.
Cluster analysis of 10 different dryland wheat genotypes for chlorophyll fluorescence as a result of the response to the climate change variables.
The analysis of variance for electron transport rate (ETR) and stomatal conductance (GS) revealed that CO2 levels, irrigation practices, and genotype each had a significant individual effect on both traits. However, temperature did not influence these traits. The ETR was notably influenced by the interactions between genotype and temperature, as well as between irrigation regime and CO2 levels. In contrast, GS was significantly affected by the interactions of genotype with CO2 (Table 2).
Table 2.
Analysis of variance of the electron transport rate (ETR) and stomatal conductance (gs) in dryland wheat genotypes under climate change variables.
| ANOVA | df | ETR | GS |
|---|---|---|---|
| Temperature (Temp) | 1 | 120.6ns | 65.42ns |
| Main plot error | 2 | 24.00 | 51.17ns |
| Carbon dioxide (CO2) | 1 | 162.5** | 594.1* |
| Temp × CO2 | 1 | 1.290ns | 55.57ns |
| Subplot error | 2 | 1.480 | 7.847 |
| Irrigation regime (Irrig) | 1 | 456.1** | 349.4* |
| Temp × Irrig | 1 | 30.70ns | 105.3ns |
| CO2 × Irrig | 1 | 12.09ns | 129.9ns |
| Temp × CO2 × Irrig | 1 | 41.69ns | 17.90ns |
| Sub-sub plot error | 4 | 8.435 | 31.45 |
| Genotype (Gen) | 9 | 107.4** | 100.6** |
| Temp × Gen | 9 | 4.009* | 4.560ns |
| CO2 × Gen | 9 | 2.841ns | 15.93** |
| Temp × CO2 × Gen | 9 | 8.512ns | 4.023ns |
| Irrig × Gen | 9 | 2.609** | 2.317ns |
| Temp × Irrig × Gen | 9 | 1.211ns | 2.152ns |
| CO2 × Irrig × Gen | 9 | 3.420* | 5.236ns |
| Temp × CO2 × Irrig × Gen | 9 | 0.908ns | 1.343ns |
| Sub-sub-sub plot error | 72 | 1.555 | 3.673 |
* & ** & ns indicate significance at the probability level of 5%, 1%, and not significant, respectively.
Under drought stress (DS) conditions, all genotypes exhibited lower ETR values compared to well-watered (WW) conditions in both ambient (A) and elevated (E) CO2 treatments. The E CO2 treatment resulted in lower ETR values across all genotypes compared to A CO2 under both WW and DS conditions. Among the genotypes, Sadra and Varan showed higher ETR values than the others. The ETR for the Sardari genotype remained stable across both A and E temperature conditions, whereas ETR decreased in other genotypes under elevated temperature (E temp) compared to ambient temperature (A temp) (Table 3).
Table 3.
Electron transport rate (ETR) of different dryland genotypes under combined interactions of the carbon dioxide, irrigation regimes, and temperature.
| CO2 × Irrig × Gen | Sardari | Ohadi | Sadra | Baran | Hashtrod | Varan | Ivan | Rahmat | Zardasht | Rascon | |
|---|---|---|---|---|---|---|---|---|---|---|---|
| A CO2 | WW | 19.87 cd | 24.06 b | 27.27 a | 25.09 ab | 26.14 a | 27.68 a | 25.04 ab | 22.95 c | 19.02 d | 20.36 c |
| DS | 18.12 de | 21.47 c | 21.41 c | 21.53 cd | 24.26 ab | 24.83 ab | 22.30 c | 20.96 cd | 16.96 de | 17.35 de | |
| E CO2 | WW | 19.19 d | 21.96 c | 26.24 a | 24.17 b | 25.19 ab | 26.93 a | 21.49 c | 20.27 cd | 18.06 de | 19.31 d |
| DS | 16.98 de | 19.35 d | 19.69 cd | 19.72 cd | 18.51 de | 20.23 cd | 19.38 d | 19.33 d | 15.20 e | 15.15 e | |
| Temp × Gen | |||||||||||
| A Temp | 18.69 b | 23.06 ab | 25.31 a | 24.02 a | 24.64 a | 25.53 a | 22.81 ab | 21.33 ab | 18.14 b | 18.35 b | |
| E Temp | 18.37 b | 20.36 b | 21.99 ab | 21.22 ab | 22.40 ab | 24.30 a | 21.29 b | 20.41 b | 16.47 bc | 17.7 bc | |
A CO2 (ambient CO2), E CO2 (elevated CO2), A Temp (ambient temperature), E Temp (elevated temperature), WW (well-watering), DS (drought stress). Different letters in each column indicate significant differences at 5% probability levels, Last Significant Differences (LSD) 5% for CO2 × Irrig × Gen = 1.95, and Temp × Gen = 2.51.
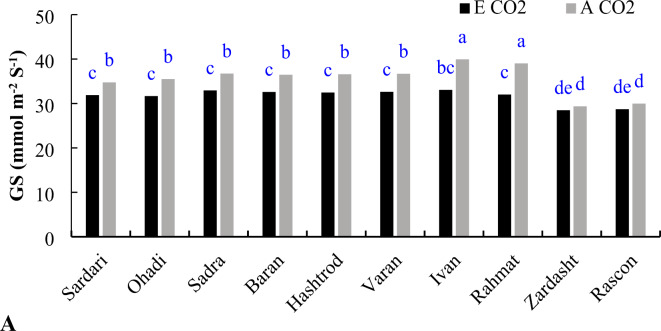
Elevated CO2 levels led to a reduction in stomatal conductance (GS) across all genotypes, though the extent of this decrease varied. For the Zardasht and Rascon genotypes, the reduction in GS under elevated CO2 (E CO2) was not statistically significant (P ≤ 0.05). In contrast, the Ivan and Rahmat genotypes showed a more pronounced decrease in GS under E CO2 compared to the other genotypes (Fig. 8A). Additionally, GS values were reduced under drought stress (DS) conditions (Fig. 8B).
Fig. 8.
Stomatal conductance of dryland wheat genotypes under different CO2 levels (A) and irrigation treatments (B). A CO2 (ambient CO2), E CO2 (elevated CO2), WW (well-watering), and DS (drought stress). Different letter in each column indicates significant differences at 5% probability levels, Last Significant Differences (LSD) 5% for CO2 × Gen = 2.05, and Irrigation = 2.46.
Discussion
Our results revealed a notable impact of temperature and CO2 on chlorophyll fluorescence performance (Ft), particularly evident in the increased levels of Fmʹ and Foʹ fluorescence (Fig. 3). In dark-acclimated samples, the primary stable electron acceptor of PSII, Qa, was fully oxidized. In the dare adapted samples, the minimal light intensity establishes the lowest achievable fluorescence level, known as Fo. When exposed to a light pulse, the maximum fluorescence level, Fm, is achieved. Fm and Fo are used to calculate variable fluorescence (Fv), which in turn determines the Fv/Fm ratio—a measure of the maximum quantum efficiency of PSII. When PSII reaction centers are exposed to a saturating light pulse under actinic light, they close, resulting in the highest fluorescence level in light-adapted conditions, known as Fmʹ. The steady-state fluorescence (Fs) observed when a equilibrium between the light-independent phase and light-dependent phase of photosynthesis is achieved, before switching off the actinic. The fluorescence level Foʹ is recorded after a far-red saturation pulse is initiated12,23,31,32.
The redox state of Qa significantly influences plant growth and development, acting as an energy balance sensor during stress33,34. If excess energy is not dissipated during stress, the restoration of the photosynthetic electron transfer chain may lead to damage caused by reactive oxygen species (ROS)35. In these situations, PSII undergoes photoinhibition, reducing the number of active PSII centers36.
The spider plot used to analyze chlorophyll fluorescence parameters revealed distinct responses of various wheat genotypes to both individual and combined climate change factors (Fig. 4). Genotypes like Ivan and Rascon (facultative wheat types) were identified as sensitive, while genotypes such as Sadra, Varan, Hashtrod (winter wheat types), and Zardasht (facultative wheat type) exhibited minimal response to future climate conditions. Key chlorophyll fluorescence parameters, including F, Fmʹ, Foʹ, Y(II), NPQ, and qL, were found to be particularly sensitive for studying climate change impacts on dryland genotypes.
The elevated CO2 (E CO2) treatment individually reduced chlorophyll fluorescence in nearly all genotypes. However, the individual effects of drought stress (DS) and elevated temperature (E temp) caused a decrease in Fmʹ and Foʹ in genotypes like Sardari and Baran, while resulting in an increase in Ivan and Rascon. Our findings demonstrated that the combination of E CO2 and E temp generally enhanced chlorophyll fluorescence parameters, whereas the combination of E CO2 and DS led to a decrease.
The combined impacts of climate change factors varied according to genotype and specific chlorophyll fluorescence parameters. For instance, NPQ decreased in Sardari, Ivan, and Rascon, but increased in the Ohadi genotype. Additionally, qP was enhanced in the Sardari and Rascon genotypes in response to multiple climate change variables (Fig. 4).
During intense drought periods, Fo levels increased, while Fm levels declined37,38. The rise in Fo during drought stress may be due to a reduced energy capture rate by PSII reaction centers, potentially caused by the physical separation of light-harvesting complexes from the PSII core38. This increase in fluorescence intensity is linked to the dissociation of photoreceptor complexes from PSII, the deactivation of PSII photochemical centers, or the inhibition of electron transfer from Qa to Qb39. Conversely, the decrease in Fm under stress conditions is associated with inhibited electron transfer from the PSII electron donor or structural changes in chlorophyll-binding proteins38.
Pan et al.40 demonstrated that the quantum yield of controlled energy dissipation in PSII (Y(NPQ)) increased with rising temperatures. Heat stress affects both the donor and acceptor sides of PSII, leading to reduced photosynthetic efficiency in plants41. While RuBisCO is most active at temperatures above 45 °C, it performs optimally within 30–45 °C. When temperatures exceed 30 °C, RuBisCO deactivates faster than it remains active42. During drought or heat stress, plants reduce PSII activity and increase NPQ by limiting electron availability, partly through an increase in inactive RuBisCO43.
The decline in qP levels, illustrated in Fig. 3, results from the closure of PSII reaction centers, influenced by both individual and combined climate change factors. The qP ratio, which indicates the proportion of open reaction centers, is essential for assessing photoinhibition and fluorescence photoprotective quenching44. The quantum yield of non-regulated energy dissipation in PSII (Y(NO)) also rises under stress, contributing to photoprotective processes, as supported by findings from Brestic et al.45 and our results (Fig. 4).
The analysis using classification and regression trees showed that CO2 had a more significant impact on NPQ values than temperature or irrigation practices. Conversely, temperature exerted a stronger influence on Y(II) compared to CO2 and irrigation regimes, as illustrated in Fig. 5. The non-photochemical quenching parameter (NPQ), which represents heat dissipation via the xanthophyll cycle46,47, increased under the combined effects of climate change variables (Fig. 5). This increase is associated with the absence of CO2 assimilation restrictions and the equilibrium of photochemical reactions in PSII, resulting in a higher quantum yield of controlled energy dissipation in PSII (Y(NPQ)). This parameter quantifies oxidative damage specifically within chloroplasts, as described by Ruban48.
The rise in NPQ negatively impacts the electron transport rate (ETR) in PSII by dispersing absorbed energy, yet it serves an essential protective role by preventing the formation of reactive oxygen species (ROS)49. Meanwhile, the quantum yield of photochemical energy conversion in PSII (Y(II)), which indicates the proportion of absorbed light used in photochemical reactions, increased under elevated temperature and drought stress, consistent with findings by Genty et al.50.
We found a negative link between PSII photochemical efficiency and non-photochemical quenching characteristics, as shown in Fig. 6. This confirms that the excess energy consumption in the form of heat and the maintenance of PSII electron acceptors’ oxidation is not enough. This phenomenon may account for the decreased maximum photochemical efficiency of wheat when subjected to temperature and drought stress.
Under drought stress, both ambient and elevated CO2 treatments led to reduced ETR in wheat genotypes, with the elevated CO2 treatment showing lower ETR compared to ambient CO2 under both well-watered and drought conditions (Table 3). While rising CO2 levels enhance photosynthesis and promote plant growth, higher temperatures and an increased respiration rate negatively impact plant performance51,52. Elevated CO2 can mitigate drought’s adverse effects by regulating stomatal closure, reducing stomatal conductance and transpiration, enhancing water use efficiency (WUE), and ultimately improving plant water status and development53,54.
Plants adjust stomatal size and arrangement to optimize conductance (GS) under stress. In cereals, guard cells with a dumbbell shape become smaller to facilitate closure through enhanced ion transport, allowing faster GS adjustments and positively influencing WUE55. Changes in GS help control water loss through transpiration while increasing CO2 absorption, thus regulating photosynthesis55. During drought, crops reduce GS to minimize water loss and increase transpiration efficiency. Heat stress during the vegetative stage reduces CO2 uptake and usage, but elevated atmospheric CO2 lessens this impact on photosynthesis. Higher temperatures decrease CO2 solubility relative to O2 in water and reduce RuBisCO’s selectivity for CO2, leading to a preference for oxygenation over carboxylation in C₃ plants. Elevated CO2 inhibits photorespiration, enhances ribulose bisphosphate regeneration, and boosts photosynthesis49,56.
Elevated CO2 significantly reduces stomatal opening and water loss through transpiration, thereby improving WUE in wheat, consistent with previous findings. Lower GS and partial stomatal closure increase leaf resistance, reducing water loss—an essential mechanism for dryland wheat genotypes. Tozzi et al.43 found that ETR remains stable under high temperature and/or drought stress, indicating that RuBP regeneration is not limited by photochemical reactions, allowing C₃ plants to favor oxygenation. Our findings align with these observations: elevated CO2 decreases GS and transpiration, enhancing WUE in wheat (Fig. 8)57–59. SARDARI’S stable ETR under heat and drought stress (Table 3) further suggests that RuBP regeneration is unaffected by photochemical limitations43.
Conclusion
Climate change is a major determinant of future food and nutritional security. Our findings revealed that different wheat genotypes responded distinctly to both individual and combined climate change factors. Among the winter wheat genotypes, Sardari demonstrated notable tolerance to the projected climate conditions in Iran. Conversely, Ivan, a facultative genotype and a newly released variety from DARI, showed improvements in Y(II), qP, and qL under the interactive effects of climate change variables. Both Sardari and Ivan exhibited enhanced regulation of GS and ETR under elevated temperature and CO2 levels compared to other genotypes. The stable ETR observed under increased temperature and/or drought stress suggests that RuBP regeneration is not limited by photochemical processes.
Our analysis of the relationships between chlorophyll fluorescence parameters and climate change factors indicated significant correlations, such as variations in NPQ with temperature, Y(NO) with CO2 levels, qL in response to drought stress, and both qP and Y(II) in relation to interactions among temperature, CO2, and drought stress. Beyond fundamental chlorophyll fluorescence parameters like Fm and Fo, the evaluation of NPQ and Y(II) efficiency is crucial for understanding the impact of climate change on dryland wheat genotypes. We propose that these parameters could serve as valuable biomarkers in breeding programs aimed at enhancing plant adaptation to future climatic conditions.
Electronic supplementary material
Below is the link to the electronic supplementary material.
Abbreviations
- F
Fluorescence value
- Fm and Fm′
Maximal fluorescence yield of the dark and light-adapted state, respectively
- Fo and Fo′
Minimal fluorescence yield of the dark and light-adapted state, respectively
- Fv
Variable fluorescence
- Y (II)
The effective quantum yield of photochemical energy conversion in PSII
- Y (NPQ)
Quantum yield of regulated energy dissipation in PSII
- Y(NO)
Quantum yield of non-regulated energy dissipation in PSII
- NPQ
Non-photochemical quenching
- qN
Non-photochemical quenching coefficient
- qP
Photochemical quenching coefficient
- qL
Photochemical quenching coefficient of variable fluorescence based on the lake model of PSII
- ETR
Electron transport rate
- Gs
Stomatal conductance
Author contributions
R.L. wrote the main manuscript text. F.E.S. prepared tables and manuscript format. A.M. analyzed the data and prepared the figures. E.Z. analyzed the data and discussed the genotype’s performance. A.A. discussed the results. H.M.K. revised the manuscript and completed the result and discussion. Finally, all Authors developed the final manuscript.
Data availability
The datasets used and/or analyzed during the current study are available from the corresponding author on reasonable request.
Declarations
Competing interests
The authors declare no competing interests.
Footnotes
Publisher’s note
Springer Nature remains neutral with regard to jurisdictional claims in published maps and institutional affiliations.
Contributor Information
Ramin Lotfi, Email: r.lotfi1988@gmail.com.
Hazem M. Kalaji, Email: hazem@kalaji.pl
References
- 1.Lotfi, R. & Pessarakli, M. Effects of crop rotation and tillage on winter wheat growth and yield under cold dryland conditions. Crops3(2), 88–100 (2023). [Google Scholar]
- 2.IPCC. Climate Change. The Physical Science Basis. In Contribution of Working Group I to the Sixth Assessment Report of the Intergovernmental Panel on Climate Change. Cambridge University Press. New York, NY, USA (2021).
- 3.Baier, M., Kandlbinder, A., Golldack, D. & Dietz, K. J. Oxidative stress and ozone: Perception, signaling and response. Plant Cell Environment28, 1012–1020 (2005). [Google Scholar]
- 4.Al-Rawahya, S. H., Sulaimana, H., Farooqa, S. A., Karam, M. F. & Sherwani, N. Effect of O3 and CO2 levels on growth, biochemical and nutrient parameters of alfalfa (Medicago sativa). Procedia APCBEE5, 288–295 (2013). [Google Scholar]
- 5.Lobell, D. B., Tommaso, S. D. & Burney, J. A. Globally ubiquitous negative effects of nitrogen dioxide on crop growth. Science Advances8, 22 (2022). [DOI] [PMC free article] [PubMed] [Google Scholar]
- 6.Li, L., Wei, S. & Shen, W. The role of methane in plant physiology: A review. Plant Cell Report39, 171–179 (2020). [DOI] [PubMed] [Google Scholar]
- 7.Iqbal, N. et al. Nitric oxide and abscisic acid mediate heat stress tolerance through regulation of osmolytes and antioxidants to protect photosynthesis and growth in wheat plants. Antioxidants11, 372 (2022). [DOI] [PMC free article] [PubMed] [Google Scholar]
- 8.Asseng, S. et al. Rising temperatures reduce global wheat production. Nature climate change5, 143–147 (2015). [Google Scholar]
- 9.Prasad, P. V. & Djanaguiraman, M. Response of floret fertility and individual grain weight of wheat to high temperature stress: Sensitive stages and thresholds for temperature and duration. Functional Plant Biology41, 1261–1269 (2014). [DOI] [PubMed] [Google Scholar]
- 10.Aiqing, S. et al. Heat stress during flowering affects time of day of flowering, seed set, and grain quality in spring wheat. Crop Science58, 380–392 (2018). [Google Scholar]
- 11.Sehar, Z., Mir, I. R., Khan, S., Masood, A. & Khan, N. A. Nitric oxide and proline modulate redox homeostasis and photosynthetic metabolism in wheat plants under high temperature stress acclimation. Plants12, 1256 (2023). [DOI] [PMC free article] [PubMed] [Google Scholar]
- 12.Lotfi, R. et al. The role of potassium on drought resistance of winter wheat cultivars under cold dryland conditions: Probed by chlorophyll a fluorescence. Plant Physiology and Biochemistry182, 45–54 (2022). [DOI] [PubMed] [Google Scholar]
- 13.Katerji, N. et al. Durum wheat and barley productivity in saline–drought environments. European Journal of Agronomy31, 1–9 (2009). [Google Scholar]
- 14.Li, Q. et al. Effects of warming and drought stress on the coupling of photosynthesis and transpiration in winter wheat (Triticum aestivum L.). Applied Sciences13, 2759 (2023). [Google Scholar]
- 15.Lotfi, R., Gharavi-Kouchebagh, P. & Khoshvaghti, H. Biochemical and physiological responses of Brassica napus plants to humic acid under water stress. Russian Journal of Plant Physiology62, 480–486 (2015). [Google Scholar]
- 16.Kalaji, H. M. et al. Prompt chlorophyll fluorescence as a tool for crop phenotyping: an example of barley landraces exposed to various abiotic stress factors. Photosynthetica56, 953–961 (2018). [Google Scholar]
- 17.Ciais, P. et al. Carbon and other biogeochemical cycles. In Climate Change 2013: The Physical Science Basis. Contribution of Working Group I to the Fifth Assessment Report of the Intergovernmental Panel on Climate Change Change, pp 465–570. (Cambridge University Press, 2014).
- 18.Dusenge, M. E., Duarte, A. G. & Way, D. A. Plant carbon metabolism and climate change: Elevated CO 2 and temperature impacts on photosynthesis, photorespiration and respiration. New Phytologist221, 32–49 (2019). [DOI] [PubMed] [Google Scholar]
- 19.Evans, J. R. & Clarke, V. C. The nitrogen cost of photosynthesis. Journal of Experimental Botany70, 7–15 (2019). [DOI] [PubMed] [Google Scholar]
- 20.Wang, W. et al. Yield, dry matter distribution and photosynthetic characteristics of rice under elevated CO2 and increased temperature conditions. Field Crops Research248, 107605 (2020). [Google Scholar]
- 21.Brestic, M., Yang, X., Li, X. & Allakhverdiev, S. I. Crop photosynthesis for the twenty-first century. Photosynthesis Research150, 1–3 (2021). [DOI] [PubMed] [Google Scholar]
- 22.Zhang, J. et al. The effects of elevated CO2, elevated O3, elevated temperature, and drought on plant leaf gas exchanges: A global meta-analysis of experimental studies. Environmental Science and Pollution Research28, 15274–15289 (2021). [DOI] [PubMed] [Google Scholar]
- 23.Soufi, H., Kalaji, H. M., Hamidpour, M. & Malekzadeh, K. The roles of light in a plant factory: photosynthesis efficiency and gas exchange parameters of lettuce as a function of light spectra. Greenhouse Plant Production Journal1, 1–26 (2024). [Google Scholar]
- 24.Hou, H. J. & Allakhverdiev, S. I. Overview of recent advances in photosynthesis and nanotechnology. Photosynthesis, 3–8 (2023).
- 25.Sharkey, T. D. Effects of moderate heat stress on photosynthesis: Importance of thylakoid reactions, RuBisCO deactivation, reactive oxygen species, and thermotolerance provided by isoprene. Plant, cell & environment28, 269–277 (2005). [Google Scholar]
- 26.Zhu, H., Wu, Y. & Zheng, Y. Effects of heat shock on photosynthesis-related characteristics and lipid profile of C ycas multipinnata and C. panzhihuaensis. BMC Plant Biology22, 442 (2022). [DOI] [PMC free article] [PubMed] [Google Scholar]
- 27.Ainsworth, E. A. & Long, S. P. 30 years of free-air carbon dioxide enrichment (FACE): What have we learned about future crop productivity and its potential for adaptation?. Global Change Biology27, 27–49 (2021). [DOI] [PubMed] [Google Scholar]
- 28.FAO. Quarterly Global Report No. 1, Rome FAO. Rome, Italy )2020(.
- 29.Zaiyou, J., Xiaomin, T., Hongsheng, W. & Guifang, X. Evaluate the photosynthesis and chlorophyll fuorescence of Epimedium brevicornu Maxim. Scientific Report12, 19470 (2022). [DOI] [PMC free article] [PubMed] [Google Scholar]
- 30.Li, Q. M., Liu, B. B., Wu, Y. & Zou, Z. R. Interactive effects of drought stresses and elevated CO2 concentration on photochemistry efficiency of cucumber seedlings. Journal of Integrative Plant Biology50, 1307–1317 (2008). [DOI] [PubMed] [Google Scholar]
- 31.Garab, G., Magyar, M., Sipka, G. & Lambrev, P. H. New foundations for the physical mechanism of variable chlorophyll a fluorescence. Quantum efficiency versus the light-adapted state of photosystem II. Journal of Experimental Botany74, 5458–5471 (2023). [DOI] [PubMed] [Google Scholar]
- 32.Kalaji, H. M. et al. Frequently asked questions about chlorophyll fluorescence, the sequel. Photosynthesis research132, 13–66 (2017). [DOI] [PMC free article] [PubMed] [Google Scholar]
- 33.Lodeyro, A. F., Krapp, A. R. & Carrillo, N. Photosynthesis and chloroplast redox signaling in the age of global warming: Stress tolerance, acclimation, and developmental plasticity. Journal of Experimental Botany72, 5919–5937 (2021). [DOI] [PubMed] [Google Scholar]
- 34.Pfannschmidt, T. & Yang, C. The hidden function of photosynthesis: A sensing system for environmental conditions that regulates plant acclimation responses. Protoplasma249, 125–136 (2012). [DOI] [PubMed] [Google Scholar]
- 35.Tsabari, O. et al. Differential effects of ambient or diminished CO2 and O2 levels on thylakoid membrane structure in light-stressed plants. The Plant Journal81, 884–894 (2015). [DOI] [PubMed] [Google Scholar]
- 36.Serôdio, J. & Campbell, D. A. Photoinhibition in optically thick samples: Effects of light attenuation on chlorophyll fluorescence-based parameters. Journal of Theoretical Biology513, 110580 (2021). [DOI] [PubMed] [Google Scholar]
- 37.Lotfi, R. et al. Effects of humic acid on photosynthetic efficiency of rapeseed plants growing under different watering conditions. Photosynthetica56, 962–970 (2018). [Google Scholar]
- 38.Lotfi, R., Ghassemi-Golezani, K. & Pessarakli, M. Salicylic acid regulates photosynthetic electron transfer and stomatal conductance of mung bean (Vigna radiata L.) under salinity stress. Biocatalysis and Agricultural Biotechnology26, 101635 (2020). [Google Scholar]
- 39.Mathur, S., Agrawal, D. & Jajoo, A. Photosynthesis: Response to high temperature stress. Journal of Photochemistry and Photobiology B: Biology137, 116–126 (2014). [DOI] [PubMed] [Google Scholar]
- 40.Pan, C., Ahammed, G. J., Li, X. & Shi, K. Elevated CO2 improves photosynthesis under high temperature by attenuating the functional limitations to energy fluxes, electron transport and redox homeostasis in tomato leaves. Frontiers in plant science9, 418050 (2018). [DOI] [PMC free article] [PubMed] [Google Scholar]
- 41.Li, H. et al. Unraveling main limiting sites of photosynthesis under below-and above-ground heat stress in cucumber and the alleviatory role of luffa rootstock. Frontiers in Plant Science7, 183933 (2016). [DOI] [PMC free article] [PubMed] [Google Scholar]
- 42.Salvucci, M. E. & Crafts-Brandner, S. J. Inhibition of photosynthesis by heat stress: the activation state of RuBisCO as a limiting factor in photosynthesis. Physiologia plantarum120, 179–186 (2004). [DOI] [PubMed] [Google Scholar]
- 43.Tozzi, E. S., Easlon, H. M. & Richards, J. H. Interactive effects of water, light and heat stress on photosynthesis in Fremont cottonwood. Plant, Cell & Environment36, 1423–1434 (2013). [DOI] [PubMed] [Google Scholar]
- 44.Ruban, A. V. & Murchie, E. H. Assessing the photoprotective effectiveness of non-photochemical chlorophyll fluorescence quenching: a new approach. Biochimica et Biophysica Acta (BBA) Bioenergetics1817, 977–982 (2012). [DOI] [PubMed] [Google Scholar]
- 45.Brestic, M. et al. Wheat plant selection for high yields entailed improvement of leaf anatomical and biochemical traits including tolerance to non-optimal temperature conditions. Photosynthesis Research136, 245–255 (2018). [DOI] [PubMed] [Google Scholar]
- 46.Pinnola, A. et al. Zeaxanthin binds to light-harvesting complex stress-related protein to enhance nonphotochemical quenching in Physcomitrella patens. The Plant Cell25, 3519–3534 (2013). [DOI] [PMC free article] [PubMed] [Google Scholar]
- 47.Ledvinka, H. D. et al. The impact of drought, heat and elevated carbon dioxide levels on feed grain quality for poultry production. Agriculture12, 1913 (2022). [Google Scholar]
- 48.Ruban, A. V. Nonphotochemical chlorophyll fluorescence quenching: mechanism and effectiveness in protecting plants from photodamage. Plant physiology170, 1903–1916 (2016). [DOI] [PMC free article] [PubMed] [Google Scholar]
- 49.Stamelou, M. L., Sperdouli, I., Pyrri, I., Adamakis, I. D. S. & Moustakas, M. Hormetic responses of photosystem II in tomato to Botrytis cinerea. Plants10, 521 (2021). [DOI] [PMC free article] [PubMed] [Google Scholar]
- 50.Genty, B., Briantais, J. M. & Baker, N. R. The relationship between the quantum yield of photosynthetic electron transport and quenching of chlorophyll fluorescence. Biochimica et Biophysica Acta (BBA)-General Subjects990, 87–92 (1989). [Google Scholar]
- 51.Broberg, M. C., Högy, P., Feng, Z. & Pleijel, H. Effects of elevated CO2 on wheat yield: Non-linear response and relation to site productivity. Agronomy9, 243 (2019). [Google Scholar]
- 52.Malhi, G. S., Kaur, M. & Kaushik, P. Impact of climate change on agriculture and its mitigation strategies: A review. Sustainability13, 1318 (2021). [Google Scholar]
- 53.Li, Y., Li, X., Yu, J. & Liu, F. Effect of the transgenerational exposure to elevated CO2 on the drought response of winter wheat: Stomatal control and water use efficiency. Environmental and Experimental Botany136, 78–84 (2017). [Google Scholar]
- 54.Abdelhakim, L. O. A. et al. The effect of individual and combined drought and heat stress under elevated CO2 on physiological responses in spring wheat genotypes. Plant Physiology and Biochemistry162, 301–314 (2021). [DOI] [PubMed] [Google Scholar]
- 55.Bertolino, L. T., Caine, R. S. & Gray, J. E. Impact of stomatal density and morphology on water-use efficiency in a changing world. Frontiers in plant science10, 427588 (2019). [DOI] [PMC free article] [PubMed] [Google Scholar]
- 56.Kadam, N. N. et al. Agronomic and physiological responses to high temperature, drought, and elevated CO2 interactions in cereals. Advances in agronomy127, 111–156 (2014). [Google Scholar]
- 57.Li, D. et al. Effects of elevated CO2 on the growth, seed yield, and water use efficiency of soybean (Glycine max (L.) Merr.) under drought stress. Agricultural Water Management129, 105–112 (2013). [Google Scholar]
- 58.Li, S., Li, X., Wei, Z. & Liu, F. ABA-mediated modulation of elevated CO2 on stomatal response to drought. Current Opinion in Plant Biology56, 174–180 (2020). [DOI] [PubMed] [Google Scholar]
- 59.Ulfat, A., Shokat, S. & Liu, F. Elevated CO2 improves the performance of bread wheat under drought stress through better physiological responses and grain yield. Plant Stress, 100493 (2024).
Associated Data
This section collects any data citations, data availability statements, or supplementary materials included in this article.
Supplementary Materials
Data Availability Statement
The datasets used and/or analyzed during the current study are available from the corresponding author on reasonable request.


