

Summary
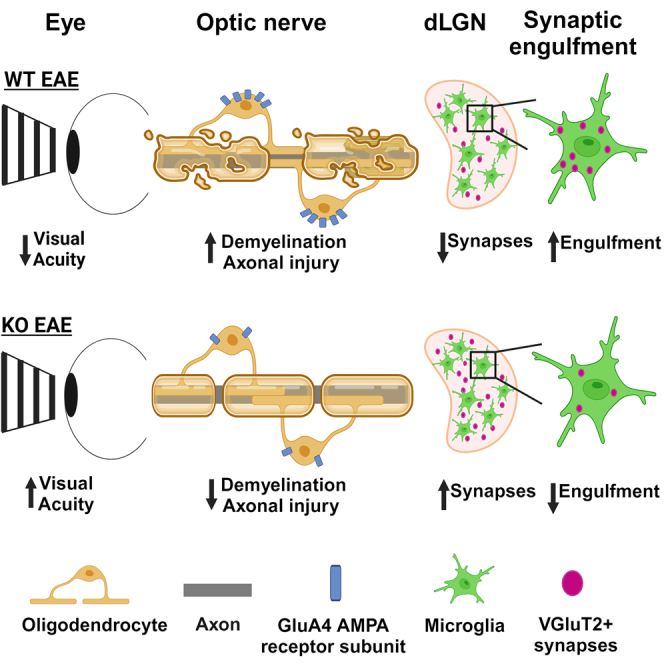
Multiple sclerosis (MS) is initially characterized by myelin and axonal damage in central nervous system white matter lesions, but their causal role in synapse loss remains undefined. Gray matter atrophy is also present early in MS, making it unclear if synaptic alterations are driven by white matter demyelinating lesions or primary gray matter damage. Furthermore, whether axonal pathology occurs secondary to or independent of demyelination to drive synaptic changes is not clear. Here, we address whether reducing demyelination by selectively manipulating glutamatergic signaling in mature oligodendrocytes (OLs) preserves synapses in experimental autoimmune encephalomyelitis (EAE), a preclinical model of demyelinating disease. We demonstrate that inducible reduction of the GluA4 AMPA-type glutamate receptor subunit selectively in mature (OLs) reduces demyelination and axonal injury, preserves synapses, and improves visual function during EAE. These data link demyelination to the pathophysiology of synaptic loss with therapeutic implications for both motor and cognitive disability in MS.
Subject areas: Cell biology, Immunology, Neuroscience
Graphical abstract
Highlights
-
•
Reducing AMPA-type glutamate receptor signaling in oligodendrocytes preserves synapses
-
•
Reducing demyelination attenuates microglia-mediated synaptic engulfment
-
•
Reducing demyelination preserves axons, synapses, and improves visual acuity
Cell biology; Immunology; Neuroscience
Introduction
Synapse loss has been documented in various gray matter regions in human postmortem multiple sclerosis (MS) brains1,2 and animal models of autoimmune demyelination.2,3,4 Given the essential role of synapses in circuit function and connectivity, elucidating the mechanisms that drive synaptic deficits in MS has important therapeutic implications for improving motor and cognitive dysfunction. Transected axons are found in active white matter demyelinating lesions, characterized by immune cell infiltrates, supporting their role in long-term disease progression.5 Additionally, at the time of MS diagnosis, there is evidence of prior white matter lesions by MRI imaging6 and inflammatory gene and cytokine expression profiles are detected during remission.7,8 Immunomodulatory therapies reduce the relapse rate and number of active white matter demyelinating lesions by regulating peripheral immune cell activation and infiltration into the central nervous system (CNS).9 However, progressive neurodegeneration with permanent clinical disability ensues. This is referred to as progression independent of relapse activity, or PIRA,10 emphasizing a critically unmet need for neuroprotective strategies in MS. Evidence of gray matter atrophy also occurs early in MS,11 making it unclear if axonal injury in white matter lesions gives rise to synaptic changes in the gray matter or results from independent inflammatory processes.
The thalamus is a deep gray matter structure that receives afferent and efferent projections from white matter regions in the brain. Thalamic volume is one of the strongest predictors of clinical disease progression in MS12 and associates with damage in these afferent and efferent projections as opposed to demyelinating lesions directly in the thalamus.13 In this regard, we previously found that imaging measures of optic nerve fiber atrophy correlated with thalamic atrophy and neuroperformance measures in experimental autoimmune encephalomyelitis (EAE) and in people with MS independent of a history of optic neuritis.4 Optic nerve inflammation and atrophy14,15 as well as synapse loss in the dorsal lateral geniculate nucleus (dLGN) of the thalamus2 are also observed in postmortem MS optic nerves and brains. Optic nerve axons provide synaptic input into the dLGN, thus making the anterior visual pathway an important and clinically relevant system to explore the relationship between demyelination and synaptic loss.
We published that T cell infiltration, demyelination, and axonal injury in optic nerves from mice with EAE are concurrent with these same pathologies in spinal cord white matter, where EAE is traditionally studied, and coincides with synaptic loss in the dLGN.4 Although demyelination is known to negatively impact axons,16 the precise contribution of myelin damage to synaptic pathology in MS is not known. Indeed, whether axonal alterations occur secondary to or independent of demyelination to drive synaptic changes is not clear. Previous work has shown that synapse loss can be detected in the dLGN prior to evidence of demyelination and altered axon structure in the optic nerve or loss of retinal ganglion cells.2 Other studies provide evidence that mitochondrial trafficking in axons is impaired before structural changes in axons are apparent in autoimmune demyelination,17 which may have important ramifications for the high energy demand for synapses. Altered axonal mitochondria trafficking was shown to be caused by demyelination prior to structural changes in axons, which could be rescued by increasing mitochondria biogenesis in neurons.16 Taken together, these data suggest that subtle changes to myelin and/or axons may drive synaptic loss. Therefore, we proposed the hypothesis that therapeutic strategies to attenuate demyelination will prevent not only axonal injury but also synaptic loss.
Results
Selective reduction of AMPAR signaling in mature oligodendrocytes preserves myelinated optic nerve axons in EAE at peak of disease
Excess extracellular glutamate that leads to over-activation of glutamate receptors, which elicits calcium-mediated cell death, is referred to as excitotoxicity. Excitotoxicity has been documented in MS and EAE, and is associated with the appearance of new T2-visible white matter lesions in MS.18,19,20,21 AMPA-type glutamate receptor (AMPAR) antagonists have shown efficacy in attenuating EAE,22,23,24 but it is unclear if these effects are mediated by reducing oligodendrocyte (OL) damage or directly impacting neurons. Excitotoxicity to OLs and neurons is regulated by GluA2-lacking, Ca2+-permeable AMPARs composed of varying combinations of subunits GluA1, 3, and 4.25 AMPARs mediate the majority of calcium influx into the soma of mature OLs.26,27 The GluA4 AMPAR subunit in particular is robustly expressed in both adult rodent26,28 and human29,30 OLs in the brain, spinal cord,31 and optic nerve.32 We previously showed that inducible deletion of the AMPAR subunit GluA4 in mature OLs using the proteolipid protein (PLP) promotor resulted in a functional reduction in OL-specific AMPAR-mediated calcium influx in optic nerves.26 These data were consistent with reduced optic nerve GluA4 transcript, with no change in GluA1, 2, 3, or most other ionotropic glutamate receptor transcripts. We further demonstrated that selective deletion of GluA4 from mature OLs attenuated loss of myelinated axons in the spinal cord and improved motor function during the chronic phase of EAE.26 Here, we leverage conditional deletion of GluA4 from oligodendrocytes as a genetic tool to test how preservation of myelin impacts synaptic loss. In the present study, we explored if selective deletion of GluA4 in mature OLs attenuated axonal injury to affect synaptic loss in the visual system where myelinated optic nerve axons and their associated synaptic terminals in the dLGN are spatially distinct (Figure 1A).
Figure 1.

Inducible reduction of AMPAR signaling in mature OLs attenuates demyelination and loss of myelinated axons in optic nerves during EAE peak of disease
(A) Diagram of the retino-geniculate pathway.
(B) EAE clinical scores from PLPcreER−:GluA4fl/fl (WT; black line) and PLPcreER+:GluA4fl/fl (KO; red line) mice. Two-tailed Mann-Whitney test, p = 0.9933, n = 25 WT and n = 19 KO mice from 4 independent experiments. All EAE mice were assessed at peak of disease, approximately 16–18 days post-EAE induction (dpi).
(C and D) Representative optic nerve images of (C) immunohistochemical staining of myelin basic protein (MBP), scale bars, 100 μm and (D) electron micrograph (EM) images, scale bars, 1 μm.
(E) Quantification of demyelinated area using MBP staining from naive (n = 6), WT EAE (n = 5), or KO EAE (n = 4) mice, 4 sections per mouse. Naive vs. WT EAE, ∗∗∗p = 0.0005; naive vs. KO EAE, ∗p = 0.0439; WT EAE vs. KO EAE, ∗p = 0.0439.
(F and G) Quantification of (F) total axons (naive compared to WT EAE, ∗p = 0.0455; naive compared to KO EAE, p = 0.4327; WT EAE compared to KO EAE, ∗p = 0.0245), (G) myelinated axons (naive vs. WT EAE, ∗∗p = 0.0023; naive vs. KO EAE, p = 0.5004; WT EAE vs. KO EAE, ∗p = 0.0135, and (H) unmyelinated axons (naive vs. WT EAE, #p = 0.0591; naive vs. KO EAE, ∗p = 0.0174; WT EAE vs. KO EAE, p = 0.2850) in TEM images from n = 6 naive, 6 WT EAE, and 4 KO EAE mice, 6 images per mouse. Data expressed as mean ± SEM. Statistical differences determined using one-way ANOVA with Šidák multiple comparison tests, n.s. = not significant.
Electron microscopy (EM) was performed in optic nerves from 9-week-old PLPcreER+:GluA4fl/fl (referred to as KO) and littermate control (PLPcreER-:GluA4fl/fl, referred to as WT) mice after tamoxifen administration before induction of EAE (naive) to assess if conditional deletion of GluA4 generated any structural changes to myelin. Measurement of g-ratios (ratio of axon diameter to axon and myelin diameter) showed no statistically significant differences between groups (Figures S1A and S1B). Plotting g-ratio as a function of axon diameter revealed reduced myelin thickness in some axons in KO mice compared to WT (Figures S1C and S1D). However, the number and percentage of myelinated axons (Figures S1E and S1F), unmyelinated axons (Figures S1G and S1H), total axons (Figure S1I), and axon diameter (Figures S1J–S1M) were unchanged between WT and KO optic nerves. Thus, similar to our published findings in the spinal cord,26 inducible deletion of GluA4 from mature OLs in adult mice did not impact the overall integrity of the optic nerve.
Following EAE induction, mice were evaluated at peak of clinical disease (16–18 days post-EAE induction, dpi) when T cells acutely extravasate into both spinal cord white matter and optic nerves.4 As expected, there was no change in peak clinical scores between WT EAE and KO EAE mice (Figure 1B) reflecting no change in peripheral CNS-infiltrating immune cells. This was confirmed by quantifying the number of CD3+ T cells in optic nerves between WT EAE and KO EAE mice, which showed no significant difference (Figure S2), suggesting a comparable T cell mediated inflammatory response that is required to induce EAE. Furthermore, reactive gliosis assessed by immunofluorescent staining of Iba1+ myeloid cells (Figures S3A and S3B) and GFAP+ astrocytes (Figures S3C and S3D) was not significantly altered in optic nerves between WT EAE and KO EAE mice.
Next, demyelination in optic nerves was evaluated using immunohistochemical staining to detect myelin basic protein (MBP). Quantification of demyelination was determined across entire longitudinal sections of the optic nerve (Figure S4). Demyelination in the optic nerves was reduced in KO EAE compared to WT EAE mice (Figures 1C–1E). Correspondingly, using EM, the total number of optic nerve axons from KO EAE was significantly higher than WT EAE and not significantly different from naive mice (Figures 1D–1F). Similarly, numbers of myelinated optic nerve axons in KO EAE were comparable to naive mice, but WT EAE had significantly lower numbers of myelinated axons compared to either KO EAE or naive mice (Figure 1G). Unmyelinated optic nerve axon numbers were not significantly different between WT EAE and KO EAE mice (Figure 1H). Therefore, inducible reduction of GluA4 in mature OLs selectively preserved myelinated axons in optic nerves during the acute phase of EAE.
We and others have previously demonstrated that axon loss in the optic nerve precedes loss of retinal ganglion cell (RGC) somas during EAE,4,33 and in people with MS, where reduced axial diffusivity in the optic nerve preceded thinning of the retinal nerve fiber layer.34 Despite the eventual loss of RGCs, there is no evidence of CNS-infiltrating T cells in the retina during EAE4 suggesting that loss of RGC somas is secondary to axonal damage in the optic nerve. However, to confirm the absence of confounding issues in KO versus WT EAE mice, histopathological analysis of the retina was performed at peak of disease. T cell infiltration was not found in retinas from WT or KO mice subjected to EAE compared to naive mice (Figure S2). Overall numbers of RGCs were similar between naive, WT EAE, and KO EAE (Figures 2A–2C) mice and in each of the 3 separate regions assessed (Figures 2D–2F), mean values included in Table 1. To evaluate any retinal inflammatory responses, Iba1+ myeloid cells (Figures 2G–2I) and GFAP+ astrocytes (Figures 2J–2L) were assessed in the total retina (Figures 2H–2K) and selectively in the retinal nerve fiber and ganglion cell layers (RNFL, GCL, Figures 2I–2L), and no differences were found between groups. These data support that induction of EAE in WT and KO mice does not affect retinal integrity at peak of disease compared to naive mice.
Figure 2.

No change in RGC number or reactive gliosis in the retina at EAE peak of disease
(A) Diagram of a retinal flatmount. 12 total images were taken per flatmount from the 1/6, 3/6, and 5/6 regions in each of 4 leaflets from n = 6 naive, 5 WT EAE and 4 KO EAE mice.
(B) Confocal images of Brn3a+ and bisbenzimide+ (Bis) retinal ganglion cells (RGCs) in naive, PLPcreER−:GluA4fl/fl (WT) EAE, and PLPcreER+:GluA4fl/fl (KO) EAE mice. Scale bars, 10 μm. Quantification of (C) total Brn3a+ RGCs cells (naive vs. WT EAE, p = 0.2291; naive vs. KO EAE, p = 0.2934; WT EAE vs. KO EAE, p = 0.7970) and (D–F) in the 1/6, 3/6, or 5/6 region of the retinal flatmount.
(D) Naive vs. WT EAE, p = 0.4556; naive vs. KO EAE, p = 0.1795; WT EAE vs. KO EAE, p = 0.4556.
(E) Naive vs. WT EAE, p = 0.5790; naive vs. KO EAE, p = 0.8177; WT EAE vs. KO EAE, p = 0.5790.
(F) Naive vs. WT EAE, p = 0.7922; naive vs. KO EAE, p = 0.8853; WT EAE vs. KO EAE, p = 0.7922.
(G–I) (G) Representative images of Iba1+ microglia/macrophages and Bis+ nuclei in the retina. Scale bars, 20 μm. Quantification of Iba1+ percent area (H) in the total retina (naive vs. WT EAE, p = 0.7333; naive vs. KO EAE, p = 0.4729; WT EAE vs. KO EAE, p = 0.7333) and (I) in the RNFL/GCL (naive vs. WT EAE, p = 0.8580; naive vs. KO EAE, p = 0.8303; WT EAE vs. KO EAE, p = 0.8580).
(J–L) (J) Representative images of GFAP+ astrocytes and Bis+ nuclei in the retina. Scale bars, 20 μm. Quantification of GFAP+ percent area (K) in the total retina (naive vs. WT EAE, p = 0.9716; naive vs. KO EAE, p = 0.7847; WT EAE vs. KO EAE, p = 0.7847) and (L) in the RNFL/GCL (naive vs. WT EAE, p = 0.9592; naive vs. KO EAE, p = 0.9592; WT EAE vs. KO EAE, p = 0.9796). Iba1 and GFAP were quantified in 7–8 images from 2 to 4 sections per mouse. Data expressed as mean ± SEM, n = 6 naive, 5 WT EAE and 4 KO EAE mice. Statistical differences determined using one-way ANOVAs with Holm-Šidák multiple comparison tests, n.s. = not significant.
Table 1.
Absolute numbers for retinal ganglion cell counts (x103), Related to Figure 2
| Group | Total | Mean | SD (±) | SEM (±) | |||||
|---|---|---|---|---|---|---|---|---|---|
| Naive | 3.01 | 3.08 | 3.07 | 3.18 | 2.59 | 2.77 | 2.96 | 0.23 | 0.09 |
| WT EAE | 2.57 | 2.68 | 2.46 | 2.78 | 3.07 | – | 2.72 | 0.23 | 0.10 |
| KO EAE | 2.65 | 2.93 | 2.70 | 2.72 | – | – | 2.75 | 0.12 | 0.06 |
| Group | 1/6 segment | Mean | SD (±) | SEM (±) | |||||
| Naive | 3.68 | 2.67 | 4.10 | 4.57 | 3.20 | 3.53 | 3.63 | 0.67 | 0.27 |
| WT EAE | 2.95 | 3.14 | 2.81 | 3.38 | 4.01 | – | 3.26 | 0.47 | 0.21 |
| KO EAE | 3.11 | 2.74 | 2.98 | 2.95 | – | – | 2.95 | 0.15 | 0.08 |
| Group | 3/6 segment | Mean | SD (±) | SEM (±) | |||||
| Naive | 3.11 | 3.41 | 3.15 | 2.91 | 2.78 | 2.97 | 3.06 | 0.22 | 0.09 |
| WT EAE | 2.78 | 2.60 | 2.88 | 2.98 | 3.20 | – | 2.89 | 0.22 | 0.10 |
| KO EAE | 2.89 | 3.60 | 3.01 | 2.89 | – | – | 3.10 | 0.34 | 0.17 |
| Group | 5/6 segment | Mean | SD (±) | SEM (±) | |||||
| Naive | 2.26 | 3.18 | 1.97 | 2.09 | 1.79 | 1.83 | 2.19 | 0.52 | 0.21 |
| WT EAE | 2.00 | 2.30 | 1.71 | 2.00 | 2.02 | – | 2.01 | 0.21 | 0.09 |
| KO EAE | 1.95 | 2.46 | 2.14 | 2.34 | – | – | 2.22 | 0.23 | 0.11 |
Selective reduction of AMPAR signaling in mature OLs attenuates synaptic loss in EAE at peak of disease
The dLGN receives pre-synaptic input from optic nerve axons, providing a uniquely tractable system to determine if protection of optic nerve axons via inducible deletion of GluA4 in mature OLs abrogates synaptic loss in EAE. VGluT2+ retinogeniculate synapses were therefore quantified by confocal imaging in 60× z-plane fields of the dLGN from WT EAE and KO EAE mice relative to naive mice. The VGluT2+ area in the dLGN was substantially decreased in WT EAE compared to naive mice (Figures 3A–3D). Importantly, VGluT2+ area in the dLGN was significantly increased in KO EAE compared to WT EAE mice (Figures 3A–3D). To further explore if synaptic changes were consistent across the entire dLGN, serial tissue sections using 20× confocal imaging were performed on a subset of mice shown in Figure 3 (Figures S5A–S5F). Similar to findings at high magnification (Figure 3), there was a statistically significant reduction in VGLUT2+ presynaptic terminals in WT EAE compared to naive mice. Moreover, KO EAE had a significantly higher proportion of VGluT2+ area in the dLGN compared to WT EAE, which was not significantly different from naive mice (Figures S5A–S5F). These findings support that synaptic preservation occurred in mice with reduced OL-specific AMPAR signaling.
Figure 3.

Preservation of retinogeniculate presynaptic terminals and reduced complement deposition in AMPAR-deficient mice at peak EAE
(A–C) Representative images from compressed z stacks (3 planes spaced 0.7 μm apart) of VGluT2+ presynaptic terminals (A, magenta), complement factor C3 (B, green), and their colocalization (C, Merge) in naive, PLPcreER−:GluA4fl/fl (WT) EAE, and PLPcreER+:GluA4fl/fl (KO) mice at peak of disease. Scale bars, 10 μm.
(D) Quantification of VGluT2+ percent area (naive vs. WT EAE, ∗∗∗p = 0.0003; naive vs. KO EAE, ∗p = 0.0303; WT EAE vs. KO EAE, ∗∗p = 0.0061).
(E) Quantification of C3+ percent area (naive vs. WT EAE, ∗p = 0.0106; naive vs. KO EAE, p = 0.1512; WT EAE vs. KO EAE, ∗p = 0.0444).
(F) Quantification of VGluT2+/C3+ percent colocalization (naive vs. WT EAE, ∗p = 0.0154; naive vs. KO EAE, p = 0.5025; WT EAE vs. KO EAE, ∗p = 0.0148). Insets from WT EAE (white boxes) show a region where VGluT2+ (Gi) and C3+ (Gii) puncta are colocalized (white, Giii). Scale bars, 5 μm. Data expressed as mean ± SEM, n = 3 naive, 11 WT EAE, and 8 KO EAE mice from two independent experiments, 5–6 randomly selected fields from 3 tissue sections per mouse. Statistical differences determined using one-way ANOVAs with Holm-Šidák multiple comparison tests, n.s. = not significant.
Excitatory synaptic pruning is regulated by complement in development and disease2,35,36 and synaptic loss in the dLGN is associated with complement factor C3 deposition in EAE.2 To assess this known contributor to synaptic loss in EAE, C3 deposition was quantified in the dLGN. WT EAE mice had significantly more C3 deposition than naive mice (Figures 3B and 3E) consistent with increased synaptic loss in WT EAE mice (Figure 3D). C3 deposition in KO EAE mice was significantly lower than WT EAE mice and not significantly different from naive mice (Figures 3B and 3E), providing further support that reducing OL-specific AMPAR signaling during EAE attenuates synaptic loss. Colocalization of C3 with VGluT2+ synapses was significantly increased in WT EAE compared KO EAE as well as naive mice (Figures 3C and 3F, shown in Gi–Giii), whereas KO EAE was not significantly different from naive mice. Taken together, these data suggest that by reducing demyelination of axons, synaptic terminals are not only preserved but are also less frequently tagged for phagocytosis by complement factor C3.
Selective reduction of AMPAR signaling in mature OLs attenuates microglial engulfment of synapses
Following our analysis of presynaptic terminals and C3 deposition, we assessed whether microglial engulfment of these synapses was altered in the dLGN. Aberrant microglial engulfment of pre-synaptic terminals plays an important role in synaptic loss in EAE.2 Therefore, phagocytosis was assessed using 3D confocal reconstruction of VGluT2+ pre-synaptic terminals (pink) inside of CD68+ lysosomes (green) within Iba1+ myeloid cells (blue, Figures 4A–4C). Representative images demonstrate VGluT2+ synapses within CD68+ lysosomes of Iba1+ microglia (Figures 4D–4F) with transparent Iba1 staining to more clearly observe VGluT2+ synapses inside lysosomes (arrows, Figures 4G–4I). This colocalization can also be appreciated in a single confocal z-plane (Figure S3E). Increased microglial engulfment of VGluT2+ synaptic terminals was found in the dLGN of WT EAE compared to naive mice (Figure 4J). Furthermore, there was a statistically significant reduction in microglial engulfment of VGluT2+ synaptic terminals in KO EAE compared to WT EAE mice (Figure 4J). This reduction in microglial engulfment of synapses in KO EAE mice corresponded with increased total VGluT2+ area and reduced C3 deposition, a known trigger for microglial phagocytosis (Figure 3). No difference in Iba1+ (Figure 4K) or CD68+ (Figure 4M) volume was found between WT and KO EAE mice, however, both were increased compared to naive mice. To further evaluate if there were changes in reactive microgliosis, the percent area of Iba1+ immunostaining was evaluated across the entire dLGN and was not statistically different between WT and KO EAE mice (Figures S3G–S3J).
Figure 4.

Inducible reduction of AMPAR signaling in mature OLs attenuates engulfment of VGluT2+ presynaptic inputs in the dLGN
(A–C) Representative 3D confocal immunofluorescence images of Iba1+ microglia (cyan) containing CD68+ lysosomes (green) with engulfed VGluT2+ presynaptic protein (pink) in naive (A), PLPcreER−:GluA4fl/fl (WT) EAE (B), and PLPcreER+:GluA4fl/fl (KO) EAE (C) mice.
(D and F) Insets are representative of the 3D-rendered image of VGluT2+ inputs within CD68+ lysosomes, which is within Iba1+ microglia (larger image) in naive (D), WT EAE (E), and KO EAE (F) mice.
(G–I) Representative images of 3D surface rendering and masking to visualize VGluT2+ inputs engulfed by microglia (black arrows, G-I) of naive (G), WT EAE (H), and KO EAE (I) mice. Scale bars, 5 μm.
(J) Quantification of mean engulfed volume of VGluT2+ presynaptic inputs within CD68+ lysosomes per microglia. Naive vs. WT EAE, ∗∗∗p = 0.0005; naive vs. KO EAE, ∗p = 0.0482; WT EAE vs. KO EAE, ∗p = 0.0482.
(K) Quantification of Iba1+ volume. Naive vs. WT EAE, ∗∗p = 0.0080; naive vs. KO EAE, ∗p = 0.0198; WT EAE vs. KO EAE, p = 0.6505.
(L) Quantification of CD68+ volume. Naive vs. WT EAE, ∗p = 0.0127; naive vs. KO EAE, ∗∗p = 0.0034; WT EAE vs. KO EAE, p = 0.2877. Engulfed VGluT2, Iba1, and CD68 volumes were quantified from 15 to 20 Iba1+ microglia in the dLGN from 2 sections per mouse, n = 6 naive, 5 WT EAE, and 4 KO EAE mice. Data expressed as mean ± SEM. Statistical differences determined using a one-way ANOVAs with Holm-Šidák multiple comparison tests, n.s. = not significant.
To determine if protection of synapses in the dLGN was accompanied by changes in T cell infiltration, immunostaining for CD3+ T cells was performed. Very few T cells infiltrated the dLGN during EAE, and the number of infiltrating T cells was not significantly different between WT and KO EAE mice or when compared to naive mice (Figure S2). Neurons in the dLGN receive pre-synaptic input from the optic nerve, and therefore NeuN+ neurons were quantified between all groups. The number of NeuN+ cells were unaffected between all groups (WT EAE, KO EAE, and naive, Figures 5A and 5B). The axons that emerge as the corticogeniculate pathway (optic radiation, Figure S5B) are located in the dorsal part of the dLGN,37,38,39 which is where samples for EM were extracted. There was no difference in myelinated axons between WT EAE or KO EAE compared to naive mice (Figures 5C and 5D). Taken together, these data support that inducible deletion of GluA4 from mature OLs in optic nerves results in protection of downstream synapses in the dLGN.
Figure 5.

Reduction in AMPAR signaling on mature OLs does not change neuron or axon numbers in the dLGN, but improves visual acuity at EAE peak of disease
(A) Confocal images of NeuN+ and bisbenzimide+ (Bis) cells in the dLGN from naive, PLPcreER−; GluA4fl/fl (WT) EAE, and PLPcreER+; GluA4fl/fl (KO) EAE mice. Scale bars, 20 μm.
(B) EM images of coronal sections of the dLGN (bregma ˗1.455 mm to ˗2.355 mm) from naive, WT EAE and KO EAE mice. Scale bars, 1 μm.
(C) Quantification of NeuN+ neurons in the dLGN. Naive vs. WT EAE, p = 0.9840; naive vs. KO EAE, p = 0.9840; WT EAE vs. KO EAE, p = 0.9873, from n = 6 naive, 5 WT EAE and 4 KO EAE mice, 2–4 images from 2 sections per mouse.
(D) Quantification of myelinated axons in the dLGN. Naive vs. WT EAE, p = 0.9621; naive vs. KO EAE, p = 0.9621; WT EAE vs. KO EAE, p = 0.9621, from n = 6 naive, 6 WT EAE, and 4 KO EAE mice, 4 fields per mouse. Statistical differences in (C) and (D) determined by one-way ANOVAs with Holm-Šidák multiple comparison test.
(E) Visual acuity (cycles per degree, c/d) quantified per eye at baseline and peak of disease (so each mouse was measured at its own peak EAE) in WT and KO EAE mice. Independent measures multiple comparisons: WT vs. KO baseline, p = 0.9386; WT vs. KO peak EAE, ∗p = 0.0135. Repeated measures multiple comparisons: WT baseline vs. WT peak EAE, ∗∗∗p = 0.0001; KO baseline vs. KO peak EAE, p = 0.1927.
(F and G) (F) Visual acuity (cycles per degree, c/d) plotted as an average per animal across baseline and peak disease, quantified in (G), independent measures multiple comparisons: WT vs. KO baseline, p = 0.9485; WT vs. KO peak EAE, ∗p = 0.0403. Repeated measures multiple comparisons: WT baseline vs. WT peak EAE, ∗∗p = 0.0039; KO baseline vs. KO peak EAE, p = 0.2774. Data expressed as mean ± SEM. Statistical differences determined by two-way repeated measures ANOVAs with Holm-Šidák multiple comparisons test, n.s. = not significant, from n = 7 WT EAE and n = 5 KO EAE mice.
Selective reduction of AMPAR signaling in mature OLs improves visual acuity in EAE
To assess whether neuroprotection in the anterior visual pathway observed in KO EAE mice translated to functional improvements, visual acuity was assessed using optokinetic tracking (OKT). Visual acuity was assessed at baseline (after tamoxifen administration but before EAE induction) and as each animal reached peak clinical symptoms. As OKT can provide data for each eye independently, visual acuity was first assessed per eye for each animal (Figure 5E). Repeated measures two-way ANOVA results indicate that the time point of disease (baseline vs. peak) was the strongest source of variation in visual acuity (∗∗∗p = 0.0004), while genotype was a relatively weaker source of variation (p = 0.0698), yet the interaction of time and genotype was also a statistically significant source of variation (∗p = 0.0456). Since the visual system is known to be robustly affected at peak of EAE, pairwise comparisons were assessed to more carefully ascertain the effect of genotype on visual acuity outcomes. No difference in visual acuity was observed in KO and WT mice at baseline, but visual acuity was significantly reduced in WT EAE mice at peak of disease compared to baseline (Figure 5E). Importantly, visual acuity was significantly higher in KO EAE mice at peak of disease compared to WT EAE mice (Figure 5E). There was no significant change in visual acuity in KO mice between their baseline and peak disease measurements (Figure 5E). As visual acuity changes were found to be similar between eyes at peak of disease (data not shown), these values were also averaged per animal across each time point (Figure 5F). Repeated measures two-way ANOVA results again showed that disease time point is the most significant source of variation in visual acuity (∗∗p = 0.0051) rather than genotype (p = 0.1103) or the interaction between the two (p = 0.1003) (Figure 5G, analysis of data from 5F). Pairwise comparisons were also consistent with results per eye, showing that visual acuity in WT mice was significantly reduced at peak EAE from baseline, however, visual acuity in KO mice was not statistically different at baseline compared to peak EAE (Figure 5G). Thus, visual acuity in KO EAE mice was significantly improved compared to WT EAE mice (Figure 5G). These data support that preservation of axons and synaptic terminals in the visual system by inducible deletion of GluA4 from mature OLs results in functional improvements in vision at EAE peak of disease.
Discussion
These data support that specifically blocking AMPAR-mediated myelin damage has a dual benefit in preserving myelinated axons as well as impeding synaptic loss. Furthermore, these data provide evidence that axonal damage secondary to immune-mediated demyelination serves as an important driver of synaptic alterations in demyelinating disease. Axonal injury occurs in active lesions in relapsing-remitting MS,5 suggesting there may be a limited window for remyelinating therapies since a damaged axon cannot fully recover structurally or functionally even in the presence of newly formed myelin.40 Additionally, impaired mitochondrial function and trafficking in axons is a consequence of demyelination,16,17,20 which has important implications for the high metabolic demand of synapses associated with axon terminals.41 These data support the idea that attenuating demyelination, as opposed to restoring myelin that has already been lost, will effectively preserve the integrity of the axon as well as their associated synapse. The implications for these findings are best supported by clinical studies demonstrating that cognitive impairment occurs early in MS and significantly correlates with white matter lesions.42 Additionally, in human postmortem analysis of MS brains, demyelination was associated with significant loss of synaptic density and nominal loss of neuronal cell bodies,1 linking myelin health with synaptic integrity.
Targeting complement components attenuated microglia-mediated synaptic loss in EAE, suggesting that mechanisms independent of axonal damage may contribute to circuit dysfunction.2,43 Using a model of cortical inflammation that caused demyelination without significant axonal injury, altered synaptic function was recovered when inflammation resolved and aberrant synaptic pruning by microglia was attenuated by blocking colony-stimulating factor 1 receptor.44 Likewise, excitatory postsynaptic potentials and long-term potentiation were significantly altered in the hippocampus during cuprizone-induced demyelination independent of synaptic loss that was restored during remyelination.45
Taken together these data suggest there may be some aspects of aberrant synaptic function that are reversible, which may be dependent on the variability of different types of neurons or their response to injury. In this regard, LPC-induced demyelinating lesions with significant axonal injury in the motor cortex caused loss of inhibitory synapses, consistent with findings in the motor cortex of secondary progressive MS postmortem brains.46 Here, we found reduced engulfment of dLGN presynaptic terminals by microglia in KO versus WT EAE mice. This was accompanied by an increase in VGluT2+ synapses and a decrease in complement C3+ immunostaining in the dLGN of KO compared to WT EAE mice. These data suggest that axonal injury secondary to demyelination contributes to complement-mediated synaptic elimination. A recent publication demonstrated that axonal injury activates neuronal kinase dual leucine zipper kinase (DLK) to drive complement deposition on synapses and subsequent engulfment by microglia.47 While gray matter lesions are documented in postmortem MS brains, these data support that axonal injury in white matter lesions is an important driver of synaptic loss that can be abrogated by preserving myelin. Using an in vivo model where synapses and their associated myelinated axons can be discretely monitored, we demonstrated that targeting AMPAR-mediated signaling on myelin improves both axonal and synaptic alterations with important therapeutic implications for neurodegeneration in MS.
Limitations of the study
Our study focused on the impact of modulating demyelination on axonal and synaptic pathology in a commonly used preclinical model of demyelinating disease. While our data support that early protection of myelin is an important factor in promoting axonal and synaptic integrity despite ongoing inflammation, we acknowledge that people with MS may have an undefined period of subclinical demyelinating activity before diagnosis. Future research to evaluate the efficacy of reducing AMPAR signaling on mature oligodendrocytes after EAE onset will determine the impact of protecting and/or restoring existing myelin on axonal and synaptic alterations. Additionally, we appreciate that Iba1, which was used to identify microglia in the dLGN for engulfment and local inflammation analyses, will also label infiltrating myeloid cells. The morphology of cells assessed and the relative paucity of infiltrating cells into the dLGN during EAE support an important role for resident immune cells, however, this will be more specifically evaluated in future research.
Resource availability
Lead contact
Further information and requests for resources and reagents should be directed to and will be fulfilled by the lead contact, Tara DeSilva (desilvt@ccf.org).
Materials availability
This study did not generate new unique reagents.
Data and code availability
-
•
All data reported in this paper will be shared by the lead contact upon request.
-
•
This study did not generate new code.
-
•
Any additional information required to reanalyze the data reported in this paper is available from the lead contact upon request.
Acknowledgments
Sponsored funding was received by the National Science Foundation 1648822, the National Eye Institute R01EY025687, R01EY032342, P30EY025585, T32 EY024236, the National Multiple Sclerosis Society FG-1807-31882, FG-2108-38411, and the Department of Defense HT94252410526. BioRender was used to generate Figure 1A and the graphical abstract.
Author contributions
K.S.E. and G.M.M. performed all EAE experiments, collected and analyzed IHC, IF, and EM data, and wrote the manuscript draft. K.S.E. and M.I. analyzed microglial engulfment data. J.S. performed immunofluorescent staining and analysis of VGluT2 and C3 with guidance from D.P.S. L.M.W. and S.E.L. analyzed CD3 and EM data. T.M.D. conceptualized the research, oversaw all research, and wrote, revised, and edited the final manuscript. K.S.E., G.M.M., and D.P.S. contributed to the final editing of the manuscript. All authors read and approved the final manuscript.
Declaration of interests
T.M.D. serves on the board of directors for Coeptis Therapeutics.
STAR★Methods
Key resources table
| REAGENT or RESOURCE | SOURCE | IDENTIFIER |
|---|---|---|
| Antibodies | ||
| rabbit anti-Iba-1 (1:500) | Wako | Cat# 019–19741, RRID: AB_839504 |
| goat anti-Iba1 (1:200) | Novus Biologicals | Cat# NB100-1028, RRID: AB_521594 |
| mouse anti-GFAP (1:1000) | BioLegend | Cat# 835301, RRID: AB_2565344 |
| mouse anti-CD68 (1:200) | Biorad | Cat# MCA1957GA, RRID: AB_324217 |
| mouse anti-NeuN (1:500) | Millipore Sigma | Cat# MAB377, RRID: AB_2298772 |
| rabbit anti-VGluT2 (1:200) | Abcam | Cat# ab216463, RRID: AB_2893024 |
| rat anti-C3 (1:500) | Abcam | Cat# ab11862 RRID: AB_2066623 |
| rat anti-CD3 (1:500) | Thermo Fisher Scientific | Cat# 16-0032-85, RRID: AB_468852 |
| rat anti-MBP (1:500) | Abcam | Cat# ab7349, RRID: AB_305869 |
| goat anti-Brn3a (1:100) | Santa Cruz | Cat# SC-8429, RRID: AB_626765 |
| Alexa Fluor 488 goat anti-rabbit IgG (1:1000) | Invitrogen | Cat# A11034, RRID: AB_2576217 |
| Alexa Fluor 647 goat anti-rabbit IgG (1:1000) | Invitrogen | Cat# A21245, RRID: AB_2535813 |
| Alexa Fluor 647 goat anti-mouse IgG (1:1000) | Invitrogen | Cat# A21235, RRID: AB_2535804 |
| Alexa Fluor 488 goat anti-mouse IgG (1:1000) | Invitrogen | Cat# A28175, RRID: AB_2536161 |
| Alexa Flour 647 goat anti-rat (1:1000) | Invitrogen | Cat# A21247, RRID: AB_141778 |
| Biotinylated goat anti-rat IgG (1:200) | Vector Labs | Cat# BA-9400, RRID: AB_2336202 |
| Biotinylated horse anti-mouse IgG (1:200) | Vector Labs | Cat# BA-2000, RRID: AB_2313581 |
| Biotinylated horse anti-goat IgG (1:200) | Vector Labs | Cat# BA-9500, RRID: AB_2336123 |
| Chemicals, Peptides, and Recombinant Proteins | ||
| DyLight 405 conjugated streptavidin (1:500) | Thermo Fisher Scientific | Cat# 21831 |
| Alexa Fluor 647 conjugated streptavidin (1:1000) | Invitrogen | Cat# S21374 |
| Brilliant Violet 421 conjugated streptavidin (1:1000) | BioLegend | Cat# 405226 |
| Tamoxifen | Sigma-Aldrich | Cat# T5648 |
| Fluoromount-G | Southern Biotech | Cat# 0100-01 |
| Bisbenzimide (1:1000) | Invitrogen | Cat# H3569, RRID: AB_2651133 |
| Myelin Oligodendrocyte Glycoprotein (MOG)35-55/Complete Freund’s Adjuvant emulsion | Hooke Labs | Cat# EK-2110 |
| Pertussis toxin (in glycerol) | Hooke Labs | Cat# EK-2110 (kit), BT-0105 (separate) |
| Experimental Models: Organisms/Strains | ||
| B6.Cg-Tg(Plp1-cre/ERT)3Pop/J | Jackson Laboratory | Cat# Jax 005975, RRID:IMSR_JAX:005975 |
| Gria4tm1Mony (maintained on C57BL/6J background) | Hannah Monyer | MGI:3798453 |
| Software and Algorithms | ||
| Imaris | Bitplane | |
| FIJI | ImageJ | |
| NIS-Elements | Nikon | |
| Prism | GraphPad | |
| OptoMotry | CerebralMechanics | |
Experimental model and study participant details
Animals
B6.Cg-Tg(Plp1-cre/ERT)3Pop/J mice purchased from The Jackson Laboratory (005975; referred to as PlpcreER) were crossed with Gria4tm1Mony mice48 on a C57BL/6J background provided by H. Monyer at Heidelberg University (referred to as GluA4). PlpcreER+:Gria4fl/fl (KO) and PlpcreER-:Gria4fl/fl (WT) littermate control mice 8–11 weeks old were induced with EAE. All tamoxifen-injected male WT and KO mice were used for EAE experiments. All naive KO and WT mice were tamoxifen-injected and consisted of both female and male mice. Mice were housed in individually ventilated cages under a standard 12 h light/dark cycle with 18% protein standard chow and sterilized water provided ad libitum. Each cage contained 2–5 mice. Cages contained pulped cotton fiber nestlets for enrichment. Mice were weaned at 3 weeks of age. These conditions are in accordance with National Institutes of Health (NIH) and the Institutional Animal Care and Use Committee guidelines of the Cleveland Clinic.
Method details
Tamoxifen induction
PlpcreER mice and littermate controls received intraperitoneal injections of 20 mg/mL tamoxifen (T5648, Sigma-Aldrich, St. Louis, MO) in 100 μL of peanut oil every day for 5 days. After 2 to 3 weeks mice were used as naive controls or induced with EAE for WT and KO experiments.
EAE induction and scoring
EAE was induced in 8- to 11-week-old male mice by subcutaneous injection of 50 μg MOG35-55 peptide emulsified in complete Freund’s adjuvant containing 125 μg desiccated Mycobacterium tuberculosis (Hooke Laboratories, Lawrence, MA). On days 0 and 2 of EAE, mice were injected intraperitoneally with 200 ng Bordetella pertussis toxin (Hooke Laboratories, Lawrence, MA) in 500 μL phosphate-buffered saline (PBS). Mice were scored daily for symptoms of EAE and assigned clinical scores as follows: 0, no symptoms; 1, loss of tail tone; 2, flaccid tail; 3, partial hindlimb paralysis; 4, complete hindlimb paralysis; 5, moribund state (humanely euthanized); and 6, death. Mice were assessed at EAE peak of disease 16 to 18 days post-EAE induction (dpi). Mice used for OKT analysis were assessed at their individual peaks in clinical EAE scores (12–19 dpi).
Perfusion and preparation of mouse brains, optic nerves, and retinas for cryosectioning and immunofluorescence staining
Brains, optic nerves, and eyes were removed following transcardiac perfusion with 4% paraformaldehyde (PFA) in phosphate buffered saline (PBS). One eye per mouse was post-fixed in PFA for 2 h after a hole was made with a needle in the cornea to allow for penetration. Whole retinas were removed and cryopreserved or isolated fixed whole retinas were stained free-floating (see below). For cryo-sectioning, brains, optic nerves, and whole retinas were fixed overnight in 4% PFA and cryoprotected in 30% sucrose. These specimens were embedded in Optimal Cutting Temperature freezing medium (Fisher HealthCare, Waltham, MA) and snap-frozen in 2-methylbutane on dry ice. All frozen tissues were cut into 16 μm-thick sections on a cryostat (Leica Biosystems, Buffalo Grove, IL) for immunohistochemistry.
Preparation of mouse brains and optic nerves for electron microscopy
Mice were perfused with 4% PFA and 2% glutaraldehyde in 0.1 M sodium cacodylate buffer at pH 7.4. Whole optic nerves and dorsal lateral geniculate nucleus (LGN), isolated from 100 μm-thick coronal brain sections (diagram of region in Figures S5A and S5B, bregma −1.455 mm to −2.355 mm), were processed by the Cleveland Clinic Imaging Core for transmission electron microscopy. Tissue was post-fixed in 1% osmium tetroxide in water, stained with 1% uranyl acetate in maleate buffer (pH 5.1), and dehydrated with ethanol and propylene oxide before being embedded in Pure Eponate 12 resin (Ted Pella Inc., Redding, CA). Ultrathin 85-nm sections were cut with a diamond knife, stained with uranyl acetate and lead citrate, and observed with a transmission electron microscope (TEM, FEI Company, Hillsboro, OR).
Immunohistochemistry with 3,3′-Diaminobenzidine (DAB)
Immunohistochemistry using DAB was performed to detect myelin basic protein (MBP) in optic nerves. Antigen retrieval was performed using 10 mM citrate buffer (pH 3.0) at 37°C for 30 min. Sections were blocked with 5% goat serum and 0.3% Triton X-100 in PBS for 1 h at room temperature (RT). Rat anti-MBP (1:500; Ab7349, Abcam, Cambridge, UK) primary antibody was diluted in blocking buffer, added to sections, and incubated overnight at 4°C. A goat anti-rat biotinylated secondary antibody (1:200, BA-9400, Vector Laboratories, Burlingame, CA) was diluted in blocking buffer and added to sections for 1 h at RT. Endogenous peroxidase activity was blocked by incubating slides in 0.3% hydrogen peroxide in methanol for 10 min at RT. Antibodies were visualized using the avidin-biotin-immunoperoxidase complex (ABC) method with the VECTASTAIN ABC Kit (PK-4000, Vector Laboratories, Burlingame, CA) and DAB Peroxidase (horseradish peroxidase) Substrate Kit (SK-4100, Vector Laboratories, Burlingame, CA). Slides were dehydrated and mounted in Permount (SP15, Thermo Fisher Scientific, Waltham, MA).
Immunofluorescence
Antigen retrieval was performed for anti-NeuN immunofluorescence using 10 mM citrate buffer (pH 3.0) at 37°C for 30 min. For all stains, sections were blocked with 5% serum corresponding to the host of the secondary antibody and 0.3% Triton X-100 in PBS for 1 h at RT. Primary antibodies were diluted in blocking buffer and incubated on sections overnight at 4°C. For anti-NeuN and anti-Iba1 (for microglial engulfment) immunofluorescence, biotinylated secondary antibodies were diluted in blocking buffer and incubated on slides for 1 h at RT. Following incubation with biotinylated secondary antibodies, slides were incubated in fluorescent-conjugated streptavidin diluted in PBS wash buffer for 30 min. For all other immunofluorescent staining, Alexa Fluor-conjugated secondary antibodies were diluted in blocking buffer and incubated on sections for 1 h at RT. Slides were mounted with Fluoromount-G (0100-01, SouthernBiotech, Birmingham, AL) containing bisbenzimide (1:1000; H3569, Invitrogen, Carlsbad, CA).
Primary antibodies included rat anti-CD3 (1:500; 16-0032-85, Thermo Fisher Scientific, Waltham, MA), mouse anti-GFAP (1:1000; 835301, Biolegend, San Diego, CA), rabbit anti-Iba1 (1:500; 019–19741, Wako, Richmond, VA), goat anti-Iba1 (1:200; NB100-1028, Novus Biologicals, Littleton, CO), mouse anti-NeuN (1:500; MAB377, Millipore, Billerica, MA), rabbit anti-VGluT2 (1:200; ab216463, Abcam, Cambridge, UK), mouse anti-CD68 (1:200; Biorad, MCA1957GA), and rat monoclonal anti-C3 (1:500; ab11862, Abcam, Cambridge, UK). Biotinylated secondary antibodies were used at 1:200 dilution and included horse anti-mouse IgG (BA-2000, Vector laboratories, Burlingame, CA) and horse anti-goat IgG (BA-9500, Vector Laboratories, Burlingame, CA). Alexa Fluor 647-conjugated streptavidin was used at 1:1000 dilution (lyophilized stock diluted in 1 mg/mL PBS, S21374, Invitrogen, Carlsbad, CA) for anti-NeuN staining, and Brilliant Violet 421-conjugated (1:1000; 405226, Biolegend, San Diego, CA) or DyLight 405-conjugated streptavidin (1:500; 21831, Thermo Fisher Scientific, Waltham, MS) was used for anti-Iba1 staining (for microglial engulfment). All other Alexa Fluor-conjugated secondary antibodies were used at 1:1000, anti-mouse 647, anti-rat 647, anti-rabbit 647, anti-rabbit 488, or anti-mouse 488 (all purchased from Invitrogen, Carlsbad, CA).
Staining and preparation of whole retinal flatmounts
Isolated fixed whole retinas were stained free-floating and permeabilized for 30 min in 0.5% Triton X-100 in PBS at RT. Retinas were then blocked in 10% goat serum, 1% bovine serum albumin, and 0.5% Triton X-100 in PBS for 1 h at RT. Subsequently, retinas were incubated in goat anti-mouse F(ab) fragment (1:2000; Abcam ab6668) for 1 h at RT. Mouse monoclonal anti-Brn3a (1:100 Santa Cruz, SC-8429) was diluted in blocking buffer and incubated on retinas overnight at 4°C. Fluorescent-conjugated goat anti-mouse (1:500; Alexa Fluor 647, A21235, Invitrogen, Carlsbad, CA) was diluted in blocking buffer and incubated on retinas for 2 h at RT. Bisbenzimide (1:100; Invitrogen H3569, Carlsbad, CA) was diluted in wash buffer and added to retinas for 20 min at RT. Four incisions were made in each retina cup to allow them to lie flat on a slide, and retinas were mounted with Fluoromount-G (0100-01, SouthernBiotech, Birmingham, AL).
Imaging
Images for DAB immunohistochemistry of MBP in the optic nerve were acquired using a Leica SCN400 slide scanner at 40× magnification. Fluorescent images were acquired using a Nikon C2 confocal microscope system (Nikon, Melville, NY) with NIS-Elements software (Nikon, Melville, NY) with 1) 60× objective (Apo 60× oil λS DIC N2, NA 1.4) for microglial engulfment of synapses and quantification of VGluT2 and C3 in the dLGN, 2) 40× objective (Plan Flour 40× oil DIC N2, NA 1.3) for sectioned optic nerve and sectioned or flatmounted retina, and 3) 20× objective (Plan Apo λ 20x, NA 0.75) for overall VGluT2 and Iba1 staining in the dLGN. For electron microscopy, grids were examined on a Tecnai G2 SpiritBT transmission electron microscope (FEI Company, Hillsboro, OR) operated at 60 kV. NIS-Elements software (Nikon, Melville, NY), ImageJ (NIH, version 1.53t), Canvas, and Adobe Photoshop were used to create figures and process images (contrast, brightness, and color adjustments were evenly applied across representative images).
Quantification and statistical analysis
Quantification of T cell infiltration
CD3+ T cells were quantified by a researcher blinded to group identity using the free NIH ImageJ software (version 1.52p) or NIS-Elements software (Nikon, Melville, NY). T cells were identified by CD3+ staining around bisbenzimide-stained nuclei in every tenth 16 μm-thick serial tissue section in optic nerves (2 nerves, 2 sections per nerve, 4 fields per section) and retina (2 sections per animal, 4 fields per section), and in two adjacent 16 μm-thick tissue sections in the dLGN (2 sections per animal, left and right dLGN). Average number of T cells were calculated and used for analysis.
Quantification of reactive gliosis in the optic nerves and retina
Percent area staining of GFAP and Iba1 was quantified by a researcher blinded to group identity using NIS-Elements software (Nikon, Melville, NY) in every tenth 16 μm-thick serial tissue section in optic nerves (2 nerves per animal, 2 sections per nerve, 4 fields per section) and retina (2 sections per animal, 4 fields per section), and in two adjacent 16 μm-thick tissue sections in the dLGN (2 sections per animal, left and right dLGN). Images were processed in NIS-Elements with an advanced noise removal algorithm applied evenly across all images. Thresholds were set to the same baseline and adjusted manually as necessary for each image to assess the percent area stained. In the optic nerves, percent area was quantified in longitudinal sections (excluding hyperfluorescent nerve sheath or areas without tissue). In the dLGN, percent area was quantified within dLGN boundaries as defined by enriched VGluT2+ staining and characteristic anatomy beneath the hippocampus (Figures S5A and S5B). For retinas, the RNFL/GCL was traced using bisbenzimide to define boundaries, and area fractions were measured in the RNFL/GCL alone and in the total retina (whole image). Average areas stained per animal were calculated and used for analysis.
Quantification of MBP
Optic nerve sections were imaged at 40× magnification and individual sections were traced for analysis (2 nerves per animal, 2 sections per nerve), excluding the nerve sheath. Percent area staining of MBP antibody was quantified by a researcher blinded to group identity using the NIH ImageJ free software (version 1.52p). Thresholds were manually set for each image to obtain the percent area stained with MBP. Assessments were made in every tenth 16-μm serial tissue section. The average percent MBP-negative area fraction (demyelinated area) was calculated to quantify the percent demyelination for each animal.
Quantification of VGluT2, C3, Iba1, and neuronal nuclei in the dLGN
The boundaries of the dLGN were identified using anatomical features and VGluT2+ staining as a marker, which is enriched within the dLGN (Figure 1, Figure 2, Figure 3, Figure 4, Figure 5). VGluT2+ and C3+ percent area quantifications were performed as previously described.2 Images at 60× magnification were acquired in 5–6 randomly selected fields from 3 tissue sections per mouse. Each field contained 3 single z-planes spaced 0.70 μm apart, which was quantified separately and then averaged for each animal. The percent area per plane was manually thresholded by a researcher blinded to group identity. Analyses were performed in ImageJ (NIH, version 1.53t). Using the analyze particles function, the total area of VGluT2+ presynaptic inputs and C3+ deposition were measured. Colocalization was determined as the percent area of C3 co-staining with VGluT2. Percent VGluT2+ and Iba1+ areas were also quantified across the entire dLGN from 20x confocal images. Quantification was performed using NIS-Elements software (Nikon, Melville, NY) in 2 fields (one each from the left and right hemisphere) from 2 adjacent tissue sections. Neurons were counted in the entire dLGN using 20x confocal images for each tissue section (2–4 fields from 2 sections per mouse), drawing a region of interest to define the dLGN area according to the boundaries determined as stated above.
Analysis of microglial engulfment of VGluT2
Microglial engulfment of VGluT2 was performed as previously described.2,49 Of note, quantification of VGluT2 engulfment by microglia evaluates presynaptic inputs, which may include presynaptic axonal components. Two sections from each mouse brain containing dLGN were immunostained and imaged on a Nikon C2 Confocal Laser Point Scanning Microscope (Nikon, Melville, NY) with NIS-Elements software (Nikon, Melville, NY). For each hemisphere, 3–5 randomly chosen fields of view in the dLGN were acquired with 80–120 z stack steps at 0.125 μm optimal spacing using an Apo 60x/1.40 NA (oil immersion) objective. Images were then processed in NIS-Elements with an advanced noise removal algorithm applied evenly across all images. Individual images of 15–20 single cells per animal were processed in Imaris (Bitplane, Zurich, Switzerland) as previously described.2,49 Analysis was restricted to VGluT2+ staining within CD68+ lysosomes located inside Iba1+ microglia. Quantification of images was performed by a researcher blinded to group identity using manual thresholding.
Quantification of RGCs
RGCs were quantified by a researcher blinded to group identity using NIS-Elements software (Nikon, Melville, NY) in retinal flatmounts (1 retina per animal, 4 leaflets per retina, 3 images per leaflet). Images were processed in NIS-Elements with an advanced noise removal algorithm applied evenly across all images. RGCs were identified as Brn3a+ cells co-localized with bisbenzimide-stained nuclei and were counted by a researcher blinded to group identity in 12 fields per retina as previously described.50 Briefly, four incisions were made in the retina to form four leaflets. Three images per leaflet were taken to represent the area at 1/6, 3/6, and 5/6 of the retinal radius from the center of each quadrant (central-1/6 segment, medial-3/6 segment, and peripheral-5/6 segment positions). Total Brn3a+ cells per retina were used to calculate the number of RGCs per square millimeter.
Analysis of electron microscopy
Ultrathin 85-nm sections were imaged at x11000 in optic nerve cross sections. Ultrathin sections of the dLGN were imaged at x18500. Coronal sections of the dorsal region of the dLGN (bregma −1.455 mm to −2.355 mm) were used. Visualization of the hippocampus, optic tract fibers, and distinct dLGN shape were used to harvest similar regions in each animal (as shown in Figures S5A and S5B). Axons were counted by a researcher blinded to group identity in six images per animal for the optic nerve, and myelinated axons were counted by a researcher blinded to group identity in four images per animal for the dLGN using the free NIH ImageJ software (version 1.52p). Axons were identified by their round or oval contour and the presence of neurofilaments and microtubules in the axoplasm. Myelinated axons were identified by the dark myelin rings surrounding the (relatively light in color) axon. Average number of axons per square millimeter was calculated for each animal and used for analysis as we have previously described.26,51
Optokinetic tracking
Optokinetic tracking was performed as previously described52 on a single mouse at a time placed on a platform in the center of a square surrounded by four 17-inch computer monitors. Visual acuity was assessed at baseline (after tamoxifen administration but before EAE induction), and as each individual animal reached its peak in clinical symptoms, therefore, not all mice were measured at “peak” on the same day. Vertical sine-wave grating was projected on the monitors using OptoMotry software (http://www.cerebralmechanics.com/) running on an Apple Power Macintosh computer. A video camera situated above the mouse provided real-time feedback on a separate viewing monitor. The spatial frequency of the sine-wave grating was kept constant by manual tracking of the mouse’s head movements.
At the beginning of each session, a homogeneous gray stimulus was projected until the animal stopped moving. Next, a low-spatial-frequency (0.05 cycles/degree) sine-wave grating (with 100% contrast) was projected on the monitors moving horizontally in one direction. The animal was manually assessed for tracking behavior by an observer blinded to group identity to establish that it was able to track the sine-wave grating. Tracking behavior was defined as any movement of the mouse’s nose following the horizonal movement of the sine-wave grating on the monitors in the testing apparatus. For testing, the spatial frequency of the grating was systematically increased until the animal was manually judged by an observer blinded to group identity to no longer respond to the stimulus. For each eye, tracking occurs in the temporal-to-nasal direction, while it does not occur in the nasal-to-temporal direction.52 Thus, measurements for the right eye can be performed when the stimulus moves counterclockwise, and measurements for the left eye can be separately performed when the stimulus moves clockwise.52 We utilized this information to generate optokinetic tracking data from both eyes of each animal.
Statistical analysis
All statistical analyses were performed using GraphPad Prism software version 9.0.0. (GraphPad Software, La Jolla, CA). Data were assessed for normality of distribution of data points to determine parametric versus non-parametric tests using the Shapiro-Wilk test. All data were assessed with parametric tests with the exception of EAE clinical scores (Figure 1B), which were assessed using the Mann Whitney U test, one of the most commonly used statistical analyses to assess these non-parametric, ordinal data.53 The EAE clinical scores (Figure 1B) include 1 WT and 1 KO mouse that did not present with disease (i.e., had a clinical score of 0 across the time course) and 1 KO mouse that was euthanized due to complications unrelated to EAE. These mice were excluded from all other analyses represented in the data figures due to failure to present with EAE or failure to reach experimental endpoint. Specific analyses performed, including p values, are reported where indicated.
Published: October 22, 2024
Footnotes
Supplemental information can be found online at https://doi.org/10.1016/j.isci.2024.111226.
Supplemental Information
References
- 1.Dutta R., Chang A., Doud M.K., Kidd G.J., Ribaudo M.V., Young E.A., Fox R.J., Staugaitis S.M., Trapp B.D. Demyelination causes synaptic alterations in hippocampi from multiple sclerosis patients. Ann. Neurol. 2011;69:445–454. doi: 10.1002/ana.22337. [DOI] [PMC free article] [PubMed] [Google Scholar]
- 2.Werneburg S., Jung J., Kunjamma R.B., Ha S.K., Luciano N.J., Willis C.M., Gao G., Biscola N.P., Havton L.A., Crocker S.J., et al. Targeted Complement Inhibition at Synapses Prevents Microglial Synaptic Engulfment and Synapse Loss in Demyelinating Disease. Immunity. 2020;52:167–182.e7. doi: 10.1016/j.immuni.2019.12.004. [DOI] [PMC free article] [PubMed] [Google Scholar]
- 3.Ziehn M.O., Avedisian A.A., Tiwari-Woodruff S., Voskuhl R.R. Hippocampal CA1 atrophy and synaptic loss during experimental autoimmune encephalomyelitis, EAE. Lab. Invest. 2010;90:774–786. doi: 10.1038/labinvest.2010.6. [DOI] [PMC free article] [PubMed] [Google Scholar]
- 4.Mey G.M., Evonuk K.S., Chappell M.K., Wolfe L.M., Singh R., Batoki J.C., Yu M., Peachey N.S., Anand-Apte B., Bermel R., et al. Visual imaging as a predictor of neurodegeneration in experimental autoimmune demyelination and multiple sclerosis. Acta Neuropathol. Commun. 2022;10:87. doi: 10.1186/s40478-022-01391-y. [DOI] [PMC free article] [PubMed] [Google Scholar]
- 5.Trapp B.D., Peterson J., Ransohoff R.M., Rudick R., Mörk S., Bö L. Axonal transection in the lesions of multiple sclerosis. N. Engl. J. Med. 1998;338:278–285. doi: 10.1056/NEJM199801293380502. [DOI] [PubMed] [Google Scholar]
- 6.Thompson A.J., Banwell B.L., Barkhof F., Carroll W.M., Coetzee T., Comi G., Correale J., Fazekas F., Filippi M., Freedman M.S., et al. Diagnosis of multiple sclerosis: 2017 revisions of the McDonald criteria. Lancet Neurol. 2018;17:162–173. doi: 10.1016/S1474-4422(17)30470-2. [DOI] [PubMed] [Google Scholar]
- 7.Cala C.M., Moseley C.E., Steele C., Dowdy S.M., Cutter G.R., Ness J.M., DeSilva T.M. T cell cytokine signatures: Biomarkers in pediatric multiple sclerosis. J. Neuroimmunol. 2016;297:1–8. doi: 10.1016/j.jneuroim.2016.04.015. [DOI] [PMC free article] [PubMed] [Google Scholar]
- 8.Gurevich M., Achiron A. The switch between relapse and remission in multiple sclerosis: continuous inflammatory response balanced by Th1 suppression and neurotrophic factors. J. Neuroimmunol. 2012;252:83–88. doi: 10.1016/j.jneuroim.2012.07.014. [DOI] [PubMed] [Google Scholar]
- 9.Bourque J., Hawiger D. Current and Future Immunotherapies for Multiple Sclerosis. Mo. Med. 2021;118:334–339. [PMC free article] [PubMed] [Google Scholar]
- 10.Tur C., Carbonell-Mirabent P., Cobo-Calvo Á., Otero-Romero S., Arrambide G., Midaglia L., Castilló J., Vidal-Jordana Á., Rodríguez-Acevedo B., Zabalza A., et al. Association of Early Progression Independent of Relapse Activity With Long-term Disability After a First Demyelinating Event in Multiple Sclerosis. JAMA Neurol. 2023;80:151–160. doi: 10.1001/jamaneurol.2022.4655. [DOI] [PMC free article] [PubMed] [Google Scholar]
- 11.Fox R.J., Cohen J.A. Multiple sclerosis: the importance of early recognition and treatment. Cleve. Clin. J. Med. 2001;68:157–171. doi: 10.3949/ccjm.68.2.157. [DOI] [PubMed] [Google Scholar]
- 12.Eshaghi A., Prados F., Brownlee W.J., Altmann D.R., Tur C., Cardoso M.J., De Angelis F., van de Pavert S.H., Cawley N., De Stefano N., et al. Deep gray matter volume loss drives disability worsening in multiple sclerosis. Ann. Neurol. 2018;83:210–222. doi: 10.1002/ana.25145. [DOI] [PMC free article] [PubMed] [Google Scholar]
- 13.Mahajan K.R., Nakamura K., Cohen J.A., Trapp B.D., Ontaneda D. Intrinsic and Extrinsic Mechanisms of Thalamic Pathology in Multiple Sclerosis. Ann. Neurol. 2020;88:81–92. doi: 10.1002/ana.25743. [DOI] [PMC free article] [PubMed] [Google Scholar]
- 14.Pisa M., Pansieri J., Yee S., Ruiz J., Leite M.I., Palace J., Comi G., Esiri M.M., Leocani L., DeLuca G.C. Anterior optic pathway pathology in CNS demyelinating diseases. Brain. 2022;145:4308–4319. doi: 10.1093/brain/awac030. [DOI] [PMC free article] [PubMed] [Google Scholar]
- 15.Evangelou N., Konz D., Esiri M.M., Smith S., Palace J., Matthews P.M. Size-selective neuronal changes in the anterior optic pathways suggest a differential susceptibility to injury in multiple sclerosis. Brain. 2001;124:1813–1820. doi: 10.1093/brain/124.9.1813. [DOI] [PubMed] [Google Scholar]
- 16.Licht-Mayer S., Campbell G.R., Canizares M., Mehta A.R., Gane A.B., McGill K., Ghosh A., Fullerton A., Menezes N., Dean J., et al. Enhanced axonal response of mitochondria to demyelination offers neuroprotection: implications for multiple sclerosis. Acta Neuropathol. 2020;140:143–167. doi: 10.1007/s00401-020-02179-x. [DOI] [PMC free article] [PubMed] [Google Scholar]
- 17.Nikic I., Merkler D., Sorbara C., Brinkoetter M., Kreutzfeldt M., Bareyre F.M., Bruck W., Bishop D., Misgeld T., Kerschensteiner M. A reversible form of axon damage in experimental autoimmune encephalomyelitis and multiple sclerosis. Nat. Med. 2011;17:495–499. doi: 10.1038/nm.2324. [DOI] [PubMed] [Google Scholar]
- 18.Azevedo C.J., Kornak J., Chu P., Sampat M., Okuda D.T., Cree B.A., Nelson S.J., Hauser S.L., Pelletier D. In vivo evidence of glutamate toxicity in multiple sclerosis. Ann. Neurol. 2014;76:269–278. doi: 10.1002/ana.24202. [DOI] [PMC free article] [PubMed] [Google Scholar]
- 19.Srinivasan R., Sailasuta N., Hurd R., Nelson S., Pelletier D. Evidence of elevated glutamate in multiple sclerosis using magnetic resonance spectroscopy at 3 T. Brain. 2005;128:1016–1025. doi: 10.1093/brain/awh467. [DOI] [PubMed] [Google Scholar]
- 20.Klauser A.M., Wiebenga O.T., Eijlers A.J., Schoonheim M.M., Uitdehaag B.M., Barkhof F., Pouwels P.J., Geurts J.J. Metabolites predict lesion formation and severity in relapsing-remitting multiple sclerosis. Mult. Scler. 2018;24:491–500. doi: 10.1177/1352458517702534. [DOI] [PubMed] [Google Scholar]
- 21.Evonuk K.S., Baker B.J., Doyle R.E., Moseley C.E., Sestero C.M., Johnston B.P., De Sarno P., Tang A., Gembitsky I., Hewett S.J., et al. Inhibition of System Xc(-) Transporter Attenuates Autoimmune Inflammatory Demyelination. J. Immunol. 2015;195:450–463. doi: 10.4049/jimmunol.1401108. [DOI] [PMC free article] [PubMed] [Google Scholar]
- 22.Pitt D., Werner P., Raine C.S. Glutamate excitotoxicity in a model of multiple sclerosis. Nat. Med. 2000;6:67–70. doi: 10.1038/71555. [DOI] [PubMed] [Google Scholar]
- 23.Smith T., Groom A., Zhu B., Turski L. Autoimmune encephalomyelitis ameliorated by AMPA antagonists. Nat. Med. 2000;6:62–66. doi: 10.1038/71548. [DOI] [PubMed] [Google Scholar]
- 24.Zhai D., Yan S., Samsom J., Wang L., Su P., Jiang A., Zhang H., Jia Z., Wallach I., Heifets A., et al. Small-molecule targeting AMPA-mediated excitotoxicity has therapeutic effects in mouse models for multiple sclerosis. Sci. Adv. 2023;9 doi: 10.1126/sciadv.adj6187. [DOI] [PMC free article] [PubMed] [Google Scholar]
- 25.DeSilva T.M., Rosenberg P.A. Biology of the Oligodendrocyte. Cambridge Press; 2012. Glutamate receptors, transporters, and periventricular leukomalacia. [Google Scholar]
- 26.Evonuk K.S., Doyle R.E., Moseley C.E., Thornell I.M., Adler K., Bingaman A.M., Bevensee M.O., Weaver C.T., Min B., DeSilva T.M. Reduction of AMPA receptor activity on mature oligodendrocytes attenuates loss of myelinated axons in autoimmune neuroinflammation. Sci. Adv. 2020;6 doi: 10.1126/sciadv.aax5936. [DOI] [PMC free article] [PubMed] [Google Scholar]
- 27.Micu I., Jiang Q., Coderre E., Ridsdale A., Zhang L., Woulfe J., Yin X., Trapp B.D., McRory J.E., Rehak R., et al. NMDA receptors mediate calcium accumulation in myelin during chemical ischaemia. Nature. 2006;439:988–992. doi: 10.1038/nature04474. [DOI] [PubMed] [Google Scholar]
- 28.Talos D.M., Fishman R.E., Park H., Folkerth R.D., Follett P.L., Volpe J.J., Jensen F.E. Developmental regulation of alpha-amino-3-hydroxy-5-methyl-4-isoxazole-propionic acid receptor subunit expression in forebrain and relationship to regional susceptibility to hypoxic/ischemic injury. I. Rodent cerebral white matter and cortex. J. Comp. Neurol. 2006;497:42–60. doi: 10.1002/cne.20972. [DOI] [PMC free article] [PubMed] [Google Scholar]
- 29.Christensen P.C., Samadi-Bahrami Z., Pavlov V., Stys P.K., Moore G.R.W. Ionotropic glutamate receptor expression in human white matter. Neurosci. Lett. 2016;630:1–8. doi: 10.1016/j.neulet.2016.07.030. [DOI] [PubMed] [Google Scholar]
- 30.Talos D.M., Follett P.L., Folkerth R.D., Fishman R.E., Trachtenberg F.L., Volpe J.J., Jensen F.E. Developmental regulation of alpha-amino-3-hydroxy-5-methyl-4-isoxazole-propionic acid receptor subunit expression in forebrain and relationship to regional susceptibility to hypoxic/ischemic injury. II. Human cerebral white matter and cortex. J. Comp. Neurol. 2006;497:61–77. doi: 10.1002/cne.20978. [DOI] [PMC free article] [PubMed] [Google Scholar]
- 31.Li S., Stys P.K. Mechanisms of ionotropic glutamate receptor-mediated excitotoxicity in isolated spinal cord white matter. J. Neurosci. 2000;20:1190–1198. doi: 10.1523/JNEUROSCI.20-03-01190.2000. [DOI] [PMC free article] [PubMed] [Google Scholar]
- 32.Matute C., Sánchez-Gómez M.V., Martínez-Millán L., Miledi R. Glutamate receptor-mediated toxicity in optic nerve oligodendrocytes. Proc. Natl. Acad. Sci. USA. 1997;94:8830–8835. doi: 10.1073/pnas.94.16.8830. [DOI] [PMC free article] [PubMed] [Google Scholar]
- 33.Nishioka C., Liang H.F., Barsamian B., Sun S.W. Sequential phases of RGC axonal and somatic injury in EAE mice examined using DTI and OCT. Mult. Scler. Relat. Disord. 2019;27:315–323. doi: 10.1016/j.msard.2018.11.010. [DOI] [PMC free article] [PubMed] [Google Scholar]
- 34.van der Walt A., Kolbe S.C., Wang Y.E., Klistorner A., Shuey N., Ahmadi G., Paine M., Marriott M., Mitchell P., Egan G.F., et al. Optic nerve diffusion tensor imaging after acute optic neuritis predicts axonal and visual outcomes. PLoS One. 2013;8 doi: 10.1371/journal.pone.0083825. [DOI] [PMC free article] [PubMed] [Google Scholar]
- 35.Schafer D.P., Lehrman E.K., Kautzman A.G., Koyama R., Mardinly A.R., Yamasaki R., Ransohoff R.M., Greenberg M.E., Barres B.A., Stevens B. Microglia sculpt postnatal neural circuits in an activity and complement-dependent manner. Neuron. 2012;74:691–705. doi: 10.1016/j.neuron.2012.03.026. [DOI] [PMC free article] [PubMed] [Google Scholar]
- 36.Hong S., Beja-Glasser V.F., Nfonoyim B.M., Frouin A., Li S., Ramakrishnan S., Merry K.M., Shi Q., Rosenthal A., Barres B.A., et al. Complement and microglia mediate early synapse loss in Alzheimer mouse models. Science. 2016;352:712–716. doi: 10.1126/science.aad8373. [DOI] [PMC free article] [PubMed] [Google Scholar]
- 37.Chen C., Regehr W.G. Developmental remodeling of the retinogeniculate synapse. Neuron. 2000;28:955–966. doi: 10.1016/s0896-6273(00)00166-5. [DOI] [PubMed] [Google Scholar]
- 38.Granseth B., Ahlstrand E., Lindström S. Paired pulse facilitation of corticogeniculate EPSCs in the dorsal lateral geniculate nucleus of the rat investigated in vitro. J. Physiol. 2002;544:477–486. doi: 10.1113/jphysiol.2002.024703. [DOI] [PMC free article] [PubMed] [Google Scholar]
- 39.Chen X., Wang D., Kegel M., von Engelhardt J. Electrophysiological Investigations of Retinogeniculate and Corticogeniculate Synapse Function. J. Vis. Exp. 2019;150 doi: 10.3791/59680. [DOI] [PubMed] [Google Scholar]
- 40.Crawford D.K., Mangiardi M., Xia X., López-Valdés H.E., Tiwari-Woodruff S.K. Functional recovery of callosal axons following demyelination: a critical window. Neuroscience. 2009;164:1407–1421. doi: 10.1016/j.neuroscience.2009.09.069. [DOI] [PubMed] [Google Scholar]
- 41.Drerup C.M., Herbert A.L., Monk K.R., Nechiporuk A.V. Regulation of mitochondria-dynactin interaction and mitochondrial retrograde transport in axons. Elife. 2017;6 doi: 10.7554/eLife.22234. [DOI] [PMC free article] [PubMed] [Google Scholar]
- 42.Engl C., Tiemann L., Grahl S., Bussas M., Schmidt P., Pongratz V., Berthele A., Beer A., Gaser C., Kirschke J.S., et al. Cognitive impairment in early MS: contribution of white matter lesions, deep grey matter atrophy, and cortical atrophy. J. Neurol. 2020;267:2307–2318. doi: 10.1007/s00415-020-09841-0. [DOI] [PMC free article] [PubMed] [Google Scholar]
- 43.Hammond J.W., Bellizzi M.J., Ware C., Qiu W.Q., Saminathan P., Li H., Luo S., Ma S.A., Li Y., Gelbard H.A. Complement-dependent synapse loss and microgliosis in a mouse model of multiple sclerosis. Brain Behav. Immun. 2020;87:739–750. doi: 10.1016/j.bbi.2020.03.004. [DOI] [PMC free article] [PubMed] [Google Scholar]
- 44.Jafari M., Schumacher A.M., Snaidero N., Ullrich Gavilanes E.M., Neziraj T., Kocsis-Jutka V., Engels D., Jürgens T., Wagner I., Weidinger J.D.F., et al. Phagocyte-mediated synapse removal in cortical neuroinflammation is promoted by local calcium accumulation. Nat. Neurosci. 2021;24:355–367. doi: 10.1038/s41593-020-00780-7. [DOI] [PubMed] [Google Scholar]
- 45.Baltan S., Jawaid S.S., Chomyk A.M., Kidd G.J., Chen J., Battapady H.D., Chan R., Dutta R., Trapp B.D. Neuronal hibernation following hippocampal demyelination. Acta Neuropathol. Commun. 2021;9:34. doi: 10.1186/s40478-021-01130-9. [DOI] [PMC free article] [PubMed] [Google Scholar]
- 46.Zoupi L., Booker S.A., Eigel D., Werner C., Kind P.C., Spires-Jones T.L., Newland B., Williams A.C. Selective vulnerability of inhibitory networks in multiple sclerosis. Acta Neuropathol. 2021;141:415–429. doi: 10.1007/s00401-020-02258-z. [DOI] [PMC free article] [PubMed] [Google Scholar]
- 47.Asghari Adib E., Shadrach J.L., Reilly-Jankowiak L., Dwivedi M.K., Rogers A.E., Shahzad S., Passino R., Giger R.J., Pierchala B.A., Collins C.A. DLK signaling in axotomized neurons triggers complement activation and loss of upstream synapses. Cell Rep. 2024;43 doi: 10.1016/j.celrep.2024.113801. [DOI] [PMC free article] [PubMed] [Google Scholar]
- 48.Fuchs E.C., Zivkovic A.R., Cunningham M.O., Middleton S., Lebeau F.E.N., Bannerman D.M., Rozov A., Whittington M.A., Traub R.D., Rawlins J.N.P., Monyer H. Recruitment of parvalbumin-positive interneurons determines hippocampal function and associated behavior. Neuron. 2007;53:591–604. doi: 10.1016/j.neuron.2007.01.031. [DOI] [PubMed] [Google Scholar]
- 49.Schafer D.P., Lehrman E.K., Heller C.T., Stevens B. An engulfment assay: a protocol to assess interactions between CNS phagocytes and neurons. J. Vis. Exp. 2014;88 doi: 10.3791/51482. [DOI] [PMC free article] [PubMed] [Google Scholar]
- 50.Shindler K.S., Guan Y., Ventura E., Bennett J., Rostami A. Retinal ganglion cell loss induced by acute optic neuritis in a relapsing model of multiple sclerosis. Mult. Scler. 2006;12:526–532. doi: 10.1177/1352458506070629. [DOI] [PubMed] [Google Scholar]
- 51.Nemes-Baran A.D., White D.R., DeSilva T.M. Fractalkine-Dependent Microglial Pruning of Viable Oligodendrocyte Progenitor Cells Regulates Myelination. Cell Rep. 2020;32 doi: 10.1016/j.celrep.2020.108047. [DOI] [PMC free article] [PubMed] [Google Scholar]
- 52.Douglas R.M., Alam N.M., Silver B.D., McGill T.J., Tschetter W.W., Prusky G.T. Independent visual threshold measurements in the two eyes of freely moving rats and mice using a virtual-reality optokinetic system. Vis. Neurosci. 2005;22:677–684. doi: 10.1017/S0952523805225166. [DOI] [PubMed] [Google Scholar]
- 53.Fleming K.K., Bovaird J.A., Mosier M.C., Emerson M.R., LeVine S.M., Marquis J.G. Statistical analysis of data from studies on experimental autoimmune encephalomyelitis. J. Neuroimmunol. 2005;170:71–84. doi: 10.1016/j.jneuroim.2005.08.020. [DOI] [PubMed] [Google Scholar]
Associated Data
This section collects any data citations, data availability statements, or supplementary materials included in this article.
Supplementary Materials
Data Availability Statement
-
•
All data reported in this paper will be shared by the lead contact upon request.
-
•
This study did not generate new code.
-
•
Any additional information required to reanalyze the data reported in this paper is available from the lead contact upon request.