

Abstract
Background
Depression is a major contributor to the global burden of diseases, and alcohol intake is often considered to be associated with depression. However, the relationship between alcohol drinking frequency and depression remains unclear. This study aims to explore the association between alcohol drinking frequency and depression.
Methods
This study collected NHANES data from 2009 to 2016, involving 17,466 participants. Depression was diagnosed based on the Patient Health Questionnaire-9 (PHQ-9), and alcohol drinking frequency was collected through questionnaire surveys. Multifactorial logistic regression models, subgroup analysis, smooth curve fitting, and threshold effect analysis were used to investigate the relationship between alcohol drinking frequency and depression.
Results
We divided the alcohol drinking frequency into five groups on average. After adjusting for all covariates, the Q3 group had the lowest odds of depression (OR = 0.68; 95% CI: 0.56 ~ 0.82; p < 0.05). Through smooth curve fitting, we found an “M-shaped” relationship between alcohol drinking frequency and depression. Further threshold effect analysis revealed that the most significant inflection points were 80 and 150.
Conclusion
In this cross-sectional study of American adults, we found an “M-shaped” relationship between alcohol drinking frequency and depression, which may partially explain the different effects of moderate alcohol consumption on depression.
Keywords: Cross-sectional study, Alcohol consumption, Depression, NHANES
Introduction
Depression is a major contributor to the global burden of diseases [1], with a high incidence rate and frequent recurrence. The overall prevalence of depression worldwide is approximately 4.4% [2]. In the past decade, the economic burden of depression in the United States has increased by 48%, now requiring an investment of over US$325 billion annually [3]. Major depressive disorder can not only have a negative impact on education, interpersonal relationships, and employment, but it may also be associated with obesity, heart disease, cancer, dementia, and premature death (including suicide) [4–6]. Research has shown that alcohol consumption often occurs concurrently with common mental disorders such as depression and anxiety [7]. Since approximately 32.5% of the global population has a history of alcohol consumption [8], few health issues have generated as much controversy as the possible health effects of alcohol [9–12]. Theoretically, alcohol should be considered a risk factor for health due to its potential for dependency, as well as the high incidence and mortality rates associated with it [10]. However, some recent studies have also pointed out that compared to those who hardly drink, moderate drinkers have a significantly lower risk of all-cause mortality [13]. Retrospective analyses have also suggested that moderate alcohol consumption has certain benefits for cardiovascular diseases [14]. In the field of mental health, numerous studies have confirmed a high correlation between alcohol consumption and depression [15–19]. However, the results also indicate that the improvement effect of moderate alcohol consumption on depression is controversial and contradictory. Furthermore, we have observed that the majority of current studies on the correlation between alcohol consumption and depression utilize alcohol intake volume as the primary variable. There are rarely any reports on the impact of alcohol consumption frequency on depression. Existing reports merely mention a possible association between drinking frequency and depression, but the specific nature of this relationship has not been described in detail [20–24]. Given the high burden of depression and the high prevalence of global alcohol consumption, a detailed and accurate analysis of these issues is obviously crucial. To achieve this goal, we have utilized the NHANES dataset in this study.
Methods
Study design and participants
The National Health and Nutrition Examination Survey (NHANES) is a comprehensive study conducted by the National Center for Health Statistics (NCHS), a subdivision of the Centers for Disease Control and Prevention in the United States. NHANES employs a sophisticated, stratified, and multistage probabilistic design to gather a representative sample of the civilian population in the U.S., aiming to assess the health and nutritional status of non-institutionalized citizens. The survey collects a wealth of data through household interviews, physical examinations conducted in a mobile examination center (MEC), and laboratory testing overseen by highly skilled medical professionals. For further information on NHANES, please visit the official website at https://www.cdc.gov/nchs/nhanes/about_nhanes.htm. The NCHS Ethics Review Board has granted approval for this research, and all participants have provided written informed consent.
We restricted the target population of this cross-sectional study to participants from the NHANES database from 2009 to 2016 (total 40,439 individuals). Since the questionnaire data on alcohol consumption was limited to individuals aged 18 and above, all participants in this study were over 18 years old. After excluding individuals with missing information on alcohol intake (n = 3608) and those with incomplete PHQ-9 questionnaire data (n = 19365), a total of 17,466 participants were finally included in the analysis. Figure 1 offers a visual depiction of the process we followed for selecting our sample.
Fig. 1.
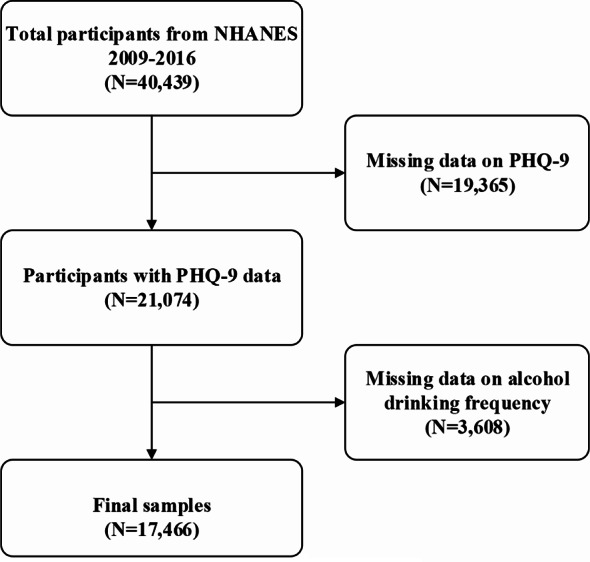
Flow chart of participants selection. NHANES, National Health and Nutrition Examination Survey; PHQ, Patient Health Questionnaire
Assessment of alcohol drinking frequency
During the MEC interview, trained interviewers employed a Computer-Assisted Personal Interview (CAPI) system to pose questions to determine the alcohol drinking frequency of participants. The specific question was as follows: “In the past 12 months, how often did you drink any type of alcoholic beverage?” PROBE: “How many days per year did you drink?” Participants were required to fill in any number from 0 to 365 based on their actual alcohol drinking frequency. If participants refused to disclose this information, they were instructed to fill in 777. If they were unaware of their alcohol drinking frequency, they were to fill in 999. The definition of " drink” refers to 12 ounces of beer, a 5-ounce serving of wine, or 1.5 ounces of liquor.These two categories of information, along with missing data, were excluded from the analysis. Subsequently, based on the frequency of alcohol consumption, participants were evenly divided into five groups from low to high to compare the baseline characteristics of participants with different drinking frequencies.
Assessment of depression
Depression symptoms were assessed using the Patient Health Questionnaire-9 (PHQ-9), a 9-item screening tool where each item is scored on a scale of 0 to 3, with a total score ranging from 0 to 27. The PHQ-9 inquiries about the frequency of depressive symptoms over the past 2 weeks, with higher scores indicating greater severity of depression. In clinical practice, a PHQ-9 score of 10 or above is considered indicative of depression [25]. There is evidence that the PHQ-9 demonstrates good specificity and sensitivity in accurately diagnosing major depressive disorder [26].
Selection of covariates
The covariates considered in this study encompassed various potential factors, including gender (male/female), age (years), race (Mexican American/other Hispanic/non-Hispanic white/non-Hispanic black/other races), education level (Less than 9th grade, 9-11th grade, High school graduate, Some college or AA degree, and College graduate or above), ratio of family income to poverty, body mass index (BMI, kg/m2), waist circumference (cm), smoking status (yes/no), presence of coronary artery disease (yes/no), asthma (yes/no), gout (yes/no), hepatopathy (yes/no), diabetes (yes/no), congestive heart failure (yes/no), history of apoplexy (yes/no), and presence of cancer (yes/no). Participants were categorized into three groups based on BMI: <25 kg/m2 indicating normal weight, 25–29.9 kg/m2 indicating overweight, and ≥ 30 kg/m2 indicating obesity.
Statistical analysis
Data was downloaded from the NHANES website. All statistical analyses were performed using EmpowerStats software (version 4.1.0, http://www.empowerstats.com) and R software (version 4.2.0, http://www.r-project.org). A significance level of p < 0.05 was considered statistically significant. To account for the complex design of the National Health Interview Survey, strata, primary sampling units, and sample adult weights were incorporated into the analyses. Categorical variables were analyzed using the weighted Chi-square test, while continuous variables were evaluated through weighted linear regression. The results for categorical variables are presented as weighted proportions with 95% confidence intervals (CI), and for continuous variables, they are expressed as weighted means ± Standard Error (SE). In exploring the relationship between alcohol drinking frequency and depression, we utilized multivariate logistic regression analysis to construct tests that yielded beta values and 95% confidence intervals. These tests encompassed three distinct models: an unadjusted model 1, a model 2 adjusted for gender, age, and race, and a fully adjusted model 3, taking into account all relevant covariates. Additionally, we conducted subgroup analyses to investigate the alcohol drinking frequency-depression relationship across various stratification factors. Parallel to this, we performed smooth curve fitting, adjusting the variables accordingly, to visualize the relationship. Finally, we employed a threshold effect analysis model to delve deeper into the nature of this relationship and identify potential inflection points between alcohol drinking frequency and depression.
Results
Baseline characteristics of participants
This study involved 17,466 participants with an average age of (48.14 ± 17.96) years, including 53.08% males and 46.92% females. Among them, 1640 cases (9.39%) were assessed as depressed (PHQ-9 ≥ 10). Compared with the non-depressed group, the depressed group had a higher proportion of females, a higher proportion of Other Hispanic ethnicity, a higher proportion of individuals with education levels of Less than 9th grade and 9-11th grade, a higher proportion of marital statuses such as widowed, divorced, separated, and never married, a higher proportion of individuals with higher poverty levels, a higher proportion of individuals with higher body mass index and waist circumference, and a higher proportion of comorbidities such as asthma, congestive heart failure, coronary heart disease, apoplexy, hepatopathy, and diabetes. Additionally, a higher proportion of smoking and non-drinking was observed in the depressed group. However, a grouped analysis of alcohol consumption frequency revealed that different frequencies of alcohol consumption had varying outcomes. Statistical analysis showed no significant differences in age and tumor status between the two groups (p > 0.05) (Table 1).
Table 1.
Baseline characteristics of participants with and without depression
| Variable | PHQ-9 < 10 (n = 15826) |
PHQ-9 ≥ 10 (n = 1640) |
P-value |
|---|---|---|---|
| Age (years) | 48.12 ± 18.10 | 48.29 ± 16.53 | 0.72 |
| Gender (%) | < 0.001 | ||
| Male | 8625 (54.50%) | 646 (39.39%) | |
| Female | 7201 (45.50%) | 994 (60.61%) | |
| Race (%) | < 0.001 | ||
| Mexican American | 2300 (14.53%) | 221 (13.48%) | |
| Other Hispanic | 1552 (9.81%) | 214 (13.05%) | |
| Non-Hispanic White | 6903 (43.62%) | 716 (43.66%) | |
| Non-Hispanic Black | 3338 (21.09%) | 360 (21.95%) | |
| Other Race | 1733 (10.95%) | 129 (7.87%) | |
| Education level (%) | < 0.001 | ||
| Less than 9th grade | 1168 (7.60%) | 194 (12.12%) | |
| 9-11th grade | 1995 (12.97%) | 339 (21.17%) | |
| High school graduate | 3432 (22.32%) | 372 (23.24%) | |
| Some college | 4734 (30.79%) | 511 (31.92%) | |
| College graduate or above | 4038 (26.26%) | 185 (11.56%) | |
| Marital status (%) | < 0.001 | ||
| Married | 7998 (52.01%) | 543 (33.92%) | |
| Widowed | 1015 (6.60%) | 150 (9.37%) | |
| Divorced | 1665 (10.83%) | 292 (18.24%) | |
| Separated | 464 (3.02%) | 113 (7.06%) | |
| Never married | 2912 (18.94%) | 342 (21.36%) | |
| Living with partner | 1315 (8.55%) | 160 (9.99%) | |
| Ratio of family income to poverty | 2.61 ± 1.65 | 1.68 ± 1.36 | < 0.001 |
| Body Mass Index(kg/m2) | 28.95 ± 6.77 | 30.98 ± 8.58 | < 0.001 |
| Waist Circumference(cm) | 98.96 ± 16.31 | 102.89 ± 18.64 | < 0.001 |
| Asthma | < 0.001 | ||
| No | 13,545 (85.59%) | 1226 (74.76%) | |
| Yes | 2281 (14.41%) | 414 (25.24%) | |
| Gout | < 0.001 | ||
| No | 15,132 (95.61%) | 1535 (93.60%) | |
| Yes | 694 (4.39%) | 105 (6.40%) | |
| Congestive heart failure | < 0.001 | ||
| No | 15,402 (97.32%) | 1531 (93.35%) | |
| Yes | 424 (2.68%) | 109 (6.65%) | |
| Coronary heart disease | < 0.001 | ||
| No | 15,238 (96.28%) | 1534 (93.54%) | |
| Yes | 588 (3.72%) | 106 (6.46%) | |
| Apoplexy | < 0.001 | ||
| No | 15,353 (97.01%) | 1521 (92.74%) | |
| Yes | 473 (2.99%) | 119 (7.26%) | |
| Hepatopathy | < 0.001 | ||
| No | 15,329 (96.86%) | 1504 (91.71%) | |
| Yes | 497 (3.14%) | 136 (8.29%) | |
| Cancer | 0.325 | ||
| No | 14,305 (90.39%) | 1470 (89.63%) | |
| Yes | 1521 (9.61%) | 170 (10.37%) | |
| Diabetes | < 0.001 | ||
| No | 14,011 (88.53%) | 1313 (80.06%) | |
| Yes | 1815 (11.47%) | 327 (19.94%) | |
| Smoking | < 0.001 | ||
| No | 12,535 (79.21%) | 972 (59.27%) | |
| Yes | 3291 (20.79%) | 668 (40.73%) | |
| Drinking | < 0.001 | ||
| No | 3087 (19.51%) | 448 (27.32%) | |
| Yes | 12,739 (80.49%) | 1192 (72.68%) | |
| Drinking frequency | < 0.001 | ||
| Quartile1 | 3087 (19.51%) | 448 (27.32%) | |
| Quartile2 | 3633 (22.96%) | 308 (18.78%) | |
| Quartile3 | 3146 (19.88%) | 238 (14.51%) | |
| Quartile4 | 2892 (18.27%) | 272 (16.59%) | |
| Quartile5 | 3068 (19.39%) | 374 (22.80%) |
Mean ± SD for continuous variables: the p-value was calculated by weighted linear regression model. % for categorical variables: the p-value was calculated by a weighted chi-square test
p < 0.05 was considered statistically significant
Relationship between alcohol drinking frequency and depression
Our study results indicate that individuals who consume alcohol have a lower likelihood of developing depression compared to non-drinkers. This association was significant in both our crude model (OR = 0.64; 95% CI: 0.57 ~ 0.72; p < 0.05) and minimally adjusted model (OR = 0.64; 95% CI: 0.57 ~ 0.72; p < 0.05), showing a 36% lower odds of depression among alcohol consumers compared to non-drinkers. After adjusting for all covariates, the association remained (OR = 0.83; 95% CI: 0.72–0.96; p < 0.05), but the reduction in odds was reduced to 17%. To further analyze the relationship between alcohol drinking frequency and depression, we divided the participants into five equal groups. After adjusting for all covariates, the Q3 group had the lowest odds of depression (OR = 0.68; 95% CI: 0.56 ~ 0.82; p < 0.05), while the Q5 group showed an increased risk of depression (OR = 1.12; 95% CI: 0.94 ~ 1.33; p > 0.05), though this association did not reach statistical significance (Table 2). To evaluate the reliability of the association between alcohol consumption and depression, we conducted subgroup analyses based on gender, age, race, education level, family income-to-poverty ratio, body mass index, waist circumference, smoking status, presence of coronary artery disease, asthma, gout, hepatopathy, diabetes, congestive heart failure, history of apoplexy, and cancer status. Except for the subgroups of individuals under 20 years old, those with a marital status of “Separated” and those diagnosed with congestive heart failure and apoplexy, all other subgroups exhibited a negative correlation between alcohol consumption and depression. Significant interactions were observed in most subgroups (P < 0.05) (Table 3). The categorization of alcohol drinking frequency revealed a complex nonlinear relationship between drinking frequency and depression. Therefore, we employed smooth curve fitting to characterize the potential association between drinking frequency and depression. The results indicated an “M-shaped” relationship between drinking frequency and depression(Fig. 2). Further threshold effect analysis identified the most significant inflection points at 80 and 150. Specifically, when the drinking frequency ranged from 0 to 80, each additional drink increased the PHQ-9 score by 0.04 (β = 0.04; 95% CI: 0.03 ~ 0.05; P < 0.05). However, when the drinking frequency ranged from 80 to 150, each additional drink decreased the PHQ-9 score by 0.07 (β = -0.07; 95% CI: -0.12~-0.03; P < 0.05). When the drinking frequency exceeded 150, the association between drinking frequency and depression was not statistically significant (P > 0.05) (Table 4).
Table 2.
The association between alcohol drinking frequency and depression
| Exposure | Model 1 OR (95% CI) P value |
Model 2 OR (95% CI) P value |
Model 3 OR (95% CI) P value |
|---|---|---|---|
| Drinking | 0.64 (0.57 ~ 0.72) < 0.0001 | 0.64 (0.57 ~ 0.72) < 0.0001 | 0.83 (0.72 ~ 0.96) 0.0094 |
| Drinking frequency | |||
| Quartile1 | 1 | 1 | 1 |
| Quartile2 | 0.58 (0.50 ~ 0.68) < 0.0001 | 0.56 (0.48 ~ 0.65) < 0.0001 | 0.72 (0.60 ~ 0.86) 0.0004 |
| Quartile3 | 0.52 (0.44 ~ 0.61) < 0.0001 | 0.50 (0.42 ~ 0.60) < 0.0001 | 0.68 (0.56 ~ 0.82) < 0.0001 |
| Quartile4 | 0.65 (0.55 ~ 0.76) < 0.0001 | 0.64 (0.54 ~ 0.75) < 0.0001 | 0.82 (0.67 ~ 0.99) 0.0351 |
| Quartile5 | 0.84 (0.73 ~ 0.97) 0.0193 | 0.85 (0.73 ~ 0.99) 0.0340 | 1.12 (0.94 ~ 1.33) 0.2006 |
Model 1, no covariates were adjusted. Model 2, age, gender, and race were adjusted. Model 3, gender, age, race, education level, ratio of family income to poverty, body mass index, waist circumference, smoking status, presence of coronary artery disease, asthma, gout, hepatopathy, diabetes, congestive heart failure, history of apoplexy, and presence of cancer were adjusted
Multivariate logistic regression analysis was used to calculate beta values and 95% confidence intervals
95% CI, 95% confidence interval; OR, odds ratio;
p < 0.05 was considered statistically significant
Table 3.
Subgroup analysis of the relationship between alcohol drinking frequency and depression
| Subgroup | N | OR(95%CI) | P for interaction |
|---|---|---|---|
| Age (years) | |||
| <20 | 488 | 1.61 (0.37 ~ 6.96) | 0.5221 |
| >=20, < 40 | 5804 | 0.78 (0.59 ~ 1.05) | 0.0982 |
| >=40, < 60 | 5735 | 0.59 (0.49 ~ 0.71) | < 0.0001 |
| >=60 | 5439 | 0.58 (0.48 ~ 0.70) | < 0.0001 |
| Gender (%) | |||
| Male | 9271 | 0.62 (0.52 ~ 0.75) | < 0.0001 |
| Female | 8195 | 0.67 (0.58 ~ 0.78) | < 0.0001 |
| Race (%) | |||
| Mexican American | 2521 | 0.73 (0.54 ~ 1.00) | 0.0536 |
| Other Hispanic | 1766 | 0.98 (0.69 ~ 1.39) | 0.9035 |
| Non-Hispanic White | 7619 | 0.48 (0.41 ~ 0.57) | < 0.0001 |
| Non-Hispanic Black | 3698 | 0.87 (0.67 ~ 1.12) | 0.2754 |
| Other Race | 1862 | 0.72 (0.46 ~ 1.11) | 0.139 |
| Education level (%) | |||
| Less than 9th grade | 1362 | 0.93 (0.68 ~ 1.28) | 0.6527 |
| 9-11th grade | 2334 | 0.80 (0.63 ~ 1.03) | 0.0848 |
| High school graduate | 3804 | 0.76 (0.60 ~ 0.97) | 0.0257 |
| Some college | 5245 | 0.71 (0.57 ~ 0.88) | 0.0019 |
| College graduate or above | 4223 | 0.44 (0.31 ~ 0.63) | < 0.0001 |
| Marital status (%) | |||
| Married | 8541 | 0.54 (0.45 ~ 0.66) | <0.0001 |
| Widowed | 1165 | 0.83 (0.59 ~ 1.18) | 0.306 |
| Divorced | 1957 | 0.66 (0.50 ~ 0.87) | 0.0033 |
| Separated | 577 | 1.29 (0.78 ~ 2.13) | 0.323 |
| Never married | 3254 | 0.58 (0.43 ~ 0.78) | 0.0004 |
| Living with partner | 1475 | 0.70 (0.47 ~ 1.05) | 0.0846 |
| Ratio of family income to poverty | |||
| 0–1.33 | 5349 | 0.78 (0.67 ~ 0.92) | 0.0032 |
| 1.34–3.35 | 5370 | 0.66 (0.53 ~ 0.81) | 0.0001 |
| 3.36–5 | 5374 | 0.86 (0.59 ~ 1.27) | 0.4514 |
| Body Mass Index (kg/m2) | |||
| <25 | 5099 | 0.62 (0.48 ~ 0.78) | < 0.0001 |
| >=25, < 30 | 5662 | 0.77 (0.61 ~ 0.98) | 0.0326 |
| >=30 | 6546 | 0.64 (0.54 ~ 0.75) | < 0.0001 |
| Waist Circumference (cm) | |||
| 55.5–91.1 | 5639 | 0.71 (0.55 ~ 0.92) | 0.0097 |
| 91.2–104.9 | 5633 | 0.70 (0.56 ~ 0.87) | 0.0015 |
| 105–177.9 | 5673 | 0.67 (0.57 ~ 0.80) | <0.0001 |
| Smoking | |||
| No | 13,507 | 0.58 (0.50 ~ 0.67) | < 0.0001 |
| Yes | 3959 | 0.67 (0.55 ~ 0.83) | 0.0001 |
| Asthma | |||
| No | 14,771 | 0.70 (0.62 ~ 0.81) | < 0.0001 |
| Yes | 2695 | 0.48 (0.38 ~ 0.61) | < 0.0001 |
| Gout | |||
| No | 16,667 | 0.65 (0.57 ~ 0.73) | <0.0001 |
| Yes | 799 | 0.72 (0.47 ~ 1.11) | 0.1377 |
| Congestive heart failure | |||
| No | 16,933 | 0.65 (0.57 ~ 0.73) | < 0.0001 |
| Yes | 533 | 1.15 (0.75 ~ 1.77) | 0.5085 |
| Coronary heart disease | |||
| No | 16,772 | 0.66 (0.58 ~ 0.74) | < 0.0001 |
| Yes | 694 | 0.71 (0.47 ~ 1.08) | 0.1131 |
| Apoplexy | |||
| No | 16,874 | 0.66 (0.58 ~ 0.74) | < 0.0001 |
| Yes | 592 | 1.06 (0.70 ~ 1.58) | 0.7931 |
| Hepatopathy | |||
| No | 16,833 | 0.65 (0.57 ~ 0.73) | < 0.0001 |
| Yes | 633 | 0.94 (0.63 ~ 1.40) | 0.7529 |
| Cancer | |||
| No | 15,775 | 0.63 (0.56 ~ 0.72) | < 0.0001 |
| Yes | 1691 | 0.74 (0.53 ~ 1.04) | 0.086 |
| Diabetes | |||
| No | 15,324 | 0.71 (0.62 ~ 0.81) | < 0.0001 |
| Yes | 2142 | 0.68 (0.54 ~ 0.87) | 0.0018 |
N, number; 95% CI, 95% confidence interval; OR, odds ratio;
p < 0.05 was considered statistically significant
Fig. 2.

The nonlinear associations between alcohol drinking frequency and PHQ-9. The solid red line represents the smooth curve fit between variables. Blue bands represent the 95% of confidence interval from the fit. PHQ, Patient Health Questionnaire
Table 4.
Threshold effect analysis between alcohol drinking frequency and PHQ-9
| Model | PHQ-9 β (95% CI) |
P value |
|---|---|---|
| Inflection point (K1, K2) | 80,150 | |
| Effect 1 in the interval before K1 | 0.04 (0.03 ~ 0.05) | < 0.0001 |
| Effect 2 in the interval between K1 and K2 | -0.07 (-0.12~ -0.03) | 0.0014 |
| Effect 3 in the interval after K2 | -0.01 (-0.03 ~ 0.01) | 0.2639 |
| Difference in effects between 1 and 2 | 0.11 (0.06 ~ 0.16) | < 0.0001 |
| Difference in effects between 3 and 2 | 0.06 (0.01 ~ 0.11) | 0.0104 |
| Log-likelihood Ratio Test | < 0.001 |
Model, gender, age, race, education level, ratio of family income to poverty, body mass index, waist circumference, smoking status, presence of coronary artery disease, asthma, gout, hepatopathy, diabetes, congestive heart failure, history of apoplexy, and presence of cancer were adjusted
β was the effect size of the change in PHQ-9;PHQ, Patient Health Questionnaire; 95% CI, 95% confidence interval;
p < 0.05 was considered statistically significant
Discussion
The research sample used in our study adequately represents the demographic characteristics of the nationwide US population. Our findings observed a decrease in the prevalence of depression associated with alcohol consumption. However, upon further stratification of alcohol consumption frequency, we discovered that different frequencies of alcohol consumption had varying impacts on depression. Through smooth curve fitting, our study is the first to reveal an “M-shaped” relationship between alcohol consumption frequency and depression, with the most significant inflection points occurring at 80 and 150. Interestingly, through this large cross-sectional observational study, we found that the prevalence of depression was lower in drinkers compared to non-drinkers, contrary to previous conclusions in other health domains [8]. Given the potential unreasonableness of grouping individuals solely based on whether they consume alcohol, which may lead to skewed averages in certain groups and distort the original data trends, we further examined alcohol consumption frequency and arrived at different conclusions. However, it cannot be denied that the notion that abstaining from alcohol does not reduce the incidence of depression compared to low-to-moderate alcohol consumption has gained increasing recognition [24, 27]. Nonetheless, the role of moderate alcohol consumption in depression has also been questioned by some studies [19, 28, 29]. The emergence of these scenarios suggests that there are still some hidden factors between the association of alcohol consumption and depression that have yet to be discovered. Through literature review, we found that the main reasons for proposing that moderate alcohol consumption can reduce depression are: firstly, the antioxidant properties of certain components of alcohol (such as polyphenols) [15] ; secondly, studies have found that moderate drinkers have lower levels of C-reactive protein (CRP) [30], while levels of inflammatory cytokines, including interleukin-6 (IL-6), tumor necrosis factor-alpha (TNFα), and CRP, have been found to be higher in patients with depression compared to control groups in relevant studies [31–33] ; and lastly, the positive impact of moderate alcohol consumption on cardiovascular health may in turn reduce the risk of depression [18]. After reviewing previous research methods, we have observed that the criteria for moderate alcohol consumption primarily limit alcohol intake while neglecting the frequency of drinking. Several studies have shown that the frequency of alcohol consumption is positively correlated with the frequency of contact between drinkers and their close friends and family, indicating a certain social attribute [34]. The increase in social activities associated with moderate alcohol consumption may serve as a mediating factor in reducing depression [35]. Research has demonstrated that individuals with good social integration tend to have fewer emotional complaints compared to those who are isolated [36]. A possible explanation for our findings is that moderate alcohol consumption provides opportunities for social interaction. For instance, when the frequency of alcohol consumption exceeds 80 times but is less than 150 times, the social attribute within this range is stronger, leading to a more sustained beneficial impact on mood. However, when this social attribute exceeds a certain threshold (approaching once every two days or more) or falls below a certain level (less than once every four days or less), even with its social attribute, it may diminish the beneficial effects on mood. Therefore, the frequency of alcohol consumption could be the hidden factor between alcohol consumption and depression that we previously analyzed, resulting in the different outcomes observed in similar studies mentioned earlier.
Our study has several noteworthy limitations. Firstly, given that our study employs an observational cross-sectional design, it is not possible to establish causal relationships among the variables. Ideally, the investigation would involve collecting data on alcohol consumption frequency over the past year along with the corresponding number of hospital visits/psychiatric consultations resulting from it. This would require additional research to better elucidate these causal relationships. Secondly, given the social attribute of alcohol consumption frequency, we are unable to determine whether a particular instance of alcohol consumption in the NHANES database was consumed alone or in a group setting. Thirdly, due to the limitations of the data included in the database, assessing alcohol consumption frequency solely based on the number of days alcohol is consumed is inadequate. To adequately quantify alcohol consumption frequency, it is necessary to combine the frequency of drinking with temporal variables, such as 1–2 times per day or 1–2 times per week. Lastly, there may be biases in self-reported alcohol consumption status, and the actual alcohol consumption pattern may differ from the data entered in the database.
Conclusion
Our study established a correlation between the frequency of alcohol consumption and depression, indicating that when investigating the impact of alcohol on depression, the frequency of consumption, apart from the amount of alcohol intake, is also a crucial factor affecting the results. Furthermore, this impact exhibits a complex “M-shaped” relationship. To validate our findings, it is necessary to conduct additional studies to demonstrate the accuracy of our results.
Acknowledgements
Not applicable.
Abbreviations
- BMI
Body Mass Index
- CAPI
Computer-Assisted Personal Interview
- CI
Confidence Intervals
- CRP
C-Reactive Protein
- IL-6
Interleukin-6
- MEC
Mobile Examination Center
- NHANES
National Health and Nutrition Examination Survey
- NCHS
National Center for Health Statistics
- OR
Odds Ratio
- PHQ
Patient Health Questionnaire
- SE
Standard Error
- TNFα
Tumor Necrosis Factor-alpha
Author contributions
PQ was major contributors in the writing of the manuscript.MH evaluated and revised the manuscript. HZ guided the writing of the manuscript and critically reviewed it. All authors read and approved the final version.
Funding
Not applicable.
Data availability
The National Health and Nutrition Examination Survey (NHANES). (https://www.cdc.gov/nchs/nhanes/index.htm) provided the data for this investigation.
Declarations
Ethics approval and consent to participate
This study adhered to the ethical principles of the National Center for Health Statistics (NCHS) and obtained approval from the NCHS Ethics Review Board. For specific details regarding ethics, please refer to the website: https://www.cdc.gov/nchs/nhanes/irba98.htm.
Consent for publication
Not applicable.
Competing interests
The authors declare no competing interests.
Footnotes
Publisher’s note
Springer Nature remains neutral with regard to jurisdictional claims in published maps and institutional affiliations.
Peng Qi and Mengjie Huang contributed equally to this work and shared first authorship
References
- 1.Thapar A, Eyre O, Patel V, Brent D. Depression in young people. Lancet (London England). 2022;400(10352):617–31. [DOI] [PubMed] [Google Scholar]
- 2.Marwaha S, Palmer E, Suppes T, Cons E, Young AH, Upthegrove R. Novel and emerging treatments for major depression. Lancet (London England). 2023;401(10371):141–53. [DOI] [PubMed] [Google Scholar]
- 3.Monroe SM, Harkness KL. Major Depression and its recurrences: life course matters. Ann Rev Clin Psychol. 2022;18:329–57. [DOI] [PubMed] [Google Scholar]
- 4.Carney RM, Freedland KE. Depression and coronary heart disease. Nat Reviews Cardiol. 2017;14(3):145–55. [DOI] [PubMed] [Google Scholar]
- 5.Hidese S, Asano S, Saito K, Sasayama D, Kunugi H. Association of depression with body mass index classification, metabolic disease, and lifestyle: a web-based survey involving 11,876 Japanese people. J Psychiatr Res. 2018;102:23–8. [DOI] [PubMed] [Google Scholar]
- 6.Wakefield CE, Butow PN, Aaronson NA, Hack TF, Hulbert-Williams NJ, Jacobsen PB. Patient-reported depression measures in cancer: a meta-review. Lancet Psychiatry. 2015;2(7):635–47. [DOI] [PubMed] [Google Scholar]
- 7.Puddephatt JA, Irizar P, Jones A, Gage SH, Goodwin L. Associations of common mental disorder with alcohol use in the adult general population: a systematic review and meta-analysis. Addiction (Abingdon England). 2022;117(6):1543–72. [DOI] [PMC free article] [PubMed] [Google Scholar]
- 8.Alcohol use and burden. for 195 countries and territories, 1990–2016: a systematic analysis for the Global Burden of Disease Study 2016. Lancet (London, England). 2018;392(10152):1015–35. [DOI] [PMC free article] [PubMed]
- 9.Sadhu JS, Novak E, Mukamal KJ, Kizer JR, Psaty BM, Stein PK, et al. Association of Alcohol Consumption after Development of Heart failure with survival among older adults in the Cardiovascular Health Study. JAMA Netw open. 2018;1(8):e186383. [DOI] [PMC free article] [PubMed] [Google Scholar]
- 10.The global burden. Of disease attributable to alcohol and drug use in 195 countries and territories, 1990–2016: a systematic analysis for the global burden of Disease Study 2016. Lancet Psychiatry. 2018;5(12):987–1012. [DOI] [PMC free article] [PubMed] [Google Scholar]
- 11.Redondo N, Nova E, Díaz-Prieto LE, Marcos A. Effects of moderate beer consumption on health. Nutr Hosp. 2018;35(Spec No6):41–4. [DOI] [PubMed] [Google Scholar]
- 12.Tresserra-Rimbau A, Medina-Remón A, Lamuela-Raventós RM, Bulló M, Salas-Salvadó J, Corella D, et al. Moderate red wine consumption is associated with a lower prevalence of the metabolic syndrome in the PREDIMED population. Br J Nutr. 2015;113(Suppl 2):S121–30. [DOI] [PubMed] [Google Scholar]
- 13.Zhao J, Stockwell T, Naimi T, Churchill S, Clay J, Sherk A. Association between Daily Alcohol Intake and Risk of all-cause mortality: a systematic review and Meta-analyses. JAMA Netw open. 2023;6(3):e236185. [DOI] [PMC free article] [PubMed] [Google Scholar]
- 14.de Gaetano G, Costanzo S, Di Castelnuovo A, Badimon L, Bejko D, Alkerwi A, et al. Effects of moderate beer consumption on health and disease: a consensus document. Nutrition, metabolism, and cardiovascular diseases. NMCD. 2016;26(6):443–67. [DOI] [PubMed] [Google Scholar]
- 15.Pavlidou E, Mantzorou M, Fasoulas A, Tryfonos C, Petridis D, Giaginis C. Wine: An Aspiring Agent in Promoting Longevity and Preventing Chronic Diseases. Diseases (Basel, Switzerland). 2018;6(3). [DOI] [PMC free article] [PubMed]
- 16.Polimanti R, Peterson RE, Ong JS, MacGregor S, Edwards AC, Clarke TK, et al. Evidence of causal effect of major depression on alcohol dependence: findings from the psychiatric genomics consortium. Psychol Med. 2019;49(7):1218–26. [DOI] [PMC free article] [PubMed] [Google Scholar]
- 17.Gea A, Beunza JJ, Estruch R, Sánchez-Villegas A, Salas-Salvadó J, Buil-Cosiales P, et al. Alcohol intake, wine consumption and the development of depression: the PREDIMED study. BMC Med. 2013;11:192. [DOI] [PMC free article] [PubMed] [Google Scholar]
- 18.Gémes K, Forsell Y, Janszky I, László KD, Lundin A, Ponce De Leon A, et al. Moderate alcohol consumption and depression - a longitudinal population-based study in Sweden. Acta Psychiatrica Scandinavica. 2019;139(6):526–35. [DOI] [PubMed] [Google Scholar]
- 19.Ruiz-Estigarribia L, Martínez-González M, Díaz-Gutiérrez J, Sánchez-Villegas A, Lahortiga-Ramos F, Bes-Rastrollo M. Lifestyles and the risk of depression in the Seguimiento Universidad De Navarra cohort. Eur Psychiatry: J Association Eur Psychiatrists. 2019;61:33–40. [DOI] [PubMed] [Google Scholar]
- 20.Rosenthal SR, Clark MA, Marshall BDL, Buka SL, Carey KB, Shepardson RL, et al. Alcohol consequences, not quantity, predict major depression onset among first-year female college students. Addict Behav. 2018;85:70–6. [DOI] [PubMed] [Google Scholar]
- 21.Paljärvi T, Koskenvuo M, Poikolainen K, Kauhanen J, Sillanmäki L, Mäkelä P. Binge drinking and depressive symptoms: a 5-year population-based cohort study. Addiction (Abingdon England). 2009;104(7):1168–78. [DOI] [PubMed] [Google Scholar]
- 22.Castellanos-Perilla N, Borda MG, Cataño S, Giraldo S, Vik-Mo AO, Aarsland D, et al. Specific depressive symptoms are related with different patterns of alcohol use in community-dwelling older adults. Arch Gerontol Geriatr. 2022;101:104696. [DOI] [PubMed] [Google Scholar]
- 23.Kim Y, Kim J, Oh JW, Lee S. Association between drinking behaviors, sleep duration, and depressive symptoms. Sci Rep. 2024;14(1):5992. [DOI] [PMC free article] [PubMed] [Google Scholar]
- 24.Visontay R, Mewton L, Slade T, Aris IM, Sunderland M. Moderate Alcohol Consumption and depression: a marginal Structural Model Approach promoting causal inference. Am J Psychiatry. 2023;180(3):209–17. [DOI] [PubMed] [Google Scholar]
- 25.Huang Q, Wang D, Chen S, Tang L, Ma C. Association of METS-IR index with depressive symptoms in US adults: a cross-sectional study. J Affect Disord. 2024;355:355–62. [DOI] [PubMed] [Google Scholar]
- 26.Hirschtritt ME, Kroenke K. Screening for Depression. JAMA. 2017;318(8):745–6. [DOI] [PubMed] [Google Scholar]
- 27.Nunes EV. Alcohol and the etiology of Depression. Am J Psychiatry. 2023;180(3):179–81. [DOI] [PubMed] [Google Scholar]
- 28.Fukunaga A, Inoue Y, Kochi T, Hu H, Eguchi M, Kuwahara K, et al. Prospective study on the Association between Adherence to Healthy Lifestyles and depressive symptoms among Japanese employees: the Furukawa Nutrition and Health Study. J Epidemiol. 2020;30(7):288–94. [DOI] [PMC free article] [PubMed] [Google Scholar]
- 29.García-Esquinas E, Ortolá R, Galán I, Soler-Vila H, Laclaustra M, Rodríguez-Artalejo F. Moderate alcohol drinking is not associated with risk of depression in older adults. Sci Rep. 2018;8(1):11512. [DOI] [PMC free article] [PubMed] [Google Scholar]
- 30.Paulson D, Shah M, Herring D, Scott R, Herrera M, Brush D, et al. The relationship between moderate alcohol consumption, depressive symptomatology, and C-reactive protein: the Health and Retirement Study. Int J Geriatr Psychiatry. 2018;33(2):316–24. [DOI] [PubMed] [Google Scholar]
- 31.Bai S, Guo W, Feng Y, Deng H, Li G, Nie H, et al. Efficacy and safety of anti-inflammatory agents for the treatment of major depressive disorder: a systematic review and meta-analysis of randomised controlled trials. J Neurol Neurosurg Psychiatry. 2020;91(1):21–32. [DOI] [PubMed] [Google Scholar]
- 32.Köhler-Forsberg O, C NL, Hjorthøj C, Nordentoft M, Mors O, Benros ME. Efficacy of anti-inflammatory treatment on major depressive disorder or depressive symptoms: meta-analysis of clinical trials. Acta Psychiatrica Scandinavica. 2019;139(5):404–19. [DOI] [PubMed] [Google Scholar]
- 33.Husain MI, Chaudhry IB, Khoso AB, Husain MO, Hodsoll J, Ansari MA, et al. Minocycline and celecoxib as adjunctive treatments for bipolar depression: a multicentre, factorial design randomised controlled trial. Lancet Psychiatry. 2020;7(6):515–27. [DOI] [PubMed] [Google Scholar]
- 34.Scott RG, Wiener CH, Paulson D. The benefit of moderate Alcohol Use on Mood and functional ability in later life: due to Beers or frequent cheers? Gerontologist. 2020;60(1):80–8. [DOI] [PubMed] [Google Scholar]
- 35.Aihara Y, Minai J, Aoyama A, Shimanouchi S. Depressive symptoms and past lifestyle among Japanese elderly people. Commun Ment Health J. 2011;47(2):186–93. [DOI] [PubMed] [Google Scholar]
- 36.Burnette CE, Roh S, Lee KH, Lee YS, Newland LA, Jun JS. A comparison of risk and protective factors related to depressive symptoms among American Indian and caucasian older adults. Health Soc Work. 2017;42(1):e15–23. [DOI] [PubMed] [Google Scholar]
Associated Data
This section collects any data citations, data availability statements, or supplementary materials included in this article.
Data Availability Statement
The National Health and Nutrition Examination Survey (NHANES). (https://www.cdc.gov/nchs/nhanes/index.htm) provided the data for this investigation.