Abstract
Objectives: The study has as main objective the evaluation of the potential roles of vitamin D, the neutrophil to lymphocyte ratio (NLR), and the systemic inflammation index (SII) as future biomarkers regarding the classification of flares in systemic lupus erythematosus (SLE). Material and Methods: Individuals diagnosed with SLE were encompassed in this observational study. The current applicable criteria, namely The European Alliance of Associations for Rheumatology (EULAR)/American College of Rheumatology (ACR) 2019 criteria had to be fulfilled. The participants underwent specific musculoskeletal examination, paraclinical investigations including complete blood count (CBC), determination of serum creatinine levels, as well as liver enzymes, and also the markers of inflammation. The fractions of the serum complement (C3 and C4) were also evaluated, together with serum vitamin D concentrations. Safety of Estrogens in Lupus National Assessment-Systemic Lupus Erythematosus Disease Activity Index (SELENA-SLEDAI) was required in order to analyze the research group’s disease activity. Results: NLR and SII demonstrated validity, having statistically significant correlations with SELENA-SLEDAI (p value less than 0.001). The ROC analysis proved a strong discriminative power for NLR (AUC=0.96) and SII (AUC=0.963) in predicting severe disease flares. Optimal cut-off values were 3.45 for NLR and 877,002.19 for SII. Serum vitamin D concentrations had a weak association with the SLEDAI score (p=0.048, r=0.213). Conclusions: NLR and SII can be considered reliable biomarkers for discriminating between the levels of disease activity in SLE individuals. Low serum levels of vitamin D may also influence disease severity, but require further validation
Keywords: NLR , SII , vitamin D , disease activity score
Introduction
Systemic lupus erythematosus (SLE) can be considered an immune-mediated illness defined by the abnormal antibodies synthesis directed against normal structures in the human body [1].
Patients may exhibit a range of clinical symptoms, with variations from joint and cutaneous involvement to more severe manifestations such end stage kidney disease, hematological dysregulation and central nervous system involvement which can be life-threatening [2, 3].
Furthermore, patients with SLE may present with a limited number of clinical characteristics, which can resemble other autoimmune, infectious, or hematologic diseases, thus adding complexity to the diagnostic process [4, 5].
In many connective tissue diseases, inflammation is considered the central pathogenic which leads to increased mortality and disability. The complete blood count (CBC) is an efficient and also cost-effective blood test frequently used to monitor potential variations in disease status and treatment-induced adverse events [6].
Systemic inflammation is associated with alterations in the circulating blood cells. Multiple combinations of subparameters of the blood count have been examined as indicators of a cellular immunological inflammatory process.
New emerging indicators like the neutrophil to lymphocyte (NLR) and platelet to lymphocyte ratios (PLR) are nowadays considered indicators of inflammation. Also, another biomarker which has proven a pivotal role as a marker of the inflammatory cascade is the the systemic immune inflammation index (SII) [7].
Alongside genetic and environmental factors, abnormalities in cytokines initiate the inflammatory cascade, which impacts the process of hematopoiesis. The chronic inflammatory process can lead to neutrophilia and/or low lymphocyte count, as it results in a faster depletion of white blood cells than their production rate [8, 9].
NLR is computed using absolute counts. This ratio has been utilized as an indicator of inflammation in different diseases, including connective tissue disorders, cardiovascular disease, and cancers [10, 11].
Decreased vitamin D concentrations are commonly observed in lupus patients. This deficiency in vitamin D could have a substantial impact on determining not only the severity, but also the activity of the disease [12].
Research indicates that hypovitaminosis D is correlated with increased disease activity scores and may exacerbate the immune dysregulation inherent in SLE [13].
Due to this fact, constant monitoring and early correction of vitamin D plasmatic concentration could have a role in managing disease progression and mitigating flare-ups. As such, routine determination of vitamin D levels is recommended in SLE to better identify the deficiencies that may need supplementation or other therapeutic methods [14].
The present research aims to define the implication of vitamin D, NLR and SII in systemic lupus erythematosus and the connections of these potential indicators with disease activity scores.
Materials and Methods
Patients
Patients classified as having systemic lupus erythematosus in accordance with the European Alliance of Associations for Rheumatology (EULAR)/American College of Rheumatology (ACR) 2019 criteria who were hospitalized between October 2023-December 2023 in the Department of Rheumatology of the Emergency Clinical County Hospital of Craiova were included in the research.
The inclusion requirements included age over 18 years and certain diagnosis of lupus in line with the current applicable criteria. The main exclusion criteria consisted of the presence of other autoimmune disorders or of an overlap syndrome, end stage liver of kidney disease, pregnancy, breast-feeding and malignant diseases.
Informed consent was mandatory in order to participate in the study. Also, approval from the Ethics Committee of the University of Medicine and Pharmacy of Craiova was obtained.
Demographic Features, Assessment of Clinical and Laboratory Findings
All participants enrolled in the study group underwent a detailed history taking, with an emphasis on age, gender, and presenting symptoms, as well as disease history, a complete clinical examination and blood tests.
We evaluated the complete blood count of the patients with normal hemoglobin values of 11.7-15.5g/dL, leukocyte values of 4000-10000/µL, neutrophils between 2000-8000/µL, lymphocyte normal values between 1000-4000/µL, while thrombocyte levels were considered normal within the 150000-450000/µL range. Also, erythrocyte sedimentation rate (ESR) with normal range between 2-12mm/h was determined.
Moreover, liver enzymes, serum creatinine, C3 levels with reference values of 90-180 mg/dl and C4 levels (10-40mg/dl) were assessed. Serum levels of 25-hydroxy (OH) vitamin D were determined.
Values ≤20ng/ml were noted as deficient while levels between 20-30ng/ml were considered insufficient. Also, positivity for anti-DNAds, anti-Smith, anti-SS-A, anti-ribosomal P protein, anti-SS-B, and anti-nucleosome antibodies was tested.
Disease activity was quantified in patients through the calculation of the Safety of Estrogens in Lupus National Assessment-Systemic Lupus Erythematosus Disease Activity Index (SELENA-SLEDAI) with values of less or equal to 3-no flare, >3-12-mild or moderate flare and equal or more than 12-severe flare.
NLR was calculated using the following formula:
NLR=(neutrophil count)/(lymphocyte count).
The subsequent formula was applied to compute the systemic immune inflammation index:
SII=(neutrophil count X platelet count)/(lymphocyte count).
Statistical Analysis
Interpretation of the dataset was conducted with GraphPad PRISM v10.3.1.
The relationships between variables were assessed with a paired t-test and correlations were analyzed with Pearson’s or Spearman’s coefficients as appropriate. For the Receiver
Operating Characteristic (ROC) analysis, the performance of the NLR and SII to predict severe disease flares was assessed.
ROC curves were determined for both markers, and the area under the curve (AUC) was calculated to evaluate their discriminative power.
Also, the ideal threshold values for each of the markers were evaluated.
Sensitivity, specificity, and 95% confidence intervals (CI) were described for each marker to provide a comprehensive assessment of their diagnostic performance.
P values beneath 0.05 were identified as statistically relevant.
Results
Overview of the study group
The research involved 87 individuals diagnosed with SLE. Participants’ demographic, clinical, and paraclinical attributes are illustrated in Table 1.
Table 1.
Characteristics of the SLE cases
|
Characteristics | |
|
Sex (females) (n, %) |
81 (93.13%) |
|
Age (years) (Mean±SD) |
43.90±12.87 |
|
Disease duration (years) (Mean±SD) |
9.61±3.91 |
|
C3 (mg/dL) (Mean±SD) |
94.69±23.41 |
|
C4 (mg/dL) (Mean±SD) |
16.49±8.49 |
|
Leukocytes (x103/µL) |
5.490±1.910 |
|
Lymphocytes (x103/µL) |
1.591±0.707 |
|
Neutrophils (x103/µL) |
3.818±1.381 |
|
Platelets (x103/µL) |
246.413±118.145 |
|
Vitamin D (ng/mL) |
20.57±5.06 |
|
NLR |
3.57±1.17 |
|
SII (x103/µL) |
1177.146±480.009 |
|
SELENA-SLEDAI (Mean±SD) |
12.38±4.71 |
|
Manifestations (n, %) | |
|
Cutaneous |
63 (72.41%) |
|
Articular |
36 (41.37%) |
|
Renal |
11 (12.64%) |
|
Hematological |
11 (12.64%) |
|
Serositis |
3 (3.44%) |
|
Neurological |
2 (2.29%) |
|
Treatment (n, %) | |
|
Hydroxychloroquine |
87 (100%) |
|
Azathioprine |
12 (13.79%) |
|
Mycophenolate Mofetil |
13 (14.94%) |
|
Cyclophosphamide |
2 (2.29%) |
|
Glucocorticoids | |
|
<5 mg daily |
11 (12.64%) |
|
5-10 mg daily |
44 (50.57%) |
|
10-15 mg daily |
32 (36.78%) |
Antibody positivity is described in Table 2
Table 2.
Antibody detection in the study group
|
Antibody |
SLE (n=87) |
|
Anti-DNAds (n, %) |
44 (50.57%) |
|
Anti-Smith (n, %) |
11 (12.64%) |
|
Anti-Ro (n, %) |
8 (9.19%) |
|
Anti-La (n, %) |
0 (0%) |
|
Anti-ribosomal P protein (n, %) |
7 (8.04%) |
|
Anti-nucleosome (n, %) |
17 (19.54%) |
According to SELENA-SLEDAI, 51.72% of patients had a mild or moderate flare, while 48.28% had a severe flare. 42.52 % of patients had low C3 levels, while 18.39 % had low C4 levels. Vitamin D levels were deficient in 50.57% of patients, while insufficiency was encountered in 49.43% of patients.
Associations between parameters
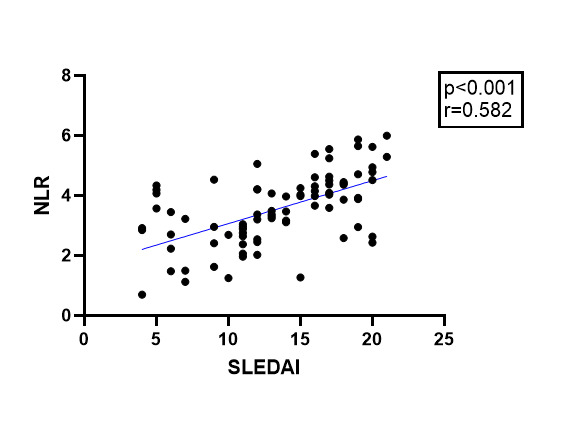
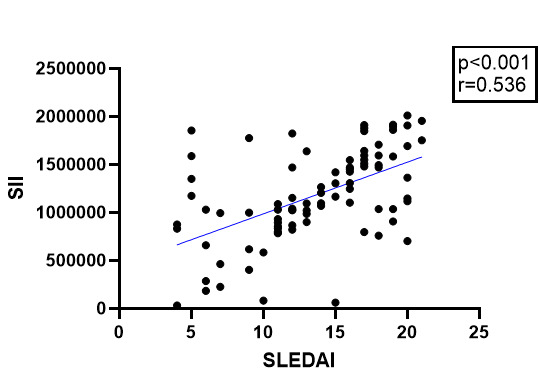
A significant association was identified regarding NLR and SELENA-SLEDAI with a p value<0.001 and r=0.582, as well as between SII and SELENA-SLEDAI (p<0.001, r=0.559) (Figure 1, 2).
Figure 1.

Association between NLR and SLEDAI
Figure 2.

Association between SII and SLEDAI
Nevertheless, plasmatic levels of complement C3 with a p value of 0.756 (r=0.034), C4 (p=0.827, r=-0.024) showed no correlation with SII. Also, there was no association noted between serum C3 with a p value equal to 0.992 (r=-0.001), C4 with a p value of 0.682 (r=-0.044) and NLR.
Vitamin D levels exhibited a weak yet statistically relevant association with the disease score (p=0.048, r=0.213). Also, a weak correlation of vitamin D concentrations and NLR (p=0.165, r=0.150) and SII with a p value of 0.097 (r=0.179) was noted, but it was not significant from a statistical point of view.
ROC analysis
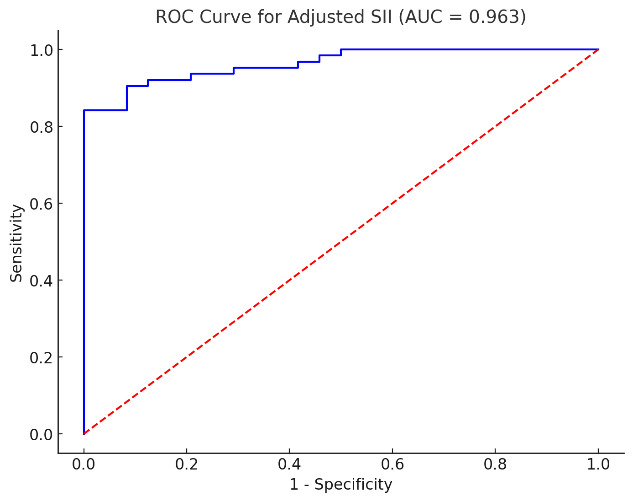
The ROC analysis for SII in predicting severe disease activity showed a strong discriminative ability between mild/moderate and severe disease activity. The AUC for SII was 0.963, indicating excellent performance in classifying patients with severe disease. The optimal cut-off value for SII was 877,002.19. Taking into account this cut-off, the sensitivity was 93.7% with a 95% confidence interval (CI) of approximately 88.0% to 99.4%, and the specificity was 70.8% with a 95% CI of around 60.0% to 81.6%.
Figure 3.

ROC analysis for the assessment of the performance of SII in discriminating disease activity using SELENA-SLEDAI
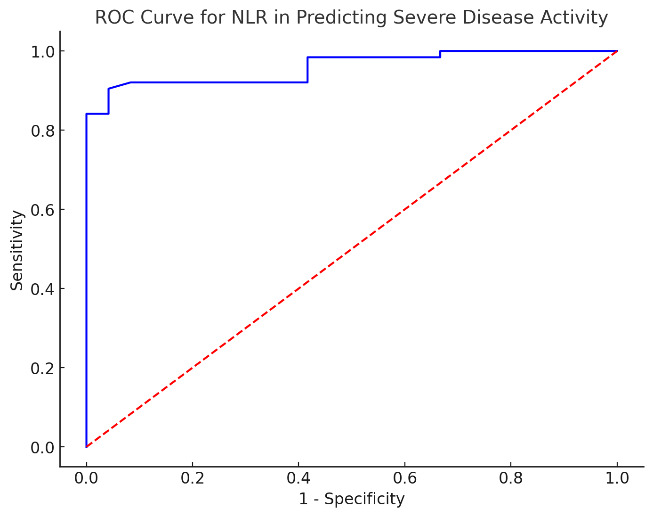
The ROC analysis for NLR in predicting severe disease activity showed a strong performance in discriminating between mild/moderate and severe flares. The AUC for NLR was 0.96, thus proving an excellent capacity to classify patients with severe disease activity (SLENA-SLEDAI). The determined threshold value for NLR was 3.45. Taking into account this cut-off point, the sensitivity was determined at 88.7% with a 95% CI of 82.3% to 95.1%. The specificity, with a 95% CI of around 88.5% to 99.7%, was of 94.1%.
Figure 4.

ROC analysis for the assessment of the performance of NLR in discriminating disease activity using SELENA-SLEDAI
Discussion
Our study’s objectives to evaluate the efficiency of vitamin D, NLR, and SII as prospective indicators for disease activity in lupus. We demonstrated that both NLR and SII levels had statistically significant associations with SELENA-SLEDAI, indicating their potential applicability in reflecting disease flares.
Additionally, the study revealed that vitamin D levels had a weak correlation with the disease activity score.
However, our research had a number limitations such as a comparatively small patient group and the fact that participants originated from one single center. Additionally, the study's reliance on specific clinical and laboratory parameters from a single clinic setting may not reflect variations in practice that occur in different geographic or clinical environments.
In an observational study by Ruiz-Irastorza which included 80 patients with SLE oral vitamin D3 supplementation was recommended for patients exhibiting low baseline vitamin D concentrations. The conclusions of this study highlight the potential benefit of vitamin D intake in minimizing fatigue among individuals with SLE, particularly those who initially had low vitamin D levels. However, it's noteworthy that despite supplementation, a majority of patients did not reach the desired vitamin D threshold, indicating a possible inadequacy in the supplementation dosage or adherence issues.
Additionally, the lack of significant associations between fluctuations in vitamin D concentrations and in both SLE disease activity and irreversible organ dysfunction (as evaluated through SLEDAI and SDI, respectively) suggests that while vitamin D may alleviate some symptoms like fatigue, it may not directly influence the overall disease progression or prevent organ involvement in SLE patients, findings consistent with the conclusions of our study [15].
A study by Abdalhadi et al included 160 participants categorized into two groups: individuals diagnosed with SLE and healthy participants matched for age and sex as controls.
Comparisons regarding PLR, NLR, and disease activity scores using SLEDAI were performed. Results showed that NLR and PLR had noticeably greater values within the lupus group as opposed to the healthy control group, and both ratios were significantly associated to SLEDAI scores, in concordance with the conclusions of our study [16].
A retrospective study was performed by Qin et al. and included two groups: one with 154 patients diagnosed with SLE and a group composed of 151 healthy individuals as controls.
The research proved that the SLE group had increased levels of NLR, PLR, and MPV. NLR exhibited a significant correlation not only with CRP levels (p values less than 0.01) and ESR with a p value <0.01, but also SLEDAI scores (p<0.01). NLR levels of 2.065 were identified as an optimal threshold for SLE with 74.7% sensitivity and 77.5% specificity. Notably, the area under the curve was determined at 0.828, findings consistent with our study [17].
In 2020, Wang et al conducted a meta-analysis which included fourteen studies with an overall number of 1,781 lupus patients and 1,330 unaffected individuals. The results indicated that NLR was considerably elevated in the SLE cohort in comparison with the controls. Also, the same results were identified in the SLE individuals with active disease as opposed to those with inactive disease and in the individuals with lupus nephritis when compared to those who did not have nephritis [18].
A retrospective comparison was made by Ozdemir et al between a group of 76 patients with SLE and a control group consisting of 76 individuals adjusted for age and gender. The study focused on SII, NLR and PLR. Results indicated that the SLE group had higher SII in comparison with the healthy individuals.
Nevertheless, SII’s predictive power for lupus (AUC=0.626) was weaker compared to NLR with an area under curve of 0.723 and also compared to PLR with an AUC of 0.666. SII has a positive correlation with the C-reactive protein (p value of 0.01), but not with SLEDAI-2K scores [19].
In a case-control observational study by Akdogan et al., 68 SLE cases and 69 healthy individuals with similar demographics were included. The authors showed that inflammatory marker levels (ESR and CRP), but also NLR, PLR, and SII were significantly more elevated in the lupus group when compared to the healthy individuals (p<0.000). The disease activity score determined using SLEDAI presented statistically significant correlations with not only NLR and PLR, but also SII. A cut-off value for SII of 681.3 was established, with sensitivity of 77% and specificity of 76% in distinguishing between no/mild and moderate/high lupus disease scores (p<0.000, AUC=0.930), findings consistent with our study [20, 21].
The study by Wu et al. included 116 untreated SLE cases and 136 healthy individuals as control group. The findings indicated that both NLR and PLR had been significantly more elevated in the lupus group in comparison with the controls (p<0.001). SLEDAI scores revealed a positive correlation with not only NLR, but also PLR with p values less than 0.001. Moreover, cases with lupus nephritis presented higher NLR than those without renal involvement (p=0.027). The ROC analysis determined the optimal threshold of NLR the prediction of severe disease activity to be 2.26, with a sensitivity of 75% and specificity of 50%, in concordance with the findings of our study [22, 23, 24].
Conclusion
The study concluded that NLR and SII are valuable biomarkers for tracking disease activity scores in systemic lupus erythematosus, as both demonstrated significant correlations with disease activity.
Vitamin D levels did show a significant weak correlation with disease activity, suggesting that while low vitamin D levels are a concern in SLE, they may not reflect disease severity directly.
These findings support the potential integration of NLR and SII in routine clinical assessments to better understand and manage SLE.
Further multi-center and longitudinal are needed in order to validate these biomarkers and to explore the underlying mechanisms linking them to SLE pathophysiology.
Conflict of interests
The authors have no conflict of interest to declare.
References
- 1.Kiriakidou M, Ching CL. Systemic Lupus Erythematosus. Ann Intern Med. 2020;172(11):ITC81–96. doi: 10.7326/AITC202006020. [DOI] [PubMed] [Google Scholar]
- 2.Rivas-Larrauri F, Yamazaki-Nakashimada MA. Systemic lupus erythematosus: Is it one disease. Reumatol Clin. 2016;12(5):274–281. doi: 10.1016/j.reuma.2016.01.005. [DOI] [PubMed] [Google Scholar]
- 3.Fortuna G, Brennan MT. Systemic lupus erythematosus: epidemiology, pathophysiology, manifestations, and management. Dent Clin North Am. 2013;57(4):631–655. doi: 10.1016/j.cden.2013.06.003. [DOI] [PubMed] [Google Scholar]
- 4.Zucchi D, Silvagni E, Elefante E, Signorini V, Cardelli C, Trentin F. Systemic lupus erythematosus: one year in review 2023. Clin Exp Rheumatol. 2023;41(5):997–1008. doi: 10.55563/clinexprheumatol/4uc7e8. [DOI] [PubMed] [Google Scholar]
- 5.Zucchi D, Elefante E, Schilirò D, Signorini V, Trentin F, Bortoluzzi A, Tani C. One year in review 2022: systemic lupus erythematosus. Clin Exp Rheumatol. 2022;40(1):4–14. doi: 10.55563/clinexprheumatol/nolysy. [DOI] [PubMed] [Google Scholar]
- 6.Nurbaeva K, Reshetnyak T, Cheldieva F, Cherkasova M, Samarkina E, Lila A. Ab0116 New Inflammatory Markers in Systemic Lupus Erythematosus and Antiphospholipid Syndrome. Annals of the Rheumatic Diseases. 2022;81(Suppl 1):1188–1189. [Google Scholar]
- 7.Mercader-Salvans J, García-González M, Quevedo-Abeledo JC, Quevedo-Rodríguez A, Romo-Cordero A, Ojeda-Bruno S, Gómez-Bernal F, López-Mejías R, Martín-González C, González-Gay MÁ, Ferraz-Amaro I. Blood Composite Scores in Patients with Systemic Lupus Erythematosus. Biomedicines. 2023;11(10):2782–2782. doi: 10.3390/biomedicines11102782. [DOI] [PMC free article] [PubMed] [Google Scholar]
- 8.Zahorec R. Neutrophil-to-lymphocyte ratio, past, present and future perspectives. Bratisl Lek Listy. 2021;122(7):474–488. doi: 10.4149/BLL_2021_078. [DOI] [PubMed] [Google Scholar]
- 9.Aringer M. Inflammatory markers in systemic lupus erythematosus. J Autoimmun. 2020;110:102374–102374. doi: 10.1016/j.jaut.2019.102374. [DOI] [PubMed] [Google Scholar]
- 10.Liu CC, Ko HJ, Liu WS, Hung CL, Hu KC, Yu LY, Shih SC. Neutrophil-to-lymphocyte ratio as a predictive marker of metabolic syndrome. Medicine. 2019;98(43):e17537–e17537. doi: 10.1097/MD.0000000000017537. [DOI] [PMC free article] [PubMed] [Google Scholar]
- 11.Mosca M, Nigro MC, Pagani R, De Giglio, Di Federico. Neutrophil-to-Lymphocyte Ratio (NLR) in NSCLC, Gastrointestinal, and Other Solid Tumors: Immunotherapy and Beyond. Biomolecules. 2023;13(12):1803–1803. doi: 10.3390/biom13121803. [DOI] [PMC free article] [PubMed] [Google Scholar]
- 12.Athanassiou L, Kostoglou-Athanassiou I, Tsakiridis P, Devetzi E, Mavroudi M, Fytas P, Koutsilieris M, Athanassiou P. Vitamin D levels in Greek patients with systemic lupus erythematosus. Lupus. 2022;31(1):125–132. doi: 10.1177/09612033211066462. [DOI] [PubMed] [Google Scholar]
- 13.Kamen DL, Cooper GS, Bouali H, Shaftman SR, Hollis BW, Gilkeson GS. Vitamin D deficiency in systemic lupus erythematosus. Autoimmunity Reviews. 2006;5(2):114–117. doi: 10.1016/j.autrev.2005.05.009. [DOI] [PubMed] [Google Scholar]
- 14.Islam MdA, Khandker SS, Alam SS, Kotyla P, Hassan R. Vitamin D status in patients with systemic lupus erythematosus (SLE): A systematic review and meta-analysis. Autoimmunity Reviews. 2019;18(11):102392–102392. doi: 10.1016/j.autrev.2019.102392. [DOI] [PubMed] [Google Scholar]
- 15.Ruiz-Irastorza G, Gordo S, Olivares N, Egurbide MV, Aguirre C. Changes in vitamin D levels in patients with systemic lupus erythematosus: Effects on fatigue, disease activity, and damage. Arthritis Care Res (Hoboken) 2010;62(8):1160–1165. doi: 10.1002/acr.20186. [DOI] [PubMed] [Google Scholar]
- 16.Abdalhadi S, Khalayli N, Al-Ghotani B, Kudsi M. Systemic lupus erythematosus disease activity and neutrophil-to-lymphocyte ratio and platelet-to-lymphocyte ratio: a cross-sectional case-control study. Ann Med Surg (Lond) 2023;85(5):1448–1453. doi: 10.1097/MS9.0000000000000477. [DOI] [PMC free article] [PubMed] [Google Scholar]
- 17.Qin B, Ma N, Tang Q, Wei T, Yang M, Fu H, Hu Z, Liang Y, Yang Z, Zhong R. Neutrophil to lymphocyte ratio (NLR) and platelet to lymphocyte ratio (PLR) were useful markers in assessment of inflammatory response and disease activity in SLE patients. Mod Rheumatol. 2016;26(3):372–376. doi: 10.3109/14397595.2015.1091136. [DOI] [PubMed] [Google Scholar]
- 18.Wang L, Wang C, Jia X, Yang M, Yu J. Relationship between Neutrophil-to-Lymphocyte Ratio and Systemic Lupus Erythematosus: A Meta-analysis. Clinics (Sao Paulo) 2020;75:e1450–e1450. doi: 10.6061/clinics/2020/e1450. [DOI] [PMC free article] [PubMed] [Google Scholar]
- 19.Ozdemir A, Baran E, Kutu M, Celik S, Yılmaz M. Could systemic immune inflammation index be a new parameter for diagnosis and disease activity assessment in systemic lupus erythematosus. Int Urol Nephrol. 2023;55(1):211–216. doi: 10.1007/s11255-022-03320-3. [DOI] [PubMed] [Google Scholar]
- 20.Akdogan MR, Melikoglu MA. A potential biomarker of disease activity in systemic lupus erythematosus, systemic immune-inflammation index. North Clin Istanb. 2024;11(2):115–119. doi: 10.14744/nci.2023.90132. [DOI] [PMC free article] [PubMed] [Google Scholar]
- 21.Griffiths B, Mosca M, Gordon C. Assessment of patients with systemic lupus erythematosus and the use of lupus disease activity indices. Best Pract Res Clin Rheumatol. 2005;19(5):685–708. doi: 10.1016/j.berh.2005.03.010. [DOI] [PubMed] [Google Scholar]
- 22.Wu Y, Chen Y, Yang X, Chen L, Yang Y. Neutrophil-to-lymphocyte ratio (NLR) and platelet-to-lymphocyte ratio (PLR) were associated with disease activity in patients with systemic lupus erythematosus. International Immunopharmacology. 2016;36:94–99. doi: 10.1016/j.intimp.2016.04.006. [DOI] [PubMed] [Google Scholar]
- 23.Illei GG, Tackey E, Lapteva L, Lipsky PE. Biomarkers in systemic lupus erythematosus. I. General overview of biomarkers and their applicability. Arthritis Rheum. 2004;50(6):1709–1720. doi: 10.1002/art.20344. [DOI] [PubMed] [Google Scholar]
- 24.Rezaieyazdi Z, Sahebari M, Hatef MR, Abbasi B, Rafatpanah H, Afshari JT, Esmaily H. Is there any correlation between high sensitive CRP and disease activity in systemic lupus erythematosus. Lupus. 2011;20(14):1494–500. doi: 10.1177/0961203311418706. [DOI] [PubMed] [Google Scholar]


