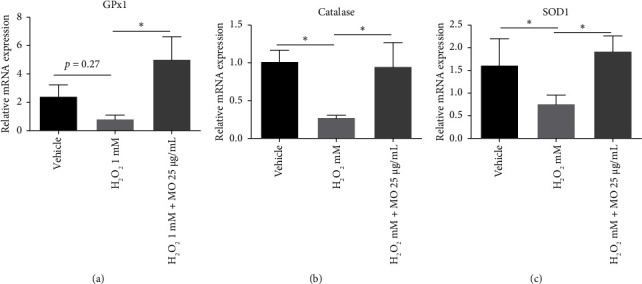
Figure 3.

The effects of Moringa oleifera (MO) extract on the mRNA expressions of GPx1 (a), catalase (b), and SOD1 (c). Each bar represents the mean relative mRNA expression ± SEM of four samples. Data analysis was performed using one way ANOVA, followed by Tukey's multicomparison test. ns: not significant, ∗: p < 0.05.
