

Keywords: body size, environment, marine ecosystems, parasites, Protonibea diacanthus, season
Abstract
The functioning and richness of marine systems (and biological interactions such as parasitism) are continuously influenced by a changing environment. Using hierarchical modelling of species communities (HMSC), the presence and abundance of multiple parasite species of the black-spotted croaker, Protonibea diacanthus (Sciaenidae), was modelled against environmental measures reflecting seasonal change. Protonibea diacanthus were collected in three seasons across 2019–2021 from four locations within the waters of the Northern Territory, Australia. The length of P. diacanthus proved to have a strong positive effect on the abundance of parasite taxa and overall parasitic assemblage of the sciaenid host. This finding introduces potential implications for parasitism in the future as fish body size responds to fishing pressure and climate changes. Of the various environmental factors measured during the tropical seasons of northern Australia, water temperature and salinity changes were shown as potential causal factors for the variance in parasite presence and abundance, with changes most influential on external parasitic organisms. As environmental factors like ocean temperature and salinity directly affect parasite–host relationships, this study suggests that parasite assemblages and the ecological functions that they perform are likely to change considerably over the coming decades in response to climate change and its proceeding effects.
Introduction
Fish distribution, behaviour and physiology are all affected by climatic and environmental factors, as well as biological interactions including predation and parasitism. With the increasing unpredictability of marine ecosystem functioning in evolving environmental conditions, there is a growing need to develop an understanding of the environmental impacts on both fish and their parasite communities (Lõhmus and Björklund, 2015; Poloczanska et al., 2016; Esbaugh, 2018). Parasitic organisms that exploit marine hosts are likely to be impacted by a changing climate, both directly through the changing ambient habitat, and indirectly via effects on their hosts (Lõhmus and Björklund, 2015). Many parasites require intermediate host(s) to complete their life cycle, which means that impacts may be cumulative along the life cycle (Lafferty, 2012). Parasites with life cycles that utilize free-swimming larval stages are reliant on both host availability and suitable environmental conditions for development and survival (Poulin and Leung, 2011; Lehun et al., 2023).
Although the environmental implications of a changing climate on marine parasites and their fish hosts are numerous, the reactions of parasites to habitat variability are not straightforward. Holmes (1990) presented a summary of the determinants of helminth community structure in marine fishes, highlighting the interactions between various biotic (fish diet and physiology) and abiotic (environmental) factors. Parasite infection rates may increase in response to minor rises in ocean temperature (Macnab and Barber, 2012; Neubert et al., 2016; Klimpel et al., 2019; Byers, 2021), whereas for other parasite taxa, infection rates decline with increasing temperature (Byers, 2021). Although difficult to predict, parasite ecology is likely to change considerably in response to climate change and its proceeding effects, and if climate impacts continue to influence marine ecosystem processes, some parasites will face suboptimal transmission conditions and/or may soon have fewer hosts available as a result of host thermal preference and host behavioural changes (Klimpel et al., 2019; Reynolds et al., 2019; Byers, 2021).
In addition to the short-term seasonal changes experienced in tropical and subtropical marine regions like northern Australia, substantial long-term environmental changes and ocean responses are expected as a result of climate change (Koenigstein et al., 2016). Climate models predict further warming, with ocean surfaces surrounding Australia warming at a rate less than the global average (CSIRO and Bureau of Meteorology, 2023c). Predictions also include increased stratification and acidification, stronger poleward currents, sea level rise and altered storm and rainfall regimes (Hobday et al., 2006; Poloczanska et al., 2007, 2016; Bindoff et al., 2019; Gervais et al., 2021). Heavy rainfall events in Australia have increased in intensity (CSIRO and Bureau of Meteorology, 2023a), with regions surrounding the equator like the north of Australia generally experiencing wetter years (CSIRO and Bureau of Meteorology, 2023b). In addition to rainfall changes, the average sea-surface temperature of Australia has also increased by more than 1°C since 1900, including eight of the ten warmest years since 2010 (CSIRO and Bureau of Meteorology, 2023a).
Climate change studies predict that ocean warming will trigger a polar shift in the distribution of marine organisms, leading to decline in fish species richness in tropical waters, along with changes in sea-surface temperatures, salinity levels and the levels of dissolved oxygen (Barange and Perry, 2009; Bindoff et al., 2019; Yang et al., 2023). In addition to population movements, the physiology of several marine fish species has been strongly influenced by temperature-driven changes in recruitment and somatic growth, with overall reductions in size recorded in reproductively active stock (Sheridan and Bickford, 2011; Lindmark et al., 2022). The black-spotted croaker Protonibea diacanthus (Teleostei: Sciaenidae) is a large marine fish species of considerable value to recreational, traditional and commercial fishing sectors of northern Australia (Phelan et al., 2008; Saunders et al., 2021), and is one marine species likely to be impacted by ocean warming, with distribution shifts reported in several marine fish species (Jacups, 2010; Poloczanska et al., 2013; Zhang et al., 2019; Gervais et al., 2021). Protonibea diacanthus is distributed in the wet–dry tropics of northern Australia, occurring throughout the Indo-west Pacific region, including Papua New Guinea, and reaching from the Persian Gulf to Japan (Bray, 2022; Randall et al., 2023). Inhabiting the wet–dry tropics, P. diacanthus is often exposed to minor environmental changes as a result of the tropical weather conditions and seasonal changes, including changes to water quality, composition and movement. The monsoonal wet season in northern Australia brings significant rainfall over the months from December to March, typically resulting in elevated freshwater run-off from river systems into nearshore estuarine and coastal habitats. The combination of freshwater run-off, sediment mixing and tidal flows during the wet season often leads to significant changes in water temperature, salinity and chemical composition of coastal marine waters (Anderson et al., 2011). The dry season, typically between April and August, is a period of negligible rainfall and low run-off of freshwater into the environment. The transition period from dry to wet, referred to as the ‘build-up’ season, occurs between September and November, and is associated with rises in temperature and humidity, and increasing rainfall mainly from irregular, non-monsoonal storms (Porter et al., 2023b).
As natural components of ecological systems, parasitic organisms are expected to react to environmental changes and the subsequent behavioural changes, health impacts and movement patterns of their hosts (Byers, 2021). With previous studies highlighting the richness of parasite infection in P. diacanthus (Porter et al., 2023a, 2023b, 2023c), there is a need to understand the potential climate-induced pressures that this major parasite–host system may face. This study investigated the parasites occurring in P. diacanthus populations off the northern coast of Australia and modelled the presence and abundance of multiple parasite taxa relative to environmental variables. The results of this study are discussed with respect to the impacts of environmental change on parasites, and how these changes might manifest as patterns of parasite prevalence, abundance and diversity. In understanding how parasites respond to seasonal variability, this study aims to improve the capacity to predict how parasites (and their impacts on hosts) will respond to environmental variation in a changing climate.
Materials and methods
Fish and parasite collection
The fish and parasites included in this study are as described in Porter et al. (2023b). In brief, 176 P. diacanthus were collected from four coastal locations off the Northern Territory coast (Fig. 1). The fish were sampled from two nearshore locations in proximity to the mouths of the Daly River and the Mary River (Peron Islands and Sampan Creek, respectively), and two offshore locations of the Tiwi Islands (Caution Point and Mitchell Point). The sites chosen allowed comparison between nearshore and offshore sites, with nearshore locations receiving freshwater outflow in the wet season, and those offshore more reflective of oceanic conditions with no freshwater outflow nearby. Fish were captured at these sites during three seasonal sampling periods in 2019–2021 including: build-up (October–November 2019 and 2020), late-wet (February–March 2020 and 2021) and mid-dry (June–July 2019 and 2020), with monsoonal wet season rainfall occurring from December to March, and the negligible rainfall during the dry season between April and August. Parasites were collected from the gills and the gastrointestinal systems of each fish and identified to as low a taxonomic level as possible.
Figure 1.

Collection sites of Protonibea diacanthus from northern Australia. Map sourced from the Office of Research Services and Graduate Studies, Spatial Data Analysis Network (SPAN), Charles Sturt University, Wagga Wagga, Australia.
Environmental data
At the time of capture of fish, environmental data were collected at the water surface and at the depth of capture, which varied between 3 and 30 m, depending on the location: Sampan Creek 3‒8 m, Caution Point 10‒15 m, Peron Islands 15‒25 m and Mitchell Point 20‒30 m. Environmental variables measured were: dissolved oxygen, water temperature, salinity, ammonia, total dissolved nitrogen and total dissolved phosphorus. Given P. diacanthus is considered a demersal species (Bray, 2022), the measures of dissolved oxygen and water temperature from the lower part of the water column were used in the analyses. Ammonia, total dissolved nitrogen, and total dissolved phosphorus were examined as potential indicators of freshwater outflow at the sampling sites.
Data analysis
Summary statistics for the parasite and environmental data were compiled for each location by season of collection (Table 1). Due to low sample sizes, data across the two years were grouped by season of collection. For each of the parasite taxa, mean abundance (the total number of individuals of a particular parasite per sample divided by the total number of hosts examined, including uninfected hosts), and prevalence (the number of hosts infected with a particular parasite divided by the number of hosts examined, expressed as a percentage) were calculated (Bush et al., 1997). The mean values of each environmental variable were also calculated and compiled for each location by season of collection (Table 2).
Table 1.
Prevalence and mean abundance of parasites from Protonibea diacanthus, across seasons (Mid-dry, Build-up and Late-wet), and sites (Caution Point, Mitchell Point, Peron Islands, Sampan Creek)
| Mid-dry | Build-up | Late-wet | ||||||||||||||||||||||
|---|---|---|---|---|---|---|---|---|---|---|---|---|---|---|---|---|---|---|---|---|---|---|---|---|
| Caution Point | Mitchell Point | Peron Islands | Sampan Creek | Caution Point | Mitchell Point | Peron Islands | Sampan Creek | Caution Point | Mitchell Point | Peron Islands | Sampan Creek | |||||||||||||
| Number of fish | 19 | 10 | 17 | 18 | 7 | 10 | 10 | 20 | 16 | 20 | 20 | 9 | ||||||||||||
| Mean length (cm) | 98.6 | 98.5 | 108.3 | 112.6 | 84.9 | 101.0 | 108.7 | 112.4 | 107.8 | 92.8 | 85.1 | 123.6 | ||||||||||||
| Parasite taxa | P | AM | P | AM | P | AM | P | AM | P | AM | P | AM | P | AM | P | AM | P | AM | P | AM | P | AM | P | AM |
|
Copepoda Caligus sp. |
10.5 | 0.1 | 0.0 | 0.0 | 70.6 | 1.6 | 22.2 | 0.4 | 28.6 | 0.3 | 0.0 | 0.0 | 20.0 | 0.2 | 5.0 | 0.1 | 0.0 | 0.0 | 0.0 | 0.0 | 25.0 | 0.5 | 0.0 | 0.0 |
| Lernanthropus sp. | 78.9 | 2.1 | 100.0 | 6.7 | 52.9 | 2.9 | 83.3 | 3.9 | 71.4 | 3.1 | 100.0 | 5.7 | 100.0 | 4.2 | 95.0 | 12.9 | 93.8 | 7.9 | 70.0 | 2.6 | 90.0 | 2.6 | 100.0 | 8.4 |
|
Monogenea Diplectanum spp. |
100.0 | 834.1 | 100.0 | 1223.0 | 100.0 | 1204.2 | 100.0 | 1058.4 | 100.0 | 1262.7 | 100.0 | 2498.0 | 100.0 | 39.6 | 100.0 | 195.2 | 100.0 | 2658.8 | 100.0 | 829.0 | 100.0 | 544.0 | 100.0 | 3293.3 |
|
Nematoda Cucullanidae |
100.0 | 21.9 | 90.0 | 24.4 | 94.1 | 18.5 | 94.4 | 18.9 | 100.0 | 18.9 | 100.0 | 11.8 | 100.0 | 10.7 | 85.0 | 24.0 | 93.8 | 56.4 | 100.0 | 13.0 | 100.0 | 10.1 | 100.0 | 57.9 |
| Ascarididae | 5.3 | 0.1 | 0.0 | 0.0 | 0.0 | 0.0 | 27.8 | 0.4 | 0.0 | 0.0 | 0.0 | 0.0 | 10.0 | 0.2 | 15.0 | 0.3 | 0.0 | 0.0 | 0.0 | 0.0 | 0.0 | 0.0 | 0.0 | 0.0 |
| Other Nematodes | 26.3 | 0.3 | 10.0 | 0.1 | 23.5 | 0.4 | 11.1 | 0.1 | 0.0 | 0.0 | 10.0 | 0.3 | 10.0 | 0.1 | 20.0 | 0.3 | 0.0 | 0.0 | 0.0 | 0.0 | 10.0 | 0.3 | 0.0 | 0.0 |
|
Digenea Orientodiploproctodaeum sp. |
100.0 | 21.5 | 100.0 | 39.1 | 100.0 | 49.8 | 83.3 | 6.9 | 100.0 | 19.4 | 100.0 | 38.3 | 100.0 | 26.4 | 85.0 | 13.1 | 100.0 | 32.3 | 90.0 | 13.8 | 100.0 | 23.8 | 88.9 | 19.3 |
| Stephanostomum sp. | 89.5 | 14.8 | 100.0 | 33.3 | 82.4 | 8.2 | 88.9 | 30.1 | 100.0 | 12.9 | 100.0 | 21.0 | 70.0 | 4.9 | 85.0 | 10.2 | 81.3 | 30.9 | 85.0 | 11.3 | 65.0 | 3.4 | 100.0 | 57.0 |
| Pleorchis sp. | 10.5 | 0.1 | 80.0 | 5.3 | 5.9 | 0.1 | 0.0 | 0.0 | 0.0 | 0.0 | 30.0 | 0.4 | 0.0 | 0.0 | 0.0 | 0.0 | 12.5 | 0.3 | 25.0 | 0.5 | 10.0 | 0.2 | 0.0 | 0.0 |
| Hemiuridae | 0.0 | 0.0 | 0.0 | 0.0 | 17.6 | 0.5 | 16.7 | 0.2 | 14.3 | 0.1 | 0.0 | 0.0 | 0.0 | 0.0 | 0.0 | 0.0 | 6.3 | 0.2 | 10.0 | 0.2 | 30.0 | 0.5 | 11.1 | 0.8 |
| Opecoelidae | 5.3 | 0.1 | 0.0 | 0.0 | 35.3 | 0.8 | 27.8 | 0.4 | 0.0 | 0.0 | 10.0 | 0.2 | 0.0 | 0.0 | 5.0 | 0.1 | 0.0 | 0.0 | 0.0 | 0.0 | 25.0 | 0.6 | 0.0 | 0.0 |
Prevalence, expressed as a percentage, is the number of hosts infected with a particular parasite divided by the number of hosts examined. Mean Abundance is expressed as the total number of individuals of a particular parasite per sample divided by the total number of hosts examined, including uninfected hosts.
Table 2.
Mean values of environmental measures taken for seasons and sites
| Mid-dry | Build-up | Late-wet | ||||||||||
|---|---|---|---|---|---|---|---|---|---|---|---|---|
| Caution Point | Mitchell Point | Peron Islands | Sampan Creek | Caution Point | Mitchell Point | Peron Islands | Sampan Creek | Caution Point | Mitchell Point | Peron Islands | Sampan Creek | |
| Dissolved oxygen (mg L−1) | 6.4 | 6.2 | 6.5 | 6.8 | 7.5 | 7.8 | 5.6 | 6.0 | 6.0 | 6.0 | 5.8 | 6.6 |
| Water temperature (°C) | 26.3 | 26.9 | 23.8 | 25.0 | 29.9 | 29.6 | 31.2 | 30.9 | 29.9 | 29.9 | 30.6 | 30.2 |
| Salinity (from >2 m) | 35.4 | 36.0 | 35.5 | 35.4 | 35.1 | 35.1 | 36.2 | 36.7 | 34.6 | 35.2 | 32.6 | 29.6 |
| Ammonia | 0.5 | 0.5 | 1.1 | 0.6 | 1.0 | 0.3 | 2.2 | 0.2 | 0.3 | 0.8 | 1.6 | 0.2 |
| Total dissolved nitrogen | 4.4 | 10.2 | 10.2 | 6.5 | 13.1 | 5.6 | 5.5 | 4.4 | 7.1 | 10.2 | 9.6 | 11.0 |
| Total dissolved phosphorus | 0.3 | 0.3 | 0.3 | 0.4 | 0.3 | 0.4 | 0.2 | 0.3 | 0.3 | 0.4 | 0.5 | 0.7 |
For the statistical analysis, the data were analysed using a joint species distribution model called hierarchical modelling of species communities (HMSC; Ovaskainen et al., 2017; Ovaskainen and Abrego, 2020). The response data used in the model comprise the abundance of parasite taxa from the fish host. For the analyses, the individual fish were used as sampling units and the count of each of the 11 parasite taxa were used as the response variable. To account for zero-inflation for some of the parasite taxa, a hurdle model was applied, i.e. one model for presence–absence of the taxa, and another model for the abundance of taxa conditional on presence. Probit regression was applied in the presence–absence model, and linear regression for log transformed count data in the abundance conditional on presence model. The count data were transformed by declaring zeros as missing data, log-transforming, and then scaling the data to zero mean and unit variance within each taxa. Fish collection year and location were included as random effects, and fish collection season, fish length, fish sex and six environmental variables: dissolved oxygen, water temperature, salinity, ammonia, total dissolved nitrogen and total dissolved phosphorus, were included as fixed effects. As species traits, the categorical variable of internal or external parasites was also applied.
Both models were fitted using the HMSC package from R (Tikhonov et al., 2020) assuming the default prior distributions (Ovaskainen and Abrego, 2020). The posterior distribution was sampled using four Markov chain Monte Carlo (MCMC) chains. Each chain consisted of 37 500 iterations, of which 12 500 iterations were removed as burn-in and the remaining thinned by 100 to result in 250 posterior samples per chain, so there were 1000 posterior samples in total. The MCMC convergence diagnostics were examined through the potential scale reduction factors of the model parameters (Gelman and Rubin, 1992). Both the explanatory powers and the predictive powers were examined for each of the models, with measures of the species-specific AUC and Tjur's R2 (similar to R2, Tjur, 2009) examined for the presence–absence model (Pearce and Ferrier, 2000), and R2 measured for the abundance conditional on the presence model. To compute the explanatory power, model predictions were made based on the models being fitted to all of the data. The predictive power was computed by performing a five-fold cross validation, in which the sampling units were assigned randomly to five folds, and predictions for each fold were based on the model that was fitted to the data on the remaining four folds.
To quantify the drivers of parasite taxa richness and abundance, the explained variation was partitioned among the fixed and random effects included in the model. To examine associations between parasite taxa and environmental variables, parasite responses to the explanatory variables were measured, counting the proportion of parasites showing positive or negative associations with at least 95% posterior probability.
Results
All 176 fish were infected with at least one parasite and a total of 11 parasite taxa were identified from the gills and the gastrointestinal system for use in the analysis (Table 1). External parasites included copepods, Lernanthropus paracruciatus Boxshall, Bernot, Barton, Diggles, Yong, Atkinson-Coyle & Hutson, 2020 (see Boxshall et al., 2020) and Caligus sp., and two species of monogeneans, Diplectanum timorcanthus Porter, Barton, Francis & Shamsi, 2023 and Diplectanum diacanthi Porter, Barton, Francis & Shamsi, 2023 (see Porter et al., 2023a), combined as Diplectanum spp. due to the difficulty in distinction between the species at time of dissection. Of the internal parasites included in the analysis there were adult nematodes belonging to the families Cucullanidae and Ascarididae, and a further group of nematodes not yet identified but classified as ‘Other Nematodes’ given their similarities in morphological characteristics and general ecology. Adult digenean trematodes Orientodiploproctodaeum sp., Stephanostomum sp., Pleorchis sp., and representatives from the families Hemiuridae and Opecoelidae were also included.
The environmental variables differed between locations based on seasons (Table 2). The water temperature of the inshore locations of Peron Islands and Sampan Creek differed from that of the offshore locations, being lower in the mid-dry, but higher in the build-up and late-wet. Salinity at the inshore locations in the build-up was markedly lower in the late-wet season, indicating a freshwater influence at these sites. Levels of ammonia did not exhibit a clear seasonal pattern. Between seasons only, levels of nitrogen and phosphorus were higher in the late-wet season than in the mid-dry and build-up seasons.
The MCMC convergence diagnostics of the HMSC models were satisfactory, meaning that the models were adequately fitted to the data (Ovaskainen and Abrego, 2020). Namely, the potential scale reduction factors for the β-parameters were on average 1.002 (0.998‒1.013) for the presence–absence model and 1.002 (0.997‒1.009) for the abundance conditional on presence model. The presence–absence models showed a good fit to the data, the mean Tjur R2 (AUC) reported as 0.186 (0.861) for explanatory power, and 0.108 (0.693) predictive power. The abundance conditional on the presence model showed satisfactory model fit, with the mean R2 value being 0.407 for explanatory power and 0.095 for predictive power. Diplectanum spp. (prevalence 100%) and Cucullanidae (prevalence 96%), were present in (almost) all samples and therefore not considered informative for the presence–absence model.
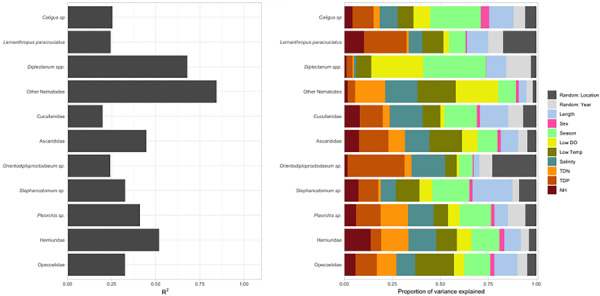
For the presence–absence model the explanatory power for each species was low (Fig. 2A), suggesting the variables use in the model only explain a small proportion of the variance and therefore the distribution of parasite taxa is more by random chance than by the environment. Variance partition over the explanatory variables included in the presence–absence model showed that the proportion of the fixed effects of water temperature and season explained between 20 and 40% of variance for most parasites, with salinity explaining the next highest proportion between 10 and 20% (Fig. 2B). The explanatory power of the abundance conditional on the presence model (Fig. 2C) showed that five parasite taxa explained greater than 40% of variance, with the Diplectanum spp. and ‘Other Nematodes’ explaining the highest proportions of over 60% of variance. Out of the explained variance for the abundance conditional on the presence model, the fixed effects that explained most of the variance included salinity, water temperature, length and season (Fig. 2D). Although still not recording the highest proportion of explained variance, the fixed effects of total dissolved nitrogen and total dissolved phosphorus were much more correlated with most parasite taxa in the abundance conditional on the presence model, when compared with the presence–absence model. For the abundance of external parasites, season explained the most variance for both Caligus sp. and Diplectanum spp. (Fig. 2D).
Figure 2.

(A) Plot of explanatory power for the presence–absence model highlighted through the Tjur R2 values of the parasite species, (B) plot of variance partition over the explanatory variables in the presence–absence model, showing the proportion of variance explained by both the random effects and the fixed effects for the parasite species, (C) plot of explanatory power of the abundance conditional on presence model highlighted through the R2 values of the parasite species, (D) plot of variance partition over the explanatory variables in the abundance conditional on presence model, showing the proportion of variance explained by both the random effects and the fixed effects for the parasite species. NB: Abbreviations for environmental variables have been used and include dissolved oxygen as (LowDO), water temperature as (LowTemp), ammonia as (NH), total dissolved nitrogen as (TDN) and total dissolved phosphorus as (TDP).
The beta plot of the presence–absence model showed L. paracruciatus and Caligus sp. to have a negative response to the late-wet season (Fig. 3A). In the beta plot of the presence–absence model, L. paracruciatus and the two most prevalent internal parasites (Orientodiploproctodaeum sp. and Stephanostomum sp.) showed increasing occurrence probability with increasing water temperature. Interestingly, all but Stephanostomum sp. had a negative association with salinity (Fig. 3A).
Figure 3.

(A) Beta plot of the species responses to the explanatory variables in the presence–absence model with at least 95% posterior probability, (B) Beta plot of the species responses to the explanatory variables in the abundance conditional on presence model with at least 95% posterior probability. NB: In 3A and 3B, the red and blue colours indicate those parasite taxa–environmental variable pairs with at least 0.95 support for either a positive or negative association, respectively. If there is no colour, the parasite taxa presence/absence or abundance conditional on presence is deemed to not have an association with the environmental variable, i.e. the taxa are neither positively nor negatively influenced by the environmental variable. Abbreviations of environmental variables are as those described in Fig. 2.
The beta plot of the abundance conditional on the presence model demonstrated that more than half of all parasite taxa are significantly more abundant as fish length increases (Fig. 3B). Diplectanum spp. abundance has a positive association with many environmental variables including both the mid-dry and the late-wet seasons (relative to the build-up season), dissolved oxygen and temperature, ammonia and total dissolved nitrogen (Fig. 3B). The abundance of both L. paracruciatus and Diplectanum spp. had a negative association with total dissolved phosphorus. In all, five parasite taxa were negatively associated with total dissolved phosphorus (Fig. 3B).
The presence–absence model predicts that parasite richness is positively correlated with fish length (Fig. 4A). Parasite species richness was relatively consistent as temperature changes, however, there was a drop in richness at temperatures between 27 and 28°C (Fig. 4B). This drop occurred at only the one location and season at which this temperature was recorded (Table 2), and when four parasite taxa were not present (Table 1). Species richness was highest when salinity levels were low, with a drop recorded when salinity exceeded 36‰ (Fig. 4C).
Figure 4.

Gradient plots of the relationships between: (A) Parasite species richness and fish length from all samples (cm), (B) Parasite species richness and water temperature (°C), (C) Parasite species richness and salinity. NB: Parasite species richness is a reflection of the number of different parasite species that are known to infect a particular host (or host population).
Discussion
The presence and abundance of parasites were significantly influenced by the body size of P. diacanthus, with the effect of body size on parasites proving the strongest factor across the seasons. Positive associations between body size and parasite presence and abundance have been reported in numerous previous studies and stock analyses of marine fishes (Thoney, 1993; Jerry et al., 2013; Welch et al., 2015; Barton et al., 2018; Taillebois et al., 2017; Taillebois et al., 2021; Kouadio et al., 2023). Studies confirm a general link between host size and parasite richness, however there is an obvious need to consider that this complex association is far from a simple linear relationship (Poulin et al., 2011). Host size corresponds closely to the size of habitat available to parasitic fauna and is also correlated with host life span, meaning that larger hosts offer a larger habitat patch and feature longer-lived habitats, therefore harbouring richer parasite faunas (Poulin and Morand, 2004; Poulin et al., 2011). This is justified with the marked increase in parasite species richness shown as the host size of P. diacanthus exceeds 100 cm. Food selection amongst fishes is potentially influenced by both temperature and body size (Coghlan et al., 2024), and as fish mature, changes in feeding modes and diet composition are common, with P. diacanthus for example known to transition from small invertebrates such as crabs and prawns, to larger prey items like fish (Barton, 2018). This dietary change would certainly influence the parasitic fauna of the fish host, and given this occurs as a result of maturation, can further support the association between fish host size and parasite species richness. Studies also suggest that greater abundances of parasites are found in offshore fish communities when compared with their juvenile counterparts nearshore, suggesting that certain parasites are in fact accumulated overtime, or that there is a potentially greater number of infected intermediate hosts offshore (Thoney, 1993).
Changes in body size of fish in response to ocean warming are often attributed to the temperature-size rule (TSR), with ectotherms reared at warmer temperatures developing faster but reaching smaller ultimate body sizes (Ohlberger, 2013; Lindmark et al., 2022). This finding has correlated with observations for several commercially exploited marine fish species (Olsen et al., 2004; Andersen et al., 2007; Baudron et al., 2014; Rijn et al., 2017; Ikpewe et al., 2021; Wootton et al., 2022), with negative size shifts impeding the maintenance and recovery of exploited marine fish populations whose larger individuals are typically the most fecund (Genner et al., 2010). Given that reductions in fish size have been observed as ecological responses to increasing ocean temperatures (Sheridan and Bickford, 2011; Audzijonyte et al., 2020), it appears likely that climate change will have significant impacts on associations between parasites and their hosts in the future. Considering the important role of parasites in marine food webs and ecosystem processes (Timi and Poulin, 2020; Porter et al., 2023b, 2023c), the results highlight the need to improve understanding of the secondary effects of climate change on host parasite dynamics, and the potential future implications to marine ecosystems (Byers, 2021).
To assess the potential effects of climate change on parasite communities, it is important to consider the broad marine ecosystem impacts and adaptations in host biology that also impact parasites. The present study demonstrates that environmental variables were strongly associated with parasite richness and abundance in P. diacanthus. The variance in parasite presence and abundance can be partially explained by seasonal changes in environmental conditions, which include water temperature, salinity levels, and nitrogen and phosphorus. The short-term seasonal environmental factors varied between locations and seasons in this study, with consistently warmer water temperatures and associated lower levels of dissolved oxygen during the late-wet season and at Peron Islands during the build-up season. Oxygenation stress has been reported to increase parasite prevalence and infection success in vulnerable hosts with effects seen in both fish metabolic function and physiology (Mikheev et al., 2014; Poloczanska et al., 2016; Byers, 2021; Samaras et al., 2023). Rising global temperatures lead to decreased oxygen solubility in water (Breitburg et al., 2018), and thus it is expected that the wet season of northern Australia will produce lower water oxygen levels in association with warmer ocean temperatures in the future. In addition to oxygen negatively covarying with temperature, oxygen declines in estuaries and nearshore marine ecosystems have also been caused by increased loadings of nutrients (Breitburg et al., 2018). Nutrient levels of nitrogen and phosphorus were highest at the nearshore sites during the late-wet season when these areas of northern Australia are often inundated with stormwater and run-off from river systems, floodplains and agricultural land (Przeslawski et al., 2011). The levels of phosphorus in this study are related to water column turbidity during seasonal outflows (Kämäri et al., 2020), and it is possible that climate change may bring more frequent, high levels of outflow. These run-off events and changes in water composition (including during tidal movements) cause critical disturbance to the ecosystem, influencing levels of energy and nutrients, and affecting the composition of benthic organisms (Anderson et al., 2011).
It is important to recognize that different parasite species respond differently to environmental changes, and as to whether parasite infections increase or decrease as a result of climate changes will often come down to the individual species at hand (Mackenzie, 1999). External parasites, such as the copepods and monogeneans from this study, exhibit very different morphological characteristics such as the nature of their tegument and their size, both of which are highly influential on the level of sensitivity that these organisms reflect when faced with the surrounding changes in factors like water temperature and salinity (Möller, 1978). The two most prevalent external parasites of this study, L. paracruciatus and Diplectanum spp., demonstrated a negative association with salinity. Lernanthropus paracruciatus was also significantly more likely to be present during warmer conditions, whereas Caligus sp. was more likely to be absent during the late-wet season when the water temperature was at its warmest. Caligus sp. did not show a significant association with salinity, indicating that the parasites may not be as influenced by changes in salinity as L. paracruciatus and Diplectanum spp. Previous studies have similarly described changes in external parasite abundance in warmer, saline conditions, with reduced presence at low salinities (Bricknell et al., 2006; Callaway et al., 2012; Byers, 2021).
The development and diversity of some parasite species depends on the presence of suitable intermediate hosts, in combination with other abiotic and biotic factors (Klimpel et al., 2019). Internal parasites, such as the digeneans and nematodes in the present study, may be buffered from direct environmental variation, but may be affected by the parasite's reliance on an earlier host (Neubert et al., 2016; Byers, 2021). Any environmental influence on the internal parasite–host system in the present study may not be reflective of seasonal cycles but instead of a ‘lag effect’ due to the indirect impacts on internal parasites or their dependence on intermediate hosts. For example, the significantly lower temperature during the preceding mid-dry season can affect parasite infectivity, longevity, and survival to transmission of free-living stages of internal parasites (Pietrock and Marcogliese, 2003; Lõhmus and Björklund, 2015) and may also lower the activity of both intermediate hosts (molluscs, small fishes and crustacea) and P. diacanthus (Lõhmus and Björklund, 2015). This can ultimately result in lower transmission of larval digeneans (whose capsule is often fragile and delicate) (Pietrock and Marcogliese, 2003) between hosts, or from vegetation, and therefore lower abundance of adult stages in P. diacanthus during the build-up. Thus, it is important for future research to understand whether changes in the dynamics of parasite assemblages' is a cumulative effect over many seasons or whether changes are truly reflective of what occurs in each individual season. On the temporal scale of global climate change, overall influences on the internal parasite–host systems may accumulate and present somewhat differently to the influences caused by short-term seasonal environmental variation.
This study has shown that seasonal environmental variation has an impact on the abundance and distribution of parasites. The effects of short-term seasonal environmental variation and fish host size, provides a window into the potential future of parasite–host systems when exposed to longer term climate variation. As ocean temperatures continue to warm and the impacts of climate change play out across broad-scale ecosystem processes, changes in trophic structure, energy flow and nutrient dynamics are to be expected. Given the varying ecology of parasitic organisms, individual responses to climate changes are difficult to predict. Nonetheless, positive correlations between P. diacanthus length and parasite assemblages – and the complex associations with environmental variables – suggest that fundamental shifts in parasite–host dynamics for marine fishes are likely under a changing climate.
Supporting information
Porter et al. supplementary material
Acknowledgements
We acknowledge the traditional owners of the land and sea country on which this research was conducted and pay our respects to elders past, present and emerging. Members of the Northern Territory Department of Industry, Tourism and Trade (NTDITT) provided practical support with sample collection. We thank Brendan Adair, Dion Wedd, Brien Roberts (Charles Darwin University), Chris Errity (NT Fisheries), Chris Naden (Streeter Fishing Charters) for their efforts in collecting and processing fish samples. We also thank the commercial fishers who contributed to the project by providing fishery knowledge, access to vessels and allowing project staff to sample their catch. Special thanks to Jon Hay, Mitch Campbell, and David Baumber. We also pay tribute to the life of Adam Collins who supported this project before his tragic death in 2019. We thank the reviewers of this manuscript.
Supplementary material
The supplementary material for this article can be found at https://doi.org/10.1017/S0031182024001008.
Data availability statement
All data produced for this study are provided in the manuscript.
Author contributions
M. P. executed this study and wrote the manuscript; all authors provided editorial advice. M. P., J. W., O. O., D. B. and J. R. designed the study, conducted field and laboratory work. M. P. and J. W. analysed the data.
Financial support
This project was supported by the Fisheries Research and Development Corporation (#2018-027) in collaboration with Charles Darwin University and Australian Institute of Marine Science. Megan Porter was supported by a Charles Sturt University AGRTP Scholarship. OO was funded by Academy of Finland (grant nos. 336212 and 345110), and the European Research Council under the European Union's Horizon 2020 research and innovation programme (grant agreement no. 856506; ERC-synergy project LIFEPLAN).
Competing interests
The authors declare there are no conflicts of interest.
Ethical standards
Ethics approval for this study was provided by The Charles Darwin University (CDU) Animal Ethics Committee (AEC), approval number #A19009.
References
- Andersen KH, Farnsworth KD, Thygesen UH and Beyer JE (2007) The evolutionary pressure from fishing on size at maturation of Baltic cod. Ecological Modelling 204, 246‒252. [Google Scholar]
- Anderson T, Nichol S, Radke L, Heap AD, Battershill C, Hughes M, Justy Siwabessy P, Barrie V, Alvarez de Glasby B, Tran M, Daniell J (2011) Seabed Environments of the Joseph Bonaparte Gulf, Northern Australia. Geoscience Australia: GA03525/Sol5117 – Post-Survey Report, Record 2011/08, p. 59. [Google Scholar]
- Audzijonyte A, Richards SA, Stuart-Smith RD, Pecl G, Edgar GJ, Barrett NS, Payne N and Blanchard JL (2020) Fish body sizes change with temperature but not all species shrink with warming. Nature Ecology & Evolution 4, 809‒814. [DOI] [PubMed] [Google Scholar]
- Barange M and Perry IR (2009) Physical and ecological impacts of climate change relevant to marine and inland capture fisheries and aquaculture. In Cochrane K, De Young C, Soto D and Bahri T (eds), Climate Change Implications for Fisheries and Aquaculture: Overview of Current Scientific Knowledge. FAO Fisheries and Aquaculture Technical Paper No. 530. Rome: FAO, pp. 7–106. [Google Scholar]
- Barton DP (2018) Notes on the diet of the black-spotted croaker (Protonibea diacanthus) across northern Australia. Northern Territory Nationalist 28, 61–69. [Google Scholar]
- Barton DP, Taillebois L, Taylor J, Crook DA, Saunders T, Hearnden M, Greig A, Welch DJ, Newman SJ, Travers MJ, Saunders RJ, Errity C, Maher S, Dudgeon C and Ovenden J (2018) Stock structure of Lethrinus laticaudis (Lethrinidae) across northern Australia determined using genetics, otolith microchemistry and parasite assemblage composition. Marine and Freshwater Research 69, 487‒501. [Google Scholar]
- Baudron AR, Needle CL, Rijnsdorp AD and Tara-Marshall C (2014) Warming temperatures and smaller body sizes: synchronous changes in growth of North Sea fishes. Global Change Biology 20, 1023‒1031. [DOI] [PubMed] [Google Scholar]
- Bindoff NL, Cheung WWL, Kairo JG, Arístegui J, Guinder VA, Hallberg R, Hilmi N, Jiao N, Karim MS, Levin L, O'Donoghue S, Purca Cuicapusa SR, Rinkevich B, Suga T, Tagliabue A, Williamson P (2019) Changing ocean, marine ecosystems, and dependent communities. In Pörtner HO, Roberts DC, Masson-Delmotte V, Zhai P, Tignor M, Poloczanska E, Mintenbeck K, Alegría A, Nicolai M, Okem A, Petzold J, Rama B and Weyer NM (eds), IPCC Special Report on the Ocean and Cryosphere in a Changing Climate. Geneva: Intergovernmental Panel on Climate Change, pp. 477‒587. [Google Scholar]
- Boxshall GA, Bernot JP, Barton DP, Diggles BK, Yong RQ-Y, Atkinson-Coyle T and Hudson KS (2020) Parasitic copepods of the family Lernanthropidae Kabata, 1979 (Copepoda: Siphonostomatoida) from Australian fishes, with descriptions of seven new species. Zootaxa 4736, 1–103. 10.11646/zootaxa.4736.1.1 [DOI] [PubMed] [Google Scholar]
- Bray DJ (ed.) (2022) Protonibea diacanthus in Fishes of Australia. Fishbase. [online]: World Wide Web Electronic Publication. Available at https://fishesofaustralia.net.au/home/species/671. [Google Scholar]
- Breitburg D, Levin LA, Oschlies A, Grégoire M, Chavez FP, Conley DJ, Garçon V, Gilbert D, Gutiérrez D, Isensee K, Jacinto GS, Limburg KE, Montes I, Naqvi SWA, Pitcher GC, Rabalais NN, Roman MR, Rose KA, Seibel BA, Telszewski M, Yasuhara M and Zhang J (2018) Declining oxygen in the global ocean and coastal waters. Science 359, 1–11. 10.1126/science.aam7240 [DOI] [PubMed] [Google Scholar]
- Bricknell IR, Dalesman SJ, O'Shea B, Pert CC and Mordue Luntz AJ (2006) Effect of environmental salinity on sea lice Lepeophtheirus salmonis settlement success. Diseases of Aquatic Organisms 71, 201‒212. [DOI] [PubMed] [Google Scholar]
- Bush AO, Lafferty KD, Lotz JM, Shostak AW (1997) Parasitology meets ecology on its own terms: Margolis, et al. revisited. The Journal of Parasitology 83, 575‒583. [PubMed] [Google Scholar]
- Byers JE (2021) Marine parasites and disease in the era of global climate change. Annual Review of Marine Science 13, 397‒420. [DOI] [PubMed] [Google Scholar]
- Callaway R, Shinn AP, Grenfell SE, Bron JE, Burnell G, Cook EJ, Crumlish M, Culloty S, Davidson K, Ellis RP, Flynn KJ, Fox C, Green DM, Hays GC, Hughes AD, Johnston E, Lowe CD, Lupatsch I, Malham S, Mendzil AF, Nickell T, Pickerell T, Rowley AF, Stanley MS, Tocher DR, Turnbull JF, Webb G, Wootton E and Shields RJ (2012) Review of climate change impacts on marine aquaculture in the UK and Ireland. Aquatic Conservation: Marine and Freshwater Ecosystems 22, 389‒421. [Google Scholar]
- Coghlan AR, Blanchard JL, Wotherspoon S, Stuart-Smith RD, Edgar GJ, Barrett N and Audzijonyte A (2024) Mean reef fish body size decreases towards warmer waters. Ecology Letters 27, e14375. [DOI] [PubMed] [Google Scholar]
- CSIRO and Bureau of Meteorology (2023a) Australian Climate Trends. Climate Change in Australia website. Available at https://www.climatechangeinaustralia.gov.au/en/changing-climate/climate-trends/australian-trends/. [Google Scholar]
- CSIRO and Bureau of Meteorology (2023b) Rainfall Change. Climate Change in Australia website. Available at https://www.climatechangeinaustralia.gov.au/en/changing-climate/future-climate-scenarios/global-warming-levels/rainfall-change/. [Google Scholar]
- CSIRO and Bureau of Meteorology (2023c) Temperature Change. Climate Change in Australia website. Available at https://www.climatechangeinaustralia.gov.au/en/changing-climate/future-climate-scenarios/global-warming-levels/temperature-change/. [Google Scholar]
- Esbaugh A (2018) Physiological implications of ocean acidification for marine fish: emerging patterns and new insights. Journal of Comparative Physiology B 188, 1‒13. [DOI] [PubMed] [Google Scholar]
- Gelman A and Rubin DB (1992) Inference from iterative simulation using multiple sequences. Statistical Science 7, 457‒472. [Google Scholar]
- Genner MJ, Sims DW, Southward AJ, Budd GC, Masterson P, McHugh M, Rendle P, Southall EJ, Wearmouth VJ and Hawkins SJ (2010) Body size-dependent responses of a marine fish assemblage to climate change and fishing over a century-long scale. Global Change Biology 16, 517‒527. [Google Scholar]
- Gervais CR, Champion C and Pecl GT (2021) Species on the move around the Australian coastline: a continental-scale review of climate-driven species redistribution in marine systems. Global Change Biology 27, 3200‒3217. [DOI] [PMC free article] [PubMed] [Google Scholar]
- Hobday AJ, Okey TA, Poloczanska ES, Kunz TJ and Richardson AJ (2006) Impacts of Climate Change on Australian Marine Life. Part A: Executive Summary. Canberra, Australia: Report to the Australian Greenhouse Office. [Google Scholar]
- Holmes JC (1990) Helminth communities in marine fishes. In Esch GW, Bush AO and Aho JM (eds), Parasite Communities: Patterns and Processes. London: Chapman & Hall, pp. 101‒130. [Google Scholar]
- Ikpewe IE, Baudron AR, Ponchon A, Fernandes PG and Pinto R (2021) Bigger juveniles and smaller adults: changes in fish size correlate with warming seas. Journal of Applied Ecology 58, 847‒856. [Google Scholar]
- Jacups SP (2010) Warmer waters in the Northern Territory – herald an earlier onset to the annual Chironex fleckeri stinger season. EcoHealth 7, 14–17. [DOI] [PubMed] [Google Scholar]
- Jerry DR, Smith-Keune C, Hodgson L, Pirozzi I, Carton AG, Hutson KS, Brazenor AK, Gonzalez AT, Gamble S, Collins G and VanDerWal J (2013) Vulnerability of an Iconic Australian Finfish (Barramundi – Lates Calcarifer) and Aligned Industries to Climate Change Across Tropical Australia: FRDC Project 2010/521. Deakin, ACT: Fisheries Research and Development Corporation. ISBN: 978-0-9875922-9-3. [Google Scholar]
- Kämäri M, Tarvainen M, Kotamäki N and Tattari S (2020) High-frequency measured turbidity as a surrogate for phosphorus in boreal zone rivers: appropriate options and critical situations. Environmental Monitoring and Assessment 192, 366. [DOI] [PMC free article] [PubMed] [Google Scholar]
- Klimpel S, Kuhn T, Münster J, Dörge DD, Klapper R and Kochmann J (2019) Parasites of Marine Fish and Cephalopods: A Practical Guide. Switzerland AG: Springer Nature. 10.1007/978-3-030-16220-7. [DOI] [Google Scholar]
- Koenigstein S, Mark FC, Gößling-Reisemann S, Reuter H and Poertner H-O (2016) Modelling climate change impacts on marine fish populations: process-based integration of ocean warming, acidification and other environmental drivers. Fish and Fisheries 17, 972‒1004. [Google Scholar]
- Kouadio ARE, Bouah EF, Yao SS and N'Douba V (2023) Seasonal study of the relationship between the condition factor and the monogeneans parasite density of Heterobranchus isopterus Bleeker, 1863 and Clarias gariepinus (Burchell, 1822) fished in the Bagoué river (North-Western, Ivory Coast). Parasitology Research 122, 2175‒2180. [DOI] [PubMed] [Google Scholar]
- Lafferty KD (2012) Biodiversity loss decreases parasite diversity: theory and patterns. Philosophical Transactions of the Royal Society B 367, 2814‒2827. [DOI] [PMC free article] [PubMed] [Google Scholar]
- Lehun AL, Silva JOS, Michelan G, Lansac-Tôha FM, Cavalcanti LD and Takemoto RM (2023) The occurrence of trophically transmitted parasites is influenced by the trophic level and body size of the fish host. Ecology of Freshwater Fish 32, 648‒655. [Google Scholar]
- Lindmark M, Audzijonyte A, Blanchard JL and Gårdmark A (2022) Temperature impacts on fish physiology and resource abundance lead to faster growth but smaller fish sizes and yields under warming. Global Change Biology 28, 6239‒6253. [DOI] [PMC free article] [PubMed] [Google Scholar]
- Lõhmus M and Björklund M (2015) Climate change: what will it do to fish-parasite interactions? Biological Journal of the Linnean Society 116, 397‒411. [Google Scholar]
- Mackenzie K (1999) Parasites as pollution indicators in marine ecosystems: a proposed early warning system. Marine Pollution Bulletin 38, 955‒959. [Google Scholar]
- Macnab V and Barber I (2012) Some (worms) like it hot: fish parasites grow faster in warmer water, and alter host thermal preferences. Global Change Biology 18, 1540‒1548. [Google Scholar]
- Mikheev VN, Pasternak AF, Valtonen ET and Taskinen J (2014) Increased ventilation by fish leads to a higher risk of parasitism. Parasites & Vectors 7, 281‒281. [DOI] [PMC free article] [PubMed] [Google Scholar]
- Möller H (1978) The effects of salinity and temperature on the development and survival of fish parasites. Journal of Fish Biology 12, 311‒323. [Google Scholar]
- Neubert K, Yulianto I, Theisen S, Kleinertz S and Palm HW (2016) Parasite fauna of Epinephelus coioides (Hamilton, 1822) (Epinephelidae) as environmental indicator under heavily polluted conditions in Jakarta Bay, Indonesia. Marine Pollution Bulletin 110, 747‒756. [DOI] [PubMed] [Google Scholar]
- Ohlberger J (2013) Climate warming and ectotherm body size – from individual physiology to community ecology. Functional Ecology 27, 991‒1001. [Google Scholar]
- Olsen EM, Heino M, Lilly GR, Morgan MJ, Brattey J, Ernande B and Dieckmann U (2004) Maturation trends indicative of rapid evolution preceded the collapse of northern cod. Nature 428, 932‒935. [DOI] [PubMed] [Google Scholar]
- Ovaskainen O and Abrego N (2020) Joint Species Distribution Modelling: With Applications in R. Cambridge, UK: Cambridge University Press. [Google Scholar]
- Ovaskainen O, Tikhonov G, Norberg A, Blanchet FG, Duan L, Dunson D, Roslin T and Abrego N (2017) How to make more out of community data? A conceptual framework and its implementation as models and software. Ecology Letters 20, 561‒576. [DOI] [PubMed] [Google Scholar]
- Pearce J and Ferrier S (2000) Evaluating the predictive performance of habitat models developed using logistic regression. Ecological Modelling 133, 225‒245. [Google Scholar]
- Phelan MJ, Gribble NA and Garrett RN (2008) Fishery biology and management of Protonibea diacanthus (Sciaenidae) aggregations in far Northern Cape York Peninsula waters. Continental Shelf Research 28, 2143‒2151. [Google Scholar]
- Pietrock M and Marcogliese DJ (2003) Free-living endohelminth stages: at the mercy of environmental conditions. Trends in Parasitology 19, 293‒299. [DOI] [PubMed] [Google Scholar]
- Poloczanska ES, Babcock RC, Butler A, Hobday AJ, Hoegh-Guldberg O, Kunz TJ, Matear R, Milton D, Okey TA and Richardson AJ (2007) Climate change and Australian marine life. Oceanography and Marine Biology: An Annual Review 45, 409‒480. [Google Scholar]
- Poloczanska ES, Brown CJ, Duarte CM, Halpern BS, Holding J, Kappel CV, O'Connor MI, Pandolfi JM, Parmesan C, Schwing F, Thompson SA, Richardson AJ, Sydeman WJ, Kiessling W, Schoeman DS, Moore PJ, Brander K, Bruno JF, Buckley LB and Burrows MT (2013) Global imprint of climate change on marine life. Nature Climate Change 3, 919‒925. [Google Scholar]
- Poloczanska ES, Burrows MT, Brown CJ, García Molinos J, Halpern BS, Hoegh-Guldberg O, Kappel CV, Moore PJ, Richardson AJ, Schoeman DS and Sydeman WJ (2016) Responses of marine organisms to climate change across oceans. Frontiers in Marine Science 3, 1–21. 10.3389/fmars.2016.00062 [DOI] [Google Scholar]
- Porter M, Barton DP, Francis N and Shamsi S (2023. a) Description of two new species of Diplectanum Diesing, 1858 (Monogenea: Diplectanidae) collected from Protonibea diacanthus (Lacepède, 1802) (Teleostei: Sciaenidae) from waters off northern Australia. International Journal for Parasitology: Parasites and Wildlife 21, 99‒109. [DOI] [PMC free article] [PubMed] [Google Scholar]
- Porter M, Barton DP, Hearnden M, Randall J, Crook DA and Shamsi S (2023b) Relationships between local variability in parasite communities of the black-spotted croaker (Protonibea diacanthus) (Teleostei: Sciaenidae) and host population structure and seasonality. Scientific Reports 13, 10291. [DOI] [PMC free article] [PubMed] [Google Scholar]
- Porter M, Barton DP, Shamsi S, Crook DA and Randall J (2023c) Deciphering the complex trophic relationship of the black-spotted croaker (Teleostei: Sciaenidae) and its parasites using stable isotope analysis. Canadian Journal of Zoology 101, 385‒392. [Google Scholar]
- Poulin R and Leung TLF (2011) Body size, trophic level, and the use of fish as transmission routes by parasites. Oecologia 166, 731‒738. [DOI] [PubMed] [Google Scholar]
- Poulin R and Morand S (2004) Parasite Biodiversity. Washington: Smithsonian Books. [Google Scholar]
- Poulin R, Guilhaumon F, Randhawa HS, Luque JL and Mouillot D (2011) Identifying hotspots of parasite diversity from species-area relationships: host phylogeny versus host ecology. Oikos 120, 740‒747. [Google Scholar]
- Przeslawski R, Daniell J, Anderson T, Barrie JV, Heap A, Hughes M, Li J, Potter A, Radke L, Siwabessy J, Tran M, Whiteway T and Nichol S (2011) Seabed habitats and hazards of the Joseph Bonaparte Gulf and Timor Sea, Northern Australia. Geoscience Australia: Geoscience Australia Record 2011/40, p69. [Google Scholar]
- Randall J, Saunders T, Barton DP, Porter M, King A, Kaestli M, Gibb K, Adair B, Wedd D, Roberts B, Kopf K and Crook D (2023) Biology of Black Jewfish (Protonibea diacanthus) in the Northern Territory: Information to Support Stock Assessment (Project No. 2018/027). Fisheries Research and Development Corporation. Available at https://www.frdc.com.au/project/2018-027. [Google Scholar]
- Reynolds M, Hockley FA, Wilson CAME and Cable J (2019) Assessing the effects of water flow rate on parasite transmission amongst a social host. Hydrobiologia 830, 201‒212. [Google Scholar]
- Rijn I, Buba Y, DeLong J, Kiflawi M and Belmaker J (2017) Large but uneven reduction in fish size across species in relation to changing sea temperatures. Global Change Biology 23, 3667‒3674. [DOI] [PubMed] [Google Scholar]
- Samaras A, Tsoukali P, Katsika L, Pavlidis M and Papadakis IE (2023) Chronic impact of exposure to low dissolved oxygen on the physiology of Dicentrarchus labrax and Sparus aurata and its effects on the acute stress response. Aquaculture 562, 738830. [Google Scholar]
- Saunders T, Pidd A, Trinnie F and Newman S (2021) Black Jewfish (2020): FRDC Report No. 2020-369. Deakin, ACT: Fisheries Research and Development Corporation. Available at https://fish.gov.au/report/369-Black-Jewfish-2020. [Google Scholar]
- Sheridan JA and Bickford D (2011) Shrinking body size as an ecological response to climate change. Nature Climate Change 1, 401‒406. [Google Scholar]
- Taillebois L, Barton DP, Crook DA, Saunders T, Taylor J, Hearnden M, Saunders RJ, Newman SJ, Travers MJ, Welch DJ, Greig A, Dudgeon C, Maher S and Ovenden JR (2017) Strong population structure deduced from genetics, otolith chemistry and parasite abundances explains vulnerability to localized fishery collapse in a large sciaenid fish, Leiostomus xanthurus. Evolutionary Applications 10, 978–993. [DOI] [PMC free article] [PubMed] [Google Scholar]
- Taillebois L, Davenport D, Barton DP, Crook DA, Saunders T, Hearnden M, Saunders RJ, Newman SJ, Travers MJ, Dudgeon CL, Maher SL and Ovenden JR (2021) Integrated analyses of SNP-genotype and environmental data in a continuously distributed snapper species (Lutjanus johnii, Bloch, 1792) reveals a mosaic of populations and a challenge for sustainable management. ICES Journal of Marine Science 78, 3212‒3229. [Google Scholar]
- Thoney DA (1993) Community ecology of the parasites of adult spot, Leiostomus xanthurus, and Atlantic croaker, Leiostomus xanthurus (Sciaenidae) in the Cape Hatteras region. Journal of Fish Biology 43, 781–804. [Google Scholar]
- Tikhonov G, Opedal ØH, Abrego N, Lehikoinen A, de Jonge MMJ, Oksanen J and Ovaskainen O (2020) Joint species distribution modelling with the r-package Hmsc. Methods in Ecology and Evolution 11, 442‒447. [DOI] [PMC free article] [PubMed] [Google Scholar]
- Timi J and Poulin R (2020) Why ignoring parasites in fish ecology is a mistake. International Journal for Parasitology 50, 755‒761. [DOI] [PubMed] [Google Scholar]
- Tjur T (2009) Coefficients of determination in logistic regression models – a new proposal: the coefficient of discrimination. The American Statistician 63, 366‒372. [Google Scholar]
- Welch DJ, Newman SJ, Buckworth RC, Ovenden JR, Broderick D, Lester RJG, Gribble NA, Ballagh AC, Charters RA, Stapley J, Street R, Garrett RN and Begg GA (2015) Integrating different approaches in the definition of biological stocks: a northern Australian multi-jurisdictional fisheries example using grey mackerel, Scomberomorus semifasciatus. Marine Policy 55, 73‒80. [Google Scholar]
- Wootton HF, Morrongiello JR, Schmitt T, Audzijonyte A and Marshall D (2022) Smaller adult fish size in warmer water is not explained by elevated metabolism. Ecology Letters 25, 1177‒1188. [DOI] [PMC free article] [PubMed] [Google Scholar]
- Yang W, Hu W, Chen B, Tan H, Su S, Ding L, Dong P, Yu W and Du J (2023) Impact of climate change on potential habitat distribution of Sciaenidae in the coastal waters of China. Acta Oceanologica Sinica 42, 59‒71. [Google Scholar]
- Zhang Z, Xu S, Capinha C, Wterings R and Gao T (2019) Using species distribution model to predict the impact of climate change on the potential distribution of Japanese whiting Sillago japonica. Ecological Indicators 104, 333‒340. [Google Scholar]
Associated Data
This section collects any data citations, data availability statements, or supplementary materials included in this article.
Supplementary Materials
Porter et al. supplementary material
Data Availability Statement
All data produced for this study are provided in the manuscript.