Abstract
Objectives
The purpose of this study was to investigate the significance of pyroptosis-related lncRNAs (PRlncRNA) in predicting prognoses and immune landscapes of patients with gastric adenocarcinoma (STAD).
Methods
Transcriptomic data and clinicopathological data were obtained from The Cancer Genome Atlas database. Based on correlation analysis and univariate Cox regression, prognostic PRlncRNA were identified. Subsequently, a PRlncRNA prognostic signature (PRLPS) was generated via least absolute shrinkage and selection operator (LASSO) regression, Kaplan–Meier method, receiver operating characteristic (ROC) curves, principal component analysis, and univariate and multivariate regression. Besides, the clinicopathological characteristics, tumor microenvironment (TME) scores, the immune landscapes in different risk subgroups were explored. Moreover, based on three PRlncRNA, we constructed a competing endogenous RNA (ceRNA) network. Additionally, Gene Set Enrichment Analysis (GSEA), Kyoto Encyclopedia of Genes and Genomes pathways (KEGG) and Gene Ontology (GO) analysis were performed for biological functional analysis based on the difference between high- and low- risk groups, which also used to screen out potential STAD drugs.
Results
21 PRlncRNA made up the prognostic signature, which had significant value in predicting the overall survival (OS), clinicopathological features, TME, immune checkpoint genes expression, and the response to immune checkpoint inhibitors of patients with STAD. In a addition, we constructed a ceRNA network comprising 3 PRlncRNAs and 69 mRNAs. The function of PRlncRNA was related to cancer-associated pathways. Ten small molecular drugs that might improve the prognosis of patients were screened out by connectivity maps.
Conclusions
Using PRlncRNA as a prognostic indicator for STAD, we identified predictive biomarkers and immunotherapy targets while refreshing our understanding.
Keywords: Gastric adenocarcinoma, Pyroptosis, Long non-coding RNAs, Prognostic signature, Tumor microenvironment, Immunotherapy
Introduction
On a global scale, gastric cancer (GC) ranks as the fifth most prevalent form of cancer and the third most lethal tumor [1]. Gastric adenocarcinoma (STAD) is the predominant histological subtype of GC. Although there have been notable improvements in the identification and management of STAD, the prognosis for patients with this subtype is unfavorable, primarily attributed to the advanced disease stage and the likelihood of recurrence after surgery [2, 3]. Hence, it is crucial and pressing to discover new biomarkers that may be used to diagnose STAD at an early stage and identify successful treatment targets for treating patients.
Recently, pyroptosis has received more and more attention because of its association with immunity and tumor [4]. Pyroptosis, referred to as an inflammatory form of programmed cell death, is triggered by certain inflammasomes, leading to the cleavage of gasdermin D (GSDMD) and activation of inactive cytokines like IL-18 and IL-1β [5]. The role of pyroptosis in the tumor is extremely complicated and diverse [6]. On the one hand, pyroptosis can promote inflammatory cell death of cancer cells and enhance the immune response [7, 8], which inhibits oncogenesis and progression of tumors, while on the other hand, it creates a microenvironment suitable for tumor cell growth and accelerates tumor growth [9]. Importantly, it has been well established that a major risk factor for the development of STAD is Helicobacter pylori infection [10], which has been proved to cause pyroptosis [11]. NLRP3, a pyroptosis-related gene, which was activated by H.pylori, played a critical role in the STAD development in an inflammasome pathway-dependent or independent way [12]. Therefore, we hypothesized that pyroptosis-related regulators hold immense latent toward the prediction of therapeutic response and prognosis in patients with STAD.
Mounting evidence indicates that long non-coding RNAs (lncRNAs) possess diverse biological activities and play a pivotal function in the development and advancement of STAD [13]. For instance, the lncRNA IGF2-AS acted as a ceRNA against miR-503 and enhanced the disease-causing effect of STAD via controlling the activity of SHOX2 [14]. Moreover, recent studies indicated that the indirect regulation of lncRNAs in pyroptosis was involved in the pathological process of different cancers, including GC [15]. According to the paper, the lncRNA RNA ADAMTS9-AS2 was shown to have a tumor-suppressing effect and increase the sensitivity of GC cells to cisplatin. This was achieved by triggering NLRP3-mediated pyroptotic cell death via its interaction with miR-223-3p [16]. Nevertheless, the predictive significance of pyroptosis-related lncRNAs (PRlncRNA) in STAD patients has not been well assessed.
In this paper, we conducted an analysis of The Cancer Genome Atlas (TCGA) database to find lncRNAs linked to pyroptosis and their involvement in STAD. Subsequently, we developed a prognostic signature called the PRLPS. Subsequently, we assessed the predictive value and diagnostic efficacy of the aforementioned factor, along with its correlation to clinicopathological characteristics, TME, and immunotherapy. In addition, a ceRNA network was constructed to determine the target miRNAs and mRNAs that are linked to this predictive PRlncRNA. Furthermore, the molecular pathways linked to predictive PRlncRNA were investigated. Ultimately, we discovered prospective small molecule medications capable of reversing the gene expression produced by STAD via the examination of the connectivity map (CMap) database. The research discovered the crucial involvement of PRlncRNA and provided insights into the hidden connection and underlying mechanism between PRlncRNA and interactions between tumors and the immune system [17–19].
Material and methods
Acquisition of datasets
The RNA-seq transcriptome data (fragments per kilobase million, FPKM) [20] from 373 samples and clinical information from 406 patients with STAD in TCGA database (http://cancergenome.nih.gov/) were downloaded for our study. Patients with complete clinicopathological and survival information were included for further assessment.
Selection of pyroptosis-related regulators (PRR)
Based on published data [21–24], 35 pyroptosis-related regulators, including CASP1, CASP3, CASP4, CASP5, CASP6, CASP8, CASP9, GSDMA, GSDMB, GSDMC, GSDMD, GSDME, NLRP1, NLRP2, NLRP3, NLRP6, NLRP7, IL1B, IL6, IL18, TNF, GPX4, AIM2, PYCARD, NOD2, NOD1, NLRC4, PRKACA, ELANE, TIRAP, SCAF11, PJVK, PLCG1, GZMA, and GZMB, were used in our study.
Identification of prognostic PRlncRNA
We mainly propose to analyze the link between PRR and all lncRNAs in STAD. PRlncRNA were found using the following categorization criteria: (1) Correlation coefficients above 0.3; (2) p value below 0.001. Next, we performed a univariate Cox regression (UCR) analysis to find the PRlncRNA that exhibited a strong correlation with OS at a significance level of p < 0.05.
Construction and Validation of the PRLPS
The STAD patients were separated into two groups, namely the training group and the testing group, employing a random allocation method. Afterward, utilizing the results of the UCR analysis to identify prognostic PRlncRNAs, the LASSO Cox regression approach was employed to detect lncRNAs that have strong predictive value for prognosis and to develop a prognostic risk model using the training group data. The PRlncRNA coefficients were derived employing the optimum penalty value λ. The risk score (RS) was computed employing the following mathematical equation:
where Coef(i) is the coefficient, and X(i) denotes the PRlncRNA expression levels. STAD patients were categorized into two groups, namely the high-risk group (HRG) and the poor-risk group, employing the median RS found as the threshold value. The prediction efficiency [25] was validated using Kaplan–Meier (KM) analysis and ROC curves. Subsequently, the model's correctness was verified using the same procedure on both the test group and the integrated group. Furthermore, the predictive significance of the RS was confirmed by employing UCR and multivariate Cox regression (MCR) analysis. The “glmnet” and “survival” R packages were employed to calculate the hazard ratio (HR), along with its 95% confidence intervals and log-rank p-value [26]. The “Rtsne” package and the prcomp function in the “stats” package were employed to conduct principal component analysis (PCA) with the purpose of investigating the distribution of HRG and poor-risk groups.
Clinical application of PRLPS
An investigation was conducted to examine the disparities in clinicopathological characteristics, the composition of immune infiltrating cells (ICC), TME scores, and immune checkpoint genes (ICGs) between the HRG and poor-risk groups. Furthermore, the study also examined the connection between the OS and the composition of IIC, as well as the TME scores. The CIBERSORT algorithm was employed to determine the composition of IIC [27], while the "ESTIMATE" package in R was deployed to compute the immune/stromal scores and tumor purity [28]. We made further predictions on the effectiveness of immune checkpoint inhibitors (ICIs) in certain subgroups of STAD patients. These predictions were based on the immunophenoscores (IPS) obtained from The Cancer Immunome Atlas (TCIA) (https://tcia.at/home). The IPS, developed impartially by machine learning, may serve as a reliable indicator of responses to cytotoxic anti-T-lymphocyte-antigen-4 (anti-CTLA-4) and anti-PD-1 antibodies. A reduced IPS is indicative of a more unfavorable prognosis and a diminished response to immunotherapy.
Construction of the ceRNA network and functional enrichment analysis
GSEA, KEGG pathway, and GO analysis were performed to investigate the biological activities linked to PRlncRNA. The “edgeR” package in R was deployed to identify differentially expressed genes (|fold change (FC)|> 1 and false discovery rate (FDR) < 0.05) between the HRG and poor-risk group. These genes were then subjected to GO and KEGG pathway analysis. Moreover, genes belonging to the HRG and poor-risk groups were subjected to functional annotation using GSEA. The miRcode database was deployed to forecast the target miRNAs based on the prognostic PRlncRNAs connected to pyroptosis. After that, these target mRNAs of miRNAs were found in TargetScan, miRTarBase, and miRDB, among other databases. The mRNAs in the ceRNA network that manifested differential expression between tumor tissues and surrounding mucosa in STAD patients were further subjected to functional annotation using GO and KEGG pathway analysis.
Screening of potential small molecule drugs
In order to identify possible small molecule drugs that can reverse gene expression in STAD, we employed the Connectivity map (CMap) (https://portals.broadinstitute.org/cmap/). This database consists of comprehensive transcriptional expression data across the entire genome, allowing for the identification of functional connections between drugs, genes, and diseases depending on variations in gene expression profiles [29]. Based on an investigation of differentially expressed genes (DEGs) between HRG and poor-risk groups using the “limma” package in R, where the log2fold change (FC) was > 1 and the FDR was < 0.05, the small molecule medications were identified. The findings were sorted based on their negative connectivity value, which is near to − 1. Statistical significance was attributed only to those with a p value below 0.05. The three most important medications’ 3D structures were acquired from PubChem (https://pubchem.ncbi.nlm.nih.gov/).
Cell culture
The MGC-803 cell line derived from gastric cancer and the GES-1 cell line derived from normal human gastric epithelium were obtained from the American Type Culture Collection (ATCC, Manassas, VA, USA). The cells were cultivated in RPMI-1640 media (Gibco) supplemented with 10% fetal bovine serum (Gibco). The culture was maintained at a temperature of 37 ℃ in a controlled environment with added 5% CO2.
Quantitative reverse transcription-polymerase chain reaction (qRT-PCR)
The cells underwent RNA extraction, deploying TRIzol reagent (Invitrogen, China), adhering to the guidelines provided by the manufacturer. The reverse transcription process was conducted in accordance with the instructions provided by the manufacturer, employing the PrimeScript RT Reagent Kit (AG, China). The SYBR PrimeScript RT-PCR Kit (AG) was used for the quantification of RT-PCR via quantitative analysis. The expression levels of associated lncRNAs were determined employing the 2-ΔΔCT technique, with the expression of GAPDH mRNA serving as an internal reference. Primers sequences employed in our investigation were as follows: GAPDH forward 5’-GGACCTGACCTGCCGTCTAG-3’, and reverse 5’-GTAGCCCAGGATGCCCTTGA-3’; AC009090.3 forward 5’-TCAGGAGTACTGGGCTG-3’, and reverse 5’-TGATGCTGTGGTTGGAT-3’; AC036103.1 forward 5’-CTCCATCCCGAGTAGCC-3’, and reverse 5’-TTTAACCATCACGCCCA-3’; AP000695.2 forward 5’-GCCTTGAAGTTCTCCAG-3’, and reverse 5’-TTTGTCAGTGCGTATCC-3’; AL137186.2 forward 5’-TAAGGGGAACAACCAAA-3’, and reverse 5’-ATCAGAATCCAAATGCG-3’; AC068790.7 forward 5’-GACAGGTAGATAAGAGA-3’, and reverse 5’-CTAAAGTACAAAGAAAA-3’; STARD4-AS1 forward 5’-TCAAACAAGTATTCACCCTA-3’, and reverse 5’-ATCACCCATTCTCCACAT-3’.
Statistical analysis
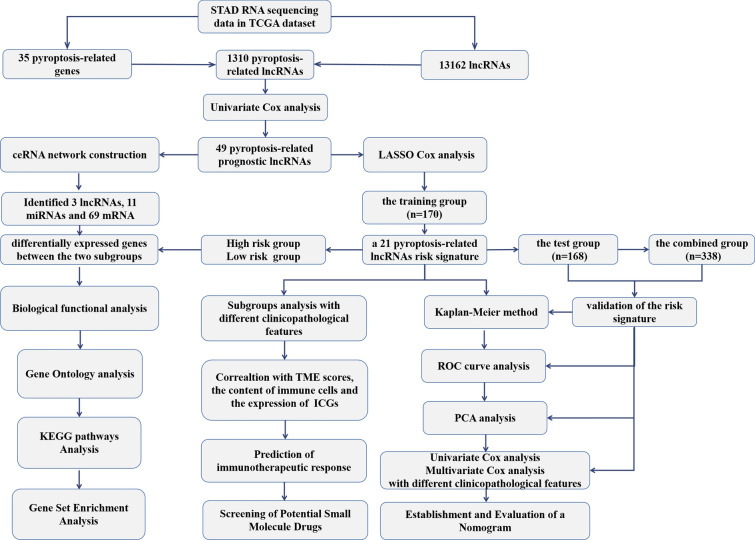
The expression data of PRR and all lncRNAs in tumor tissues and surrounding mucosa of STAD gathered from TCGA were evaluated employing a one-way analysis of variance (ANOVA). A comparison of the clinical features of several groups was conducted employing the chi-square test. OS analysis was conducted using the KM method, and a bilateral logarithmic rank test was performed. Statistical significance was deemed as p-values < 0.05. The statistical analyses were conducted employing R v4.0.3 (https://www.r-project.org/) or GraphPad Prism software (Version 8.0). The flow chart of bioinformatic analysis is shown in Fig. 1.
Fig. 1.
The flow chart of the study design and analysis
Results
Identification of prognostic PRlncRNA
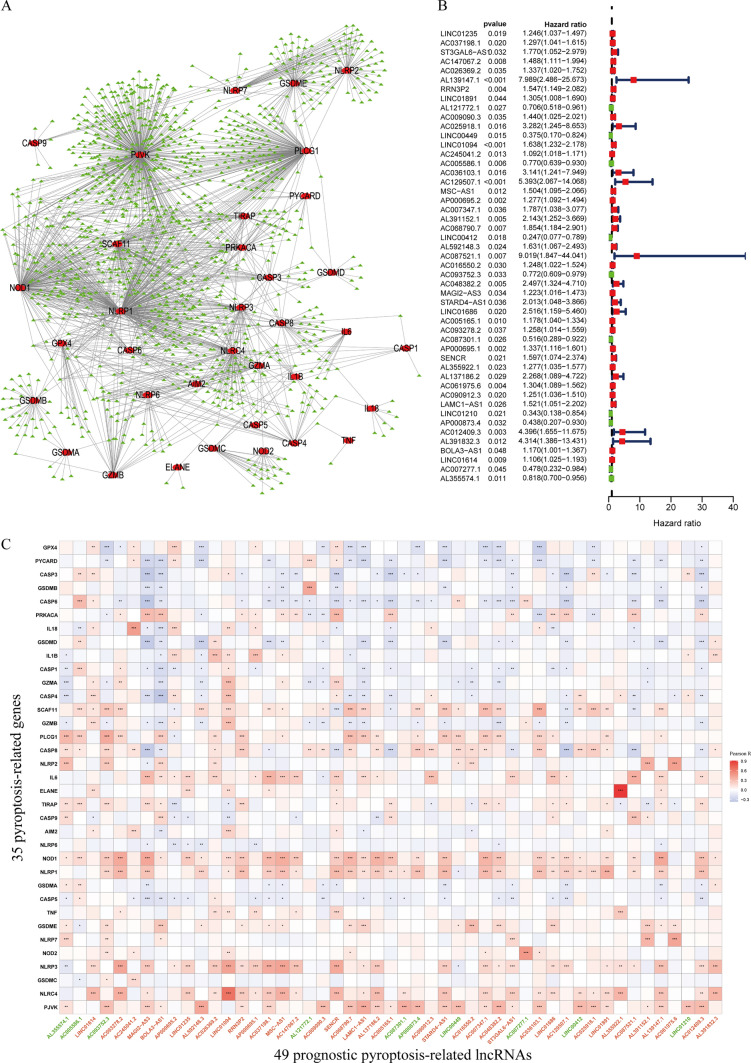
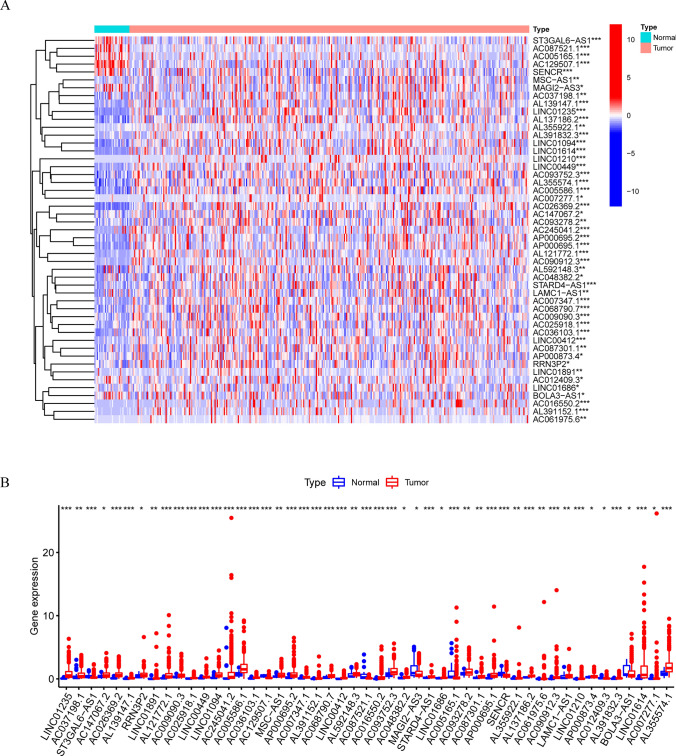
Initially, the levels of expression for 35 genes relevant to pyroptosis, as well as all lncRNAs, were separately retrieved from the TCGA dataset. We have found 1310 PRlncRNA by coexpression analysis lncRNAs (|cor|> 0.3, p < 0.001). Figure 2A displays the gene co-expression network, including 35 pyroptosis-correlated genes and 1310 PRlncRNA. Following the implementation of univariate Cox analysis, typically, 49 potential lncRNAs were found to have a strong correlation with OS (p < 0.05) (Fig. 2B). Figure 2C demonstrates the co-expression connection between the putative lncRNAs and genes associated with pyroptosis. The study compared the expression of 49 PRlncRNA in tumor tissues and nearby mucosal tissues (Fig. 3A, B). Out of these lncRNAs, ten were identified as beneficial prognostic variables, whereas thirty-nine were identified as detrimental prognostic factors.
Fig. 2.
Identification of prognostic PRlncRNA in STAD patients. A The network of the 35 PRR and 1310 PRlncRNA. B The HR 95% CI of 49 PRlncRNA was determined by UCR. C Pearson correlation analysis between 35 pyroptosis-related genes and 49 prognostic PRlncRNA. Green was prognostic protective lncRNAs, and red was prognostic risk lncRNAs. * p < 0.05, ** p < 0.01, *** p < 0.001
Fig. 3.
The expression of 49 prognostic pyroptosis-related lncRNAs in TCGA database between the tumor group and the normal group. A, B The expression of 49 prognostic pyroptosis-related lncRNAs in TCGA database between the tumor group and the normal group. * p < 0.05, ** p < 0.01, *** p < 0.001
Construction and verification of PRLPS
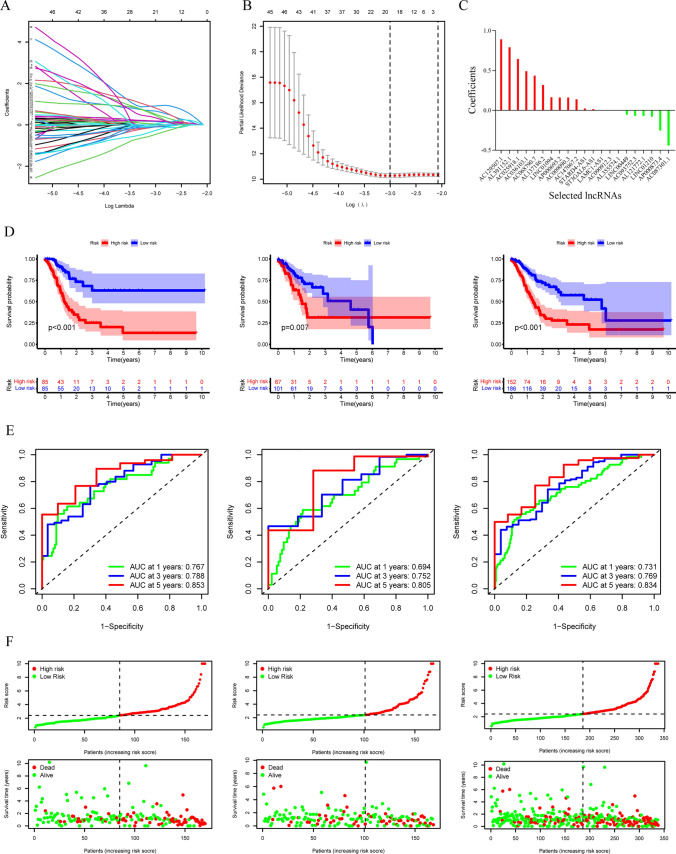
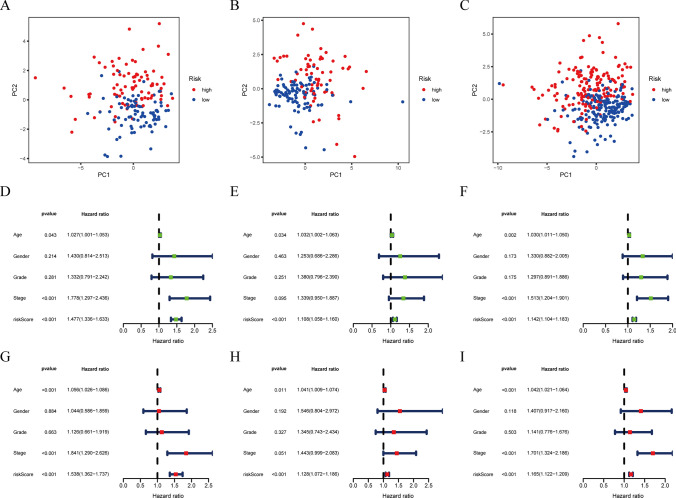
We used the LASSO approach on a set of 49 candidate lncRNAs that showed a strong correlation with OS. This was done in the training group to create a PRLPS for assessing the STAD patient's prognosis. Ultimately, a total of 21 lncRNAs were selected to create a prognostic signature. Subsequently, the RS was computed based on these lncRNAs (Fig. 4A, B, C). The patients in the training group (n = 170) were divided into two groups, namely the HRG and the poor-risk group, depending on the median RS as the cutoff criteria. An evaluation of the prognostic model's effectiveness was carried out via studies on survival and ROC curves. The KM analysis manifested a statistically significant longer survival time of the poor-risk group than HRG (p < 0.001) (Fig. 4D). The time-dependent ROC curve for 1-, 3-, and 5-year intervals had area under the curve (AUC) values of 0.767, 0.788, and 0.853 correspondingly (Fig. 4E). The findings suggest that the survival model has a robust predictive capacity. To confirm this prognostic signature accuracy consisting of 21 lncRNAs, a verification study was conducted on both the test group (n = 168) and the combination group (n = 338). As a result, survival time was significantly reduced for both the HRG in the test group and the combined group when contrasted to the poor-risk group, which was previously seen in the training group. The time-dependent ROC curve of both the test group and the combination group exhibited strong predictive capabilities. The AUC values for 1-, 3-, and 5-year intervals are shown in Fig. 4D. Figure 4F depicts a distribution plot for the connection between the RS and the survival status of STAD patients. The figure demonstrates that when the RS increases, the number of patient fatalities also increases. Furthermore, the PCA analysis further validated the RS's capacity to form distinct clusters (Fig. 5A, B, C).
Fig. 4.
Construction and verification of the pyroptosis-related lncRNAs (PRlncRNA) prognostic signature. A The point with minimum cross-validation error is associated with the number of factors numbers employed in the LASSO regression model. B The lines of various colors manifest the trajectory of the correlation coefficient of various factors in the model with the elevation of Log Lamda. C LASSO coefficients of 21 selected PRlncRNA. D KM analysis of patients in the HRG and poor-risk group in the training group, the test group, and the combined group. E ROC analysis of 1-, 3- and 5-year in the training group, the test group, and the combined group. F The distribution plots of the RS and survival status in the training group, the test group, and the combined group
Fig. 5.
PCA analysis, UCR, and MCR analyses of PRLPS. A–C PCA analysis in the training group, the test group, and the combined group. D–F Univariate Cox regression analyses in the training group, the test group, and the combined group. G–I MCR analyses in the training group, the test group, and the combined group
In order to determine whether the RS had an autonomous predictive value, both UCR and MCR analyses were performed. In the training group, the RS showed a strong correlation with OS in both UCR and MCR analysis (p < 0.001). Age at diagnosis and clinical stage also had a significant connection with the RS and OS (p < 0.05). It is important to highlight that the RS showed a strong correlation with OS in both the test group (p < 0.001) and the combination group (p < 0.001), according to the same study. This suggests that the RS is an autonomous and influential prognostic factor for predicting the OS outcome in STAD (Fig. 5D, E, F, G, H, I).
Subgroup analysis with different clinicopathological features
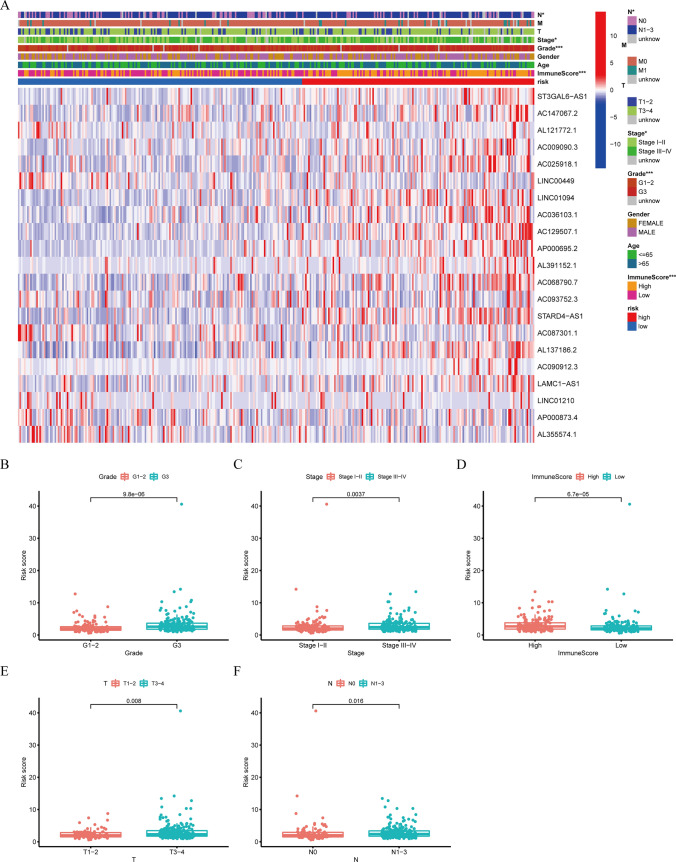
The expression levels of 21 prognostic PRlncRNAs, along with the distribution of clinicopathological characteristics and immunological scores of the TME in patients classified as high-risk or poor-risk, were illustrated using a heatmap (Fig. 6A). Significant disparities were identified between the two groups in terms of grade (p < 0.001), clinical stage (p < 0.05), stage N (p < 0.05), and the immunological ratings of TME (p < 0.001). Statistically significant variations in RS were seen in the following categories: (1) tumor grades (p < 0.001) (Fig. 6B); (2) clinical stage (p < 0.01) (Fig. 6C); (3) immunological scores of TME (p < 0.001) (Fig. 6D); 4) stage T (p < 0.01) (Fig. 6E); 5) stage N (p < 0.05) (Fig. 6F).
Fig. 6.
The relationship between the RS and clinicopathological characteristics and TME. A The heatmap showed the expression of 21 pyroptosis-related prognostic lncRNAs, the distribution of clinicopathological characteristics, and the immune scores of TME in the HRG and poor-risk groups. * p < 0.05, *** p < 0.001. B–F Significant variations in RS were found between various tumor grades, clinical stage, stage T, stage N, and different immune scores of TME
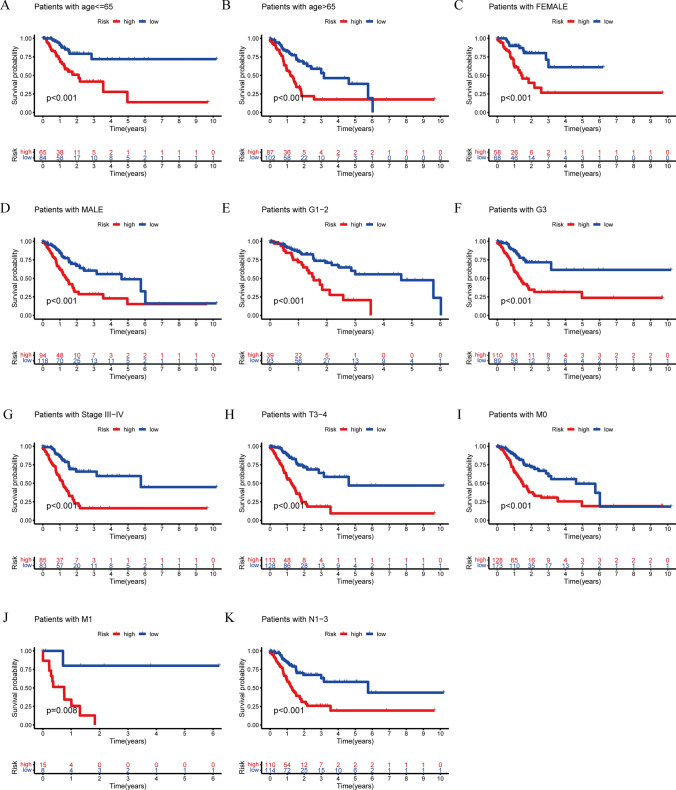
In order to assess the potential of PRLPS as a prognostic indication for OS in various subgroups of patients with distinct clinical characteristics, we categorized the subgroups based on age (≤ 65 and > 65), gender (female and male), grade (G1-2 and G3), clinical stage (stage I-II and stage III-IV), stage T (T1-2 and T3-4), stage M (M0 and M1), and stage N (N0 and N1-3). The clinical features of both the HRG and poor-risk groups were documented in Table 1. According to the findings presented in Fig. 7, the OS of poor-risk patients was significantly higher than that of high-risk patients. This difference was observed based on various factors, including age (p < 0.001 for age ≤ 65 and age > 65) (Fig. 7A, B), sex (p < 0.001 for female and male) (Fig. 7C, D), grade (p < 0.001 for G1-2 and G3) (Fig. 7E, F), stage III-IV (p < 0.001) (Fig. 7G), stage T3-4 (p < 0.001) (Fig. 7H), stage M (p < 0.001 for stage M0 and p = 0.008 for stage M1) (Fig. 7I, J), and stage N1-3 (p < 0.001) (Fig. 7K).
Fig. 7.
Subgroup analysis with different clinicopathological features in STAD. A Age ≤ 65. B Age > 65. C Female. D Male. E G1-2. F G3. G Stage III-IV. H Stage T3-4. I Stage M0. J Stage M1. K Stage N1-3
Correlation between TME, immunotherapy and PRLPS
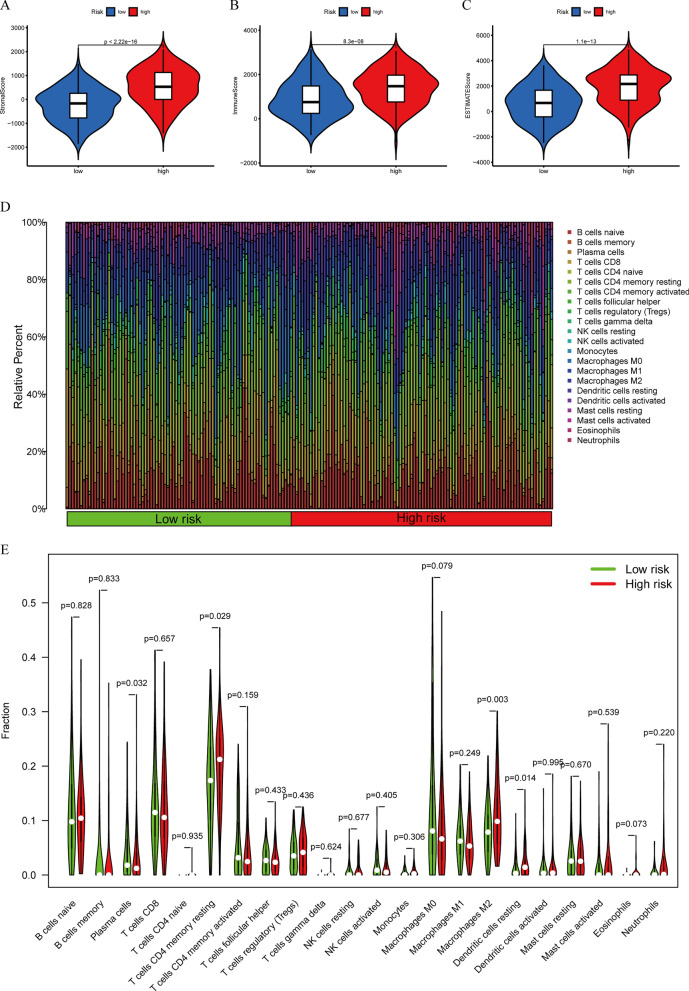
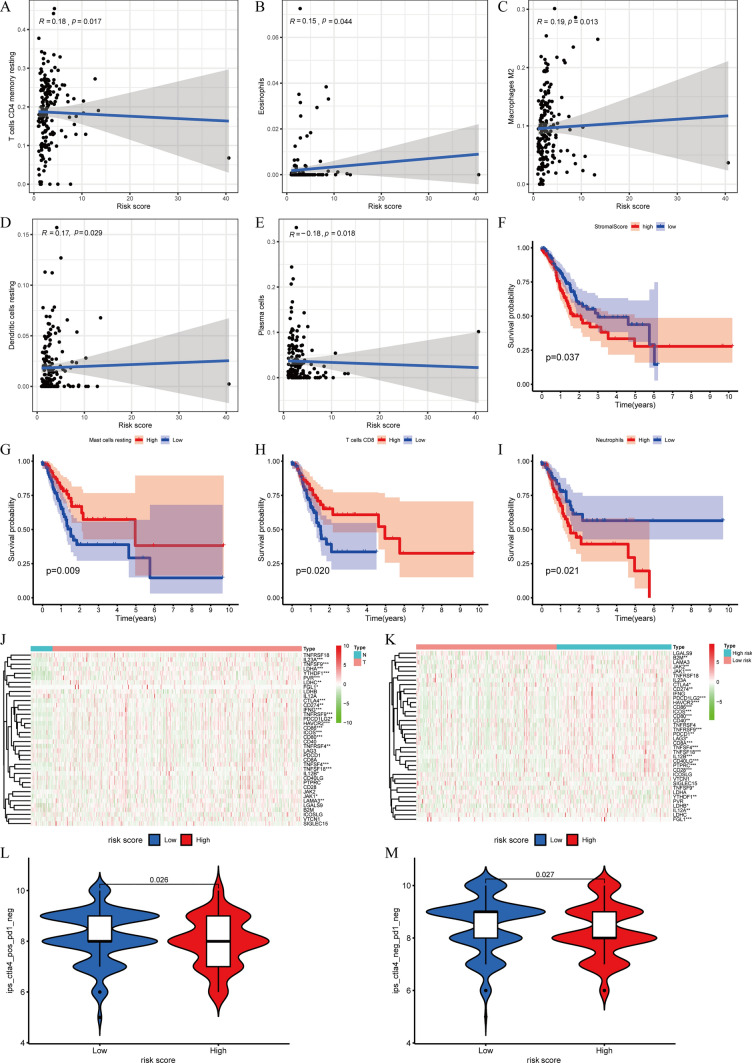
Based on the current acknowledged methods mentioned previously, TME in patients with STAD, including TME scores, ICC, and ICGs, was revealed between the HRG and poor-risk group. The correlation between TME scores, the composition of immune cells, and subgroups is shown in Fig. 8A, B, C, D and E. We discovered that the RS exhibited noteworthy positive associations with the levels of memory-resting CD4 T cells (r = 0.18, p = 0.017), eosinophils (r = 0.15, p = 0.044), M2 macrophages (r = 0.19, p = 0.013), and resting dendritic cells (r = 0.17, p = 0.029) (Fig. 9A, B, C, D). Additionally, it displayed significant adverse connections with the infiltrating plasma cell levels (r = − 0.18, p = 0.018) (Fig. 9E). Furthermore, the study also uncovered the link between the composition of ICC, TME ratings, and OS. The OS of patients with high stromal scores was significantly worse contrasted to those with low stromal scores (Fig. 9F). Increased levels of resting mast cells and CD8 T cells are positively correlated with greater OS. Nevertheless, those with elevated neutrophil counts had a worse outcome compared to those with lower neutrophil counts (Fig. 9G, H, I).
Fig. 8.
The correlation between TME scores, the content of immune cells, and subgroups. A–C The difference in stromal scores, immune scores, and estimate scores in the HRG and poor-risk groups. D The distribution of immune cells in the HRG and poor-risk group. E The difference in the content of immune cells in the HRG and poor-risk groups
Fig. 9.
Correlation between TME, immunotherapy, and PRLPS. A–E The RS had significant positive correlations with infiltrating levels of memory resting CD4 T cells, eosinophils, M2 macrophages, and resting dendritic cells and had significant adverse connections with infiltrating levels of plasma cells. F The OS of patients with high stromal scores was significantly worse compared to those with low stromal scores. G–I The higher the content of resting mast cells and CD8 T cells, the higher the OS. The patients with high neutrophil counts had a worse prognosis than those with low neutrophil counts. J The expression of ICGs between the normal and the tumor groups. K The ICGs expression between the HRG and the poor-risk groups.* p < 0.05, ** p < 0.01, and *** p < 0.001. L, M The relative probabilities to respond to PD1( −)/CTLA4( +) and PD1( −)/CTLA4( −) treatment between the HRG and poor-risk group
Moreover, the paper examined the disparity in the ICI response between those in the HRG and those in the poor risk groups (Fig. 9J, K). Comparatively, the poor-risk group had a greater likelihood of responding to immunotherapy than the HRG in the IPS-PD1(-)/CTLA4( +) and IPS-PD1(-)/CTLA4(-) scenarios (Fig. 9L, M).
Construction of the ceRNA network and functional enrichment analysis
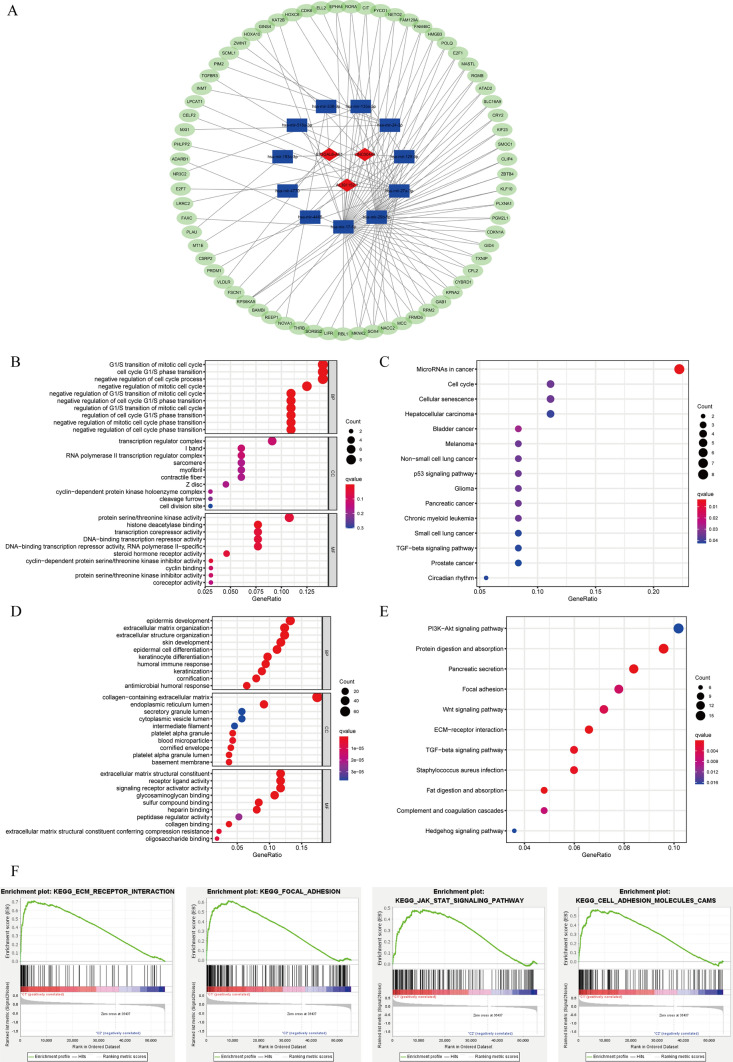
In order to investigate the biological role of prognostic PRlncRNA, we created a ceRNA network. This network was created on the principle that lncRNAs may regulate the production of mRNA by acting as sponges for miRNAs. The lncRNAs were obtained from the miRcode database, and a total of 15 pairings of interaction involving 3 lncRNAs and 11 miRNAs were discovered. Using three previously stated mRNA prediction databases and comparing differentially expressed mRNA between the normal and tumor groups of STAD in TCGA, we have found a total of 69 target mRNA. Ultimately, a ceRNA network was constructed using Cytoscape software 3.7.1, including 3 lncRNAs, 11 miRNAs, and 69 mRNAs (Fig. 10A). The function of 69 target mRNAs was annotated using the KEGG pathway and GO analysis. It was discovered that these target mRNAs were enriched in the G1/S transition of the mitotic cell cycle, transcription regulator complex, and protein serine/threonine kinase activity according to the GO analysis. Additionally, the KEGG pathway analysis revealed their involvement in microRNAs in cancer, cell cycle, hepatocellular carcinoma, bladder cancer, and the p53 signaling pathway (Fig. 10B, C).
Fig. 10.
The ceRNA network construction and biological function analysis. A The ceRNA network of 3 lncRNAs (red) and their target miRNAs (blue) and mRNAs (green). B GO analysis of 69 target mRNAs in ceRNA network. C KEGG pathway analysis of 69 target mRNAs in ceRNA network. D GO analysis of DEGs between the HRG and the poor-risk group. E KEGG pathway analysis of DEGs between the HRG and the poor-risk group. F GSEA analysis of the genes in the HRG
We categorized the STAD patients into two distinct groups depending on their risk level: high-risk and poor-risk. By employing the “edgeR” package in R, we discovered genes that exhibited noteworthy differentiation (|FC|> 1 and FDR < 0.05) among these subgroups. In order to examine the biological functions, we conducted GO and KEGG pathway analysis. The DEGs between the HRG and the poor-risk group were discovered to be linked to immune-related biological processes, notably the “humoral immune response” and “antimicrobial humoral response.” Moreover, these genes were shown to be connected with pathways related to malignancy, such as the “PI3K-Akt signaling pathway”, “Focal adhesion,” “Wnt signaling pathway,” and “ECM-receptor interaction” (Fig. 10D, E).
In addition, we employed GSEA to forecast the functional disparity between the HRG and the poor-risk cohort. The findings indicated a strong correlation between the HRG, which exhibited a worse OS and a lower 5-year survival rate, and the malignant characteristics of cancer, including “Focal adhesion,” “ECM-receptor interaction,” “JAK-STAT signaling pathway,” and “Cell adhesion molecules” (Fig. 10F).
Screening of potential small molecule drugs for STAD
In order to forecast potential small compounds that may be used to treat STAD, we submitted the genes that exhibited substantial differentiation (|FC|> 1 and FDR < 0.05) between the HRG and the poor-risk group to the CMap database for GSEA. Table 2 includes the top 10 small molecules that exhibited acceptable enrichment scores. Figure 11 displays the 3D chemical structures of the three most notable small molecule medications among the mentioned ones. The small compounds had the highest probability of reversing gene expression associated with high risk and might potentially develop novel therapeutic protocols for STAD treatment.
Fig. 11.
The 3D structure of the three small molecule drugs for STAD. A Penbutolol. B Ikarugamycin. C Monensin
Validation of the expression levels of the PRlncRNA in cell lines
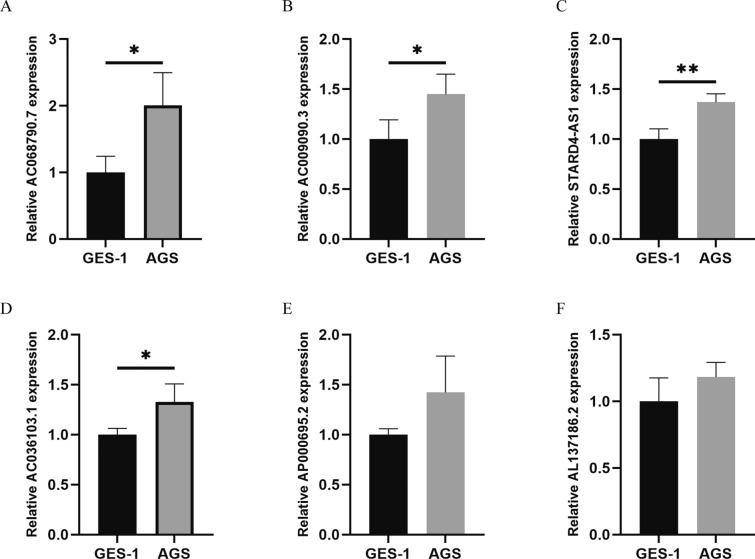
We assessed the expression levels of six pyroptosis-related prognostic lncRNAs in two cell lines, AGS (a gastric cancer cell line) and GES-1 (a normal human gastric epithelial cell line), in order to confirm the PRlncRNA expression levels in the prognostic signature. The findings of our study indicated that the genes AC009090.3, AC036103.1, AC068790.7, and STARD4-AS1 exhibited a substantial increase in expression in the AGS cell line when compared to the GES-1 cell line. AP000695.2 and AL137186.2 were highly expressed in AGS, but they had no significant difference in cells. These results align with the prior bioinformatic analysis (Fig. 12). Moreover, the copy numbers of these lncRNAs ranged from reasonable range, which demonstrated suitability for potential biomedical utilization.
Fig. 12.
Expression of six lncRNAs from the prognostic signature in GC cell line AGS and normal human gastric epithelial cell line GES-1. * p < 0.05, ** p < 0.01, and *** p < 0.001. A AC068790.7. B AC009090.3. C STARD4-AS1. D AC036103.1. E AP000695.2. F AL137186.2
Discussion
The progressive development of intestinal metaplasia and atrophic gastritis is brought on by the chronic H. pylori infection of the gastric mucosa, hence facilitating the emergence of STAD [30]. Importantly, studies have found that pyroptosis is mainly caused by microbial infection [31], suggesting that it is related to the long-term chronic inflammatory reactions in the gastric mucosa established by H.pylori. For instance, The NLRP3 inflammasome has a significant role in driving H.pylori infection, which induces pyroptotic death in cells and forms mature IL-1β or IL-18 that mediates gastric tumorigenesis in humans [32]. Moreover, it is confirmed that GSDMD, an essential part of pyroptosis, can be cleaved by inflammatory caspases and promotes the proliferation of GC cells [33]. GSDME, which has the same function in pyroptosis as GSDMD, can induce pyroptosis after being treated with 5-fluorouracil in GC cells [34]. Such research further supports the important functional role of pyroptosis in GC pathogenesis. Additionally, numerous investigations have revealed that the connection between pyroptosis and tumor immunity is notably intricate. Pyroptosis serves as the mechanism by which some immune cells induce tumor cell death. The production of inflammatory molecules during pyroptosis may either enhance the anti-tumor immune response or have detrimental effects on patients by triggering inflammatory cascades. For example, the granzymes generated by CD8 + T cells and NK cells have the ability to cleave GSDMB/E, resulting in the pyroptosis of cancer cells. Conversely, factors released during pyroptosis by cancer cells can induce pyroptosis in macrophages, causing the release of cytokines and subsequent cytokine release syndrome [23, 35, 36]. Given that pyroptosis plays a pivotal role in controlling tumor immunity, it is plausible that this may serve as a crucial connection point between tumor cells and pyroptosis. Hence, we have decided to conduct a thorough investigation into the gene profile of PRlncRNA in STAD. Our aim is to determine whether these lncRNAs can be employed as reliable indications for predicting the STAD prognosis, as well as their involvement in the initiation, progression, TME, and immunotherapy of STAD.
We included a total of 373 samples, consisting of 406 individuals with STAD. Our work focused on 35 PRR and 13,162 lncRNAs in order to investigate the particular significance of PRlncRNA in STAD. Forty-nine lncRNAs that had a strong correlation with OS were chosen. These lncRNAs showed substantial variation in expression levels between tumor tissues and neighboring mucosal tissues. Subsequently, a risk model was developed using the LASSO approach, using 21 out of 49 predictive PRlncRNA. During the KM analysis, it was shown that patients with poor RSs had substantially longer OS compared to patients with high RSs in both the training group and the test group. Furthermore, the ROC curve analysis validated that the PRLPS had excellent predictive performance, making it a greatly accurate and sensitive prognostic model for patients with STAD. Furthermore, we used UCR and MCR to assess the potential of PRLPS as an autonomous prognostic factor for STAD. The findings demonstrated that these 21 lncRNAs were essential in pyroptosis and were important prognostic indicators in STAD. Moreover, many risk subgroups categorized by the PRLPS exhibited distinct clinical features, including grade, clinical stage, and stage N. The PRLPS may also function as a predictive marker for OS in some patient subgroups with distinct clinical features, particularly those related to age, sex, grade, and stages III-IV, T3-4, M, and N1-3.
Notably, distinct risk subgroups showed significant associations with various TME scores, ICC, and ICG expression. This suggests that PRlncRNA may have a crucial regulatory function in the TME and immune response in STAD. The HRG exhibited heightened stromal score, heightened immune score, and reduced tumor purity, indicating the facilitating influence of stromal cells and immunological fatigue in STAD. The cancer cells in a tumor lose the ability to respond to normalizing signals from the surrounding microenvironment, disrupting the intercellular interactions between cells that are typically seen in healthy tissues [37]. For example, cancer-associated fibroblasts, the most abundant stromal cell, play functions in promoting tumorigenesis and metastasis by the remodeling of the extracellular matrix [38]. As for ICC, the HRG was significantly positively linked to M2 Macrophages. Macrophages, the most abundant immune cells, are classified into two main types: M1 and M2. M2 is the key contributor to the tumorigenesis and development of STAD because it could inhibit the T cell-mediated anti-tumor immune response, promote angiogenesis, and contribute to the remodeling of TME [39, 40]. We reported that pyroptosis contributes to the polarization of macrophages in the TME of STAD. Moreover, neutrophils, the most abundant phagocytes in humans, are able to undergo pyroptosis and pyroptosis resistance [41]. Our outcomes manifested that the patients with high neutrophil counts had a worse prognosis, which implied that the drug-promoting neutrophil pyroptosis might improve the STAD patient's prognosis. Furthermore, numerous prominent ICGs were significantly overexpressed in the HRG. Therefore, because of the blockade of immune checkpoints, the ICC in TME is unable to lead the anti-tumor immune response, which is called immune exhaustion. Concerning the response to ICIs, We identified the disparity between the HRG and low-risk groups. These results demonstrate that pyroptosis plays a crucial role in the malfunction of immune cells in the TME and the effectiveness of immunotherapy in STAD patients.
To comprehensively analyze the latent PRlncRNA functions in STAD, a ceRNA network comprising 3 lncRNAs, 11 miRNAs, and 69 mRNAs was established, and significant DEGs between different risk subgroups were screened out. With the 3 key PRlncRNA found in STAD, lncRNA ST3GAL6-AS1 has been discovered to be connected to colorectal cancer and multiple myeloma and could promote tumor progression by regulating alpha-2,3 sialylation via PI3K/Akt signaling or binding with hnRNPA2B1 to regulate ST3GAL6 expression [42, 43]. LINC00449 exerts a carcinogenic effect on acute myeloid leukemia through LINC00449/miR-150/FOXD3 signaling pathway [44]. KEGG pathway showed that 69 target mRNAs and genes that were significantly differentially expressed between different risk subgroups were enriched in many crucial pathways correlated with the tumorigenesis and development of GC [45–47], including “P53 signaling pathway,” “Cell cycle,” “PI3K-Akt signaling pathway,” “Wnt signaling pathway,” and so on. GSEA was employed to functionally annotate genes in various risk subgroups. The genes belonging to the HRG were also shown to have a higher concentration in the cancer-related pathways, such as “Focal adhesion,” “ECM-receptor interaction,” “JAK-STAT signaling pathway,” and “Cell adhesion molecules.”
Additionally, we conducted a thorough examination of a group of potential medications that were highly probable to restore aberrant gene expression in STAD. The aforementioned medications are nonconventional anti-tumor drugs, although there exists enough data substantiating their impact on malignant cells. Monensin, an ionophoric antibiotic isolated from Streptomyces cinnamonensis with pronounced antibacterial and chemotherapeutic potential [48], is the most studied drug and could suppress the proliferation and migration of different cancer cells, including breast cancer [49], pancreatic cancer [50], and glioblastoma [51]. In addition, by integrating a traceable reporter system that relies on the activity of SOX2/OCT4 with a large-scale screening of pharmacologically active small molecules, monensin was identified and displayed selective toxicity to SORE6 + gastric cancer stem cells [52]. Hence, it is essential to conduct more research and clinical trials to investigate and test the medications that have the potential to be effective for individuals in the HRG.
Nevertheless, our study does have some limitations. Firstly, there are many pyroptosis-related genes reported in the literature, and we only selected the pyroptosis-related genes that had been well studied or were frequently reported. Secondly, our study relies on the online database, and it is essential to conduct extensive clinical cohort evaluations in order to validate the predictive efficacy of the PRLPS model in the future. Thirdly, our study mostly concentrated on doing bioinformatic analysis. However, there is a pressing need for further experimental investigations to investigate the precise function of PRlncRNA in STAD.
Conclusion
In this study, we constructed a prognostic signature consisting of 21 pyroptosis-related lncRNAs based on TCGA database, which had a robust ability in predicting the OS of patients with STAD, clinicopathological features, immune landscape, and the response to ICIs. In addition, biological processes and pathways correlated with pyroptosis-related lncRNAs were screened, which improved our understanding of the function of pyroptosis-related lncRNAs in the tumorigenesis and development of STAD. This work also provides pivotal evidence for the development of predictive biomarkers, chemotherapeutic drugs, and immunotherapy for STAD.
Acknowledgements
This study benefited from the Cancer Genome Atlas (TCGA) databases. We appreciate the data platform and the authors up-loaded their data.
Author contributions
HH, YH, and HL conceived and designed the study. HH, YH, XJ and ZY organized the database, performed statistical analyses, and prepared the figures and tables and were involved in manuscript writing. HH and YH wrote the first draft of the manuscript. HH, YH, and HL revised and proofread the manuscript. All authors contributed to manuscript revision and approved the submitted version.
Funding
This study was supported by The National Natural Science Foundation (No. 82205047), Basic and Applied Basic Research Fund Project of Guangdong Province (2020A1515110615), Guangzhou Basic and Applied Basic Research Project (SL2024A04J00884) and Medical Research Foundation of Guangdong Province (B2020043).
Data availability
Publicly available datasets were analyzed in this study, which can be found in the Cancer Genome Atlas (TCGA) database.
Declarations
Ethical approval
This study met the publication guidelines stated by TCGA (https://cancergenome.nih.Gov/publications/publicationguidelines). All data used in the study were obtained from TCGA. Ethics approval and patients’ consent were not required.
Conflicts of interest
The authors declare that the research was conducted in the absence of any commercial or financial relationships that could be construed as a potential conflict of interest. The authors declare no competing interests.
Patient consent for publication
Not applicable.
Footnotes
Publisher's Note
Springer Nature remains neutral with regard to jurisdictional claims in published maps and institutional affiliations.
Haidu Hong and Yuancheng Huang have contributed equally to this work and share first authorship.
References
- 1.Bray F, Laversanne M, Sung H, et al. Global cancer statistics 2022: GLOBOCAN estimates of incidence and mortality worldwide for 36 cancers in 185 countries. CA Cancer J Clin. 2024;74(3):229–63. 10.3322/caac.21834. [DOI] [PubMed] [Google Scholar]
- 2.Rugge M, Meggio A, Pravadelli C, Barbareschi M, Fassan M, Gentilini M, et al. Gastritis staging in the endoscopic follow-up for the secondary prevention of gastric cancer: a 5-year prospective study of 1755 patients. Gut. 2019;68:11–7. 10.1136/gutjnl-2017-314600. [DOI] [PubMed] [Google Scholar]
- 3.Digklia A, Wagner AD. Advanced gastric cancer: current treatment landscape and future perspectives. World J Gastroenterol. 2016;22:2403–14. 10.3748/wjg.v22.i8.2403. [DOI] [PMC free article] [PubMed] [Google Scholar]
- 4.Lu X, Guo T, Zhang X. Pyroptosis in cancer: friend or foe? Cancers. 2021;13:3620. 10.3390/cancers13143620. [DOI] [PMC free article] [PubMed] [Google Scholar]
- 5.Kovacs SB, Miao EA. Gasdermins: effectors of pyroptosis. Trends Cell Biol. 2017;27:673–84. 10.1016/j.tcb.2017.05.005. [DOI] [PMC free article] [PubMed] [Google Scholar]
- 6.Xia X, Wang X, Cheng Z, Qin W, Lei L, Jiang J, et al. The role of pyroptosis in cancer: pro-cancer or pro-“host”? Cell Death Dis. 2019. 10.1038/s41419-019-1883-8. [DOI] [PMC free article] [PubMed] [Google Scholar]
- 7.Tan Y, Chen Q, Li X, Zeng Z, Xiong W, Li G, et al. Pyroptosis: a new paradigm of cell death for fighting against cancer. J Exp Clin Canc Res. 2021. 10.1186/s13046-021-01959-x. [DOI] [PMC free article] [PubMed] [Google Scholar]
- 8.Fang Y, Tian S, Pan Y, Li W, Wang Q, Tang Y, et al. Pyroptosis: a new frontier in cancer. Biomed Pharmacother. 2020;121: 109595. 10.1016/j.biopha.2019.109595. [DOI] [PubMed] [Google Scholar]
- 9.Yu P, Zhang X, Liu N, Tang L, Peng C, Chen X. Pyroptosis: mechanisms and diseases. Signal Transduct Target Ther. 2021;6:128. 10.1038/s41392-021-00507-5. [DOI] [PMC free article] [PubMed] [Google Scholar]
- 10.Sugano K, Tack J, Kuipers EJ, Graham DY, El-Omar EM, Miura S, et al. Kyoto global consensus report onHelicobacter pylori gastritis. Gut. 2015;64:1353–67. 10.1136/gutjnl-2015-309252. [DOI] [PMC free article] [PubMed] [Google Scholar]
- 11.Zhou C, Fang J. The role of pyroptosis in gastrointestinal cancer and immune responses to intestinal microbial infection. Biochim Biophys Acta (BBA) Rev Cancer. 2019;1872:1–10. 10.1016/j.bbcan.2019.05.001. [DOI] [PubMed] [Google Scholar]
- 12.Li S, Liang X, Ma L, Shen L, Li T, Zheng L, et al. MiR-22 sustains NLRP3 expression and attenuates HPylori-induced gastric carcinogenesis. Oncogene. 2018;37:884–96. 10.1038/onc.2017.381. [DOI] [PubMed] [Google Scholar]
- 13.Xie S, Chang Y, Jin H, Yang F, Xu Y, Yan X, et al. Non-coding RNAs in gastric cancer. Cancer Lett. 2020;493:55–70. 10.1016/j.canlet.2020.06.022. [DOI] [PubMed] [Google Scholar]
- 14.Huang J, Chen YX, Zhang B. IGF2-AS affects the prognosis and metastasis of gastric adenocarcinoma via acting as a ceRNA of miR-503 to regulate SHOX2. Gastric Cancer. 2020;23:23–38. 10.1007/s10120-019-00976-2. [DOI] [PubMed] [Google Scholar]
- 15.He D, Zheng J, Hu J, Chen J, Wei X. Long non-coding RNAs and pyroptosis. Clin Chim Acta. 2020;504:201–8. 10.1016/j.cca.2019.11.035. [DOI] [PubMed] [Google Scholar]
- 16.Ren N, Jiang T, Wang C, Xie S, Xing Y, Piao D, et al. LncRNA ADAMTS9-AS2 inhibits gastric cancer (GC) development and sensitizes chemoresistant GC cells to cisplatin by regulating miR-223-3p/NLRP3 axis. Aging (Albany NY). 2020;12:11025–41. 10.18632/aging.103314. [DOI] [PMC free article] [PubMed] [Google Scholar]
- 17.Zhao Q, Ye Y, Zhang Q, Wu Y, Wang G, Gui Z, Zhang M. PANoptosis-related long non-coding RNA signature to predict the prognosis and immune landscapes of pancreatic adenocarcinoma. Biochem Biophys Rep. 2023;7(37): 101600. 10.1016/j.bbrep.2023.101600. [DOI] [PMC free article] [PubMed] [Google Scholar]
- 18.Bao L, Ye Y, Zhang X, Xu X, Wang W, Jiang B. Identification and verification of a PANoptosis-related long noncoding ribonucleic acid signature for predicting the clinical outcomes and immune landscape in lung adenocarcinoma. Heliyon. 2024;10(8):e29869. 10.1016/j.heliyon.2024.e29869. [DOI] [PMC free article] [PubMed] [Google Scholar]
- 19.Jiang Y, Ye Y, Huang Y, Wu Y, Wang G, Gui Z, Zhang M, Zhang M. Identification and validation of a novel anoikis-related long non-coding RNA signature for pancreatic adenocarcinoma to predict the prognosis and immune response. J Cancer Res Clin Oncol. 2023;149(16):15069–83. 10.1007/s00432-023-05285-x. [DOI] [PMC free article] [PubMed] [Google Scholar]
- 20.Mortazavi A, Williams BA, McCue K, Schaeffer L, Wold B. Mapping and quantifying mammalian transcriptomes by RNA-Seq. Nat Methods. 2008;5:621–8. 10.1038/nmeth.1226. [DOI] [PubMed] [Google Scholar]
- 21.Ye Y, Dai Q, Qi H. A novel defined pyroptosis-related gene signature for predicting the prognosis of ovarian cancer. Cell Death Discov. 2021. 10.1038/s41420-021-00451-x. [DOI] [PMC free article] [PubMed] [Google Scholar]
- 22.Shao W, Yang Z, Fu Y, Zheng L, Liu F, Chai L, et al. The Pyroptosis-Related signature predicts prognosis and indicates immune microenvironment infiltration in gastric cancer. Front Cell Dev Biol. 2021. 10.3389/fcell.2021.676485. [DOI] [PMC free article] [PubMed] [Google Scholar]
- 23.Zhou Z, He H, Wang K, Shi X, Wang Y, Su Y, et al. Granzyme a from cytotoxic lymphocytes cleaves GSDMB to trigger pyroptosis in target cells. Science. 2020. 10.1126/science.aaz7548. [DOI] [PubMed] [Google Scholar]
- 24.Karki R, Kanneganti TD. Diverging inflammasome signals in tumorigenesis and potential targeting. Nat Rev Cancer. 2019;19:197–214. 10.1038/s41568-019-0123-y. [DOI] [PMC free article] [PubMed] [Google Scholar]
- 25.Hanley JA, McNeil BJ. The meaning and use of the area under a receiver operating characteristic (ROC) curve. Radiology. 1982;143:29–36. 10.1148/radiology.143.1.7063747. [DOI] [PubMed] [Google Scholar]
- 26.Simon N, Friedman J, Hastie T, Tibshirani R. Regularization paths for Cox’s proportional hazards model via coordinate descent. J Stat Softw. 2011;39:1–13. 10.18637/jss.v039.i05. [DOI] [PMC free article] [PubMed] [Google Scholar]
- 27.Newman AM, Steen CB, Liu CL, Gentles AJ, Chaudhuri AA, Scherer F, et al. Determining cell type abundance and expression from bulk tissues with digital cytometry. Nat Biotechnol. 2019;37:773–82. 10.1038/s41587-019-0114-2. [DOI] [PMC free article] [PubMed] [Google Scholar]
- 28.Yoshihara K, Shahmoradgoli M, Martínez E, Vegesna R, Kim H, Torres-Garcia W, et al. Inferring tumour purity and stromal and immune cell admixture from expression data. Nat Commun. 2013;4:2612. 10.1038/ncomms3612. [DOI] [PMC free article] [PubMed] [Google Scholar]
- 29.Lamb J, Crawford ED, Peck D, Modell JW, Blat IC, Wrobel MJ, et al. The connectivity map: using gene-expression signatures to connect small molecules, genes, and disease. Science. 2006;313:1929–35. 10.1126/science.1132939. [DOI] [PubMed] [Google Scholar]
- 30.Smyth EC, Nilsson M, Grabsch HI, van Grieken NC, Lordick F. Gastric cancer. Lancet. 2020;396:635–48. 10.1016/S0140-6736(20)31288-5. [DOI] [PubMed] [Google Scholar]
- 31.Bergsbaken T, Fink SL, Cookson BT. Pyroptosis: host cell death and inflammation. Nat Rev Microbiol. 2009;7:99–109. 10.1038/nrmicro2070. [DOI] [PMC free article] [PubMed] [Google Scholar]
- 32.Pachathundikandi SK, Blaser N, Bruns H, Backert S. Helicobacter pylori avoids the critical activation of NLRP3 Inflammasome-Mediated production of oncogenic mature IL-1β in human immune cells. Cancers (Basel). 2020. 10.3390/cancers12040803. [DOI] [PMC free article] [PubMed] [Google Scholar]
- 33.Kayagaki N, Stowe IB, Lee BL, O’Rourke K, Anderson K, Warming S, et al. Caspase-11 cleaves gasdermin D for non-canonical inflammasome signalling. Nature. 2015;526:666–71. 10.1038/nature15541. [DOI] [PubMed] [Google Scholar]
- 34.Wang Y, Yin B, Li D, Wang G, Han X, Sun X. GSDME mediates caspase-3-dependent pyroptosis in gastric cancer. Biochem Biophys Res Commun. 2018;495:1418–25. 10.1016/j.bbrc.2017.11.156. [DOI] [PubMed] [Google Scholar]
- 35.Zhang Z, Zhang Y, Xia S, Kong Q, Li S, Liu X, et al. Gasdermin E suppresses tumour growth by activating anti-tumour immunity. Nature. 2020;579:415–20. 10.1038/s41586-020-2071-9. [DOI] [PMC free article] [PubMed] [Google Scholar]
- 36.Liu Y, Fang Y, Chen X, Wang Z, Liang X, Zhang T, et al. Gasdermin E-mediated target cell pyroptosis by CAR T cells triggers cytokine release syndrome. Sci Immunol. 2020. 10.1126/sciimmunol.aax7969. [DOI] [PubMed] [Google Scholar]
- 37.Quail DF, Joyce JA. Microenvironmental regulation of tumor progression and metastasis. Nat Med. 2013;19:1423–37. 10.1038/nm.3394. [DOI] [PMC free article] [PubMed] [Google Scholar]
- 38.Joshi RS, Kanugula SS, Sudhir S, Pereira MP, Jain S, Aghi MK. The role of cancer-associated fibroblasts in tumor progression. Cancers (Basel). 2021. 10.3390/cancers13061399. [DOI] [PMC free article] [PubMed] [Google Scholar]
- 39.Oya Y, Hayakawa Y, Koike K. Tumor microenvironment in gastric cancers. Cancer Sci. 2020;111:2696–707. 10.1111/cas.14521. [DOI] [PMC free article] [PubMed] [Google Scholar]
- 40.Pan Y, Yu Y, Wang X, Zhang T. Tumor-Associated macrophages in tumor immunity. Front Immunol. 2020;11: 583084. 10.3389/fimmu.2020.583084. [DOI] [PMC free article] [PubMed] [Google Scholar]
- 41.Sollberger G. Approaching neutrophil pyroptosis. J Mol Biol. 2022;434: 167335. 10.1016/j.jmb.2021.167335. [DOI] [PubMed] [Google Scholar]
- 42.Shen Y, Feng Y, Li F, Jia Y, Peng Y, Zhao W, et al. LncRNA ST3GAL6-AS1 promotes invasion by inhibiting hnRNPA2B1-mediated ST3GAL6 expression in multiple myeloma. Int J Oncol. 2021. 10.3892/ijo.2021.5185. [DOI] [PMC free article] [PubMed] [Google Scholar]
- 43.Hu J, Shan Y, Ma J, Pan Y, Zhou H, Jiang L, et al. LncRNA ST3Gal6-AS1/ST3Gal6 axis mediates colorectal cancer progression by regulating α-2,3 sialylation via PI3K/Akt signaling. Int J Cancer. 2019;145:450–60. 10.1002/ijc.32103. [DOI] [PubMed] [Google Scholar]
- 44.Shi Y, Zhu Y, Zheng X, Zheng Z. LINC00449 regulates the proliferation and invasion of acute monocytic leukemia and predicts favorable prognosis. J Cell Physiol. 2020;235:6536–47. 10.1002/jcp.29487. [DOI] [PubMed] [Google Scholar]
- 45.Baghery SKA, Pourbagheri-Sigaroodi A, Pirsalehi A, Safaroghli-Azar A, Zali MR, Bashash D. The PI3K/Akt/mTOR signaling pathway in gastric cancer; from oncogenic variations to the possibilities for pharmacologic interventions. Eur J Pharmacol. 2021;898: 173983. 10.1016/j.ejphar.2021.173983. [DOI] [PubMed] [Google Scholar]
- 46.Flanagan DJ, Vincan E, Phesse TJ. Winding back Wnt signalling: potential therapeutic targets for treating gastric cancers. Br J Pharmacol. 2017;174:4666–83. 10.1111/bph.13890. [DOI] [PMC free article] [PubMed] [Google Scholar]
- 47.Shi J. Pathogenetic mechanisms in gastric cancer. World J Gastroentero. 2014;20:13804. 10.3748/wjg.v20.i38.13804. [DOI] [PMC free article] [PubMed] [Google Scholar]
- 48.Rajendran V, Ilamathi HS, Dutt S, Lakshminarayana TS, Ghosh PC. Chemotherapeutic potential of monensin as an anti-microbial agent. Curr Top Med Chem. 2018;18:1976–86. 10.2174/1568026619666181129141151. [DOI] [PubMed] [Google Scholar]
- 49.Gu J, Huang L, Zhang Y. Monensin inhibits proliferation, migration, and promotes apoptosis of breast cancer cells via downregulating UBA2. Drug Dev Res. 2020;81:745–53. 10.1002/ddr.21683. [DOI] [PubMed] [Google Scholar]
- 50.Wang X, Wu X, Zhang Z, Ma C, Wu T, Tang S, et al. Monensin inhibits cell proliferation and tumor growth of chemo-resistant pancreatic cancer cells by targeting the EGFR signaling pathway. Sci Rep. 2018;8:17914. 10.1038/s41598-018-36214-5. [DOI] [PMC free article] [PubMed] [Google Scholar]
- 51.Wan W, Zhang X, Huang C, Chen L, Yang X, Bao K, et al. Monensin inhibits glioblastoma angiogenesis via targeting multiple growth factor receptor signaling. Biochem Biophys Res Commun. 2020;530:479–84. 10.1016/j.bbrc.2020.05.057. [DOI] [PubMed] [Google Scholar]
- 52.Pádua D, Barros R, Amaral AL, Mesquita P, Freire AF, Sousa M, et al. A SOX2 reporter system identifies gastric cancer Stem-Like cells sensitive to monensin. Cancers (Basel). 2020. 10.3390/cancers12020495. [DOI] [PMC free article] [PubMed] [Google Scholar]
Associated Data
This section collects any data citations, data availability statements, or supplementary materials included in this article.
Data Availability Statement
Publicly available datasets were analyzed in this study, which can be found in the Cancer Genome Atlas (TCGA) database.


