Abstract
This study aimed to investigate the regulatory mechanisms that influenced autophagy in Steroid-induced necrosis of the femoral head (SONFH) by constructing a competing endogenous RNA (ceRNA) network. Blood sample data from the SONFH patients were obtained from the Gene Expression Omnibus (GEO) database under the accession number GSE123568. Autophagy-related genes were identified from the Human Autophagy Database (HADb). Differential analysis and weighted gene co-expression network analysis (WGCNA) were performed on the GSE123568 dataset to screen for core genes and validation was performed with the validation set. Based on the GEO dataset (GSE74089), we performed differential lncRNA analysis. Meanwhile, we utilized three databases, namely miRDB, TargetScan, and StarBase, to predict the miRNAs of target genes and corresponding lncRNAs. Cytoscape software was used to construct and visualize the ceRNA networks. We also employed reverse transcription-quantitative polymerase chain reaction (RT-qPCR) to quantify their expression levels. A total of 1692 differentially expressed genes (DEGs) were identified in the GSE123568 dataset. By intersecting with the HADb database, 47 autophagy-related genes were identified from these DEGs. Furthermore, we found the significant correlation between RNF144B and 37 autophagy genes. Importantly, we established a regulatory axis involving TUG1, hsa-miR-31-5p, and RNF144B., and both TUG1 and RNF144B were upregulated, while hsa-miR-31-5p was downregulated in the SONFH cell model. A TUG1-hsa-miR-31-5p-RNF144B axis was related to autophagy genes, which potentially provided insights into the RNA interactions triggering autophagy in SONFH.
Keywords: Steroid-induced osteonecrosis of the femoral head, CeRNA, Autophagy, RNF144B
Subject terms: Biological techniques, Cell biology, Computational biology and bioinformatics, Molecular biology, Medical research, Molecular medicine
Introduction
Steroid-induced osteonecrosis of the femoral head (SONFH) is a chronic and progressive condition that disrupts the blood supply to the femoral head, leading to bone cell death and loss of bone marrow components. The pathology of SONFH arises as a consequence of glucocorticoid medication usage1,2, which can lead to degeneration and dysfunction of hip joints if left untreated3,4. Unfortunately, the pathogenesis of SONFH remains enigmatic, necessitating urgent exploration into its molecular etiology and identification of novel biomarkers for early diagnosis and personalized treatment.
Autophagy is a cellular process that degrades and removes dysfunctional components and damaged proteins through the lysosomal pathway, playing a crucial role in maintaining cellular health5. It also plays a pivotal role in governing diverse biological processes, including stress adaptation, organelle maintenance, protein quality control, development, and immune response6,7. Therefore, the profound significance of autophagy for cellular survival, adaptation, and overall health is unequivocal8. Understanding the mechanisms of autophagy in SONFH could lead to new therapeutic strategies. However, certain genes implicated in the regulation of SONFH autophagy remain unidentified and warrant further investigation.
In addition, long noncoding RNAs (lncRNAs) are RNA molecules that lack protein-coding ability and have a length exceeding 200 nucleotides9. Recent studies have extensively demonstrated the functional role of lncRNAs as miRNA sponges, competitively binding with miRNAs to modulate gene expression. This intricate interplay between mRNAs, lncRNAs, and miRNAs is commonly referred to as ceRNAs network10. A growing body of research suggests that lncRNA-related ceRNA regulatory networks play an important role in the pathogenesis of various diseases11. However, to date, research on the role of lncRNA-related ceRNA regulatory networks in SONFH is rare.
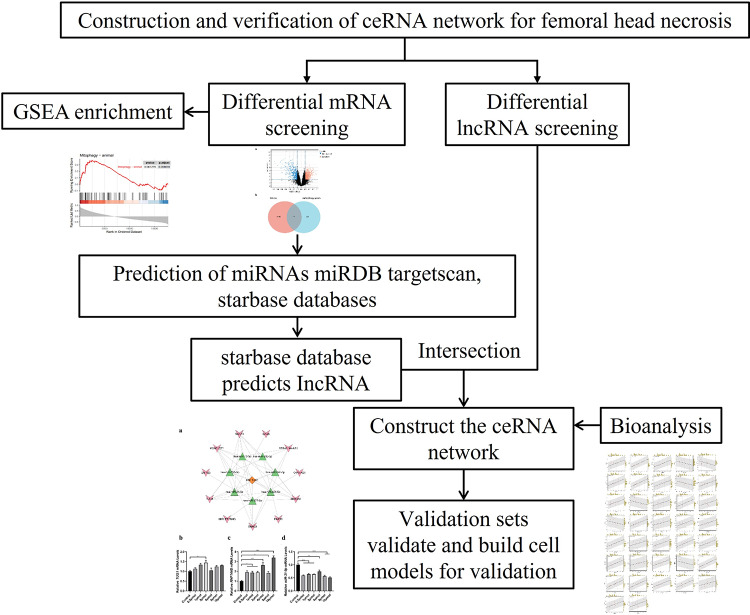
In this study, mRNA expression data from SONFH samples were downloaded from the GEO database, autophagy genes associated with SONFH were downloaded from the HADb, and DEGs and differential lncRNAs between SONFH samples and control samples were analyzed. Functional enrichment of hub genes was analyzed using GSEA in R packages. WGCNA of the DEG matrix identified modules related to the clinical characteristics of SONFH patients. Hub genes identified through these bioinformatics analyses were verified using ROC curves. Meanwhile, we utilized three databases, namely miRDB, TargetScan, and StarBase, to predict the miRNAs of target genes and corresponding lncRNAs. Furthermore, the ceRNA network was constructed using Cytoscape software. Our findings may provide a testable hypothesis regarding the role of autophagy-related genes in SONFH, which may significantly contribute to understanding the pathogenesis of SONFH. The flowchart was shown in Fig. 1.
Fig. 1.
The flowchart—Integrated analysis ceRNA network of autophagy-related gene RNF144B in Steroid-Induced Necrosis of the Femoral Head.
Results
Identification of DEGs and screening autophagy-related genes
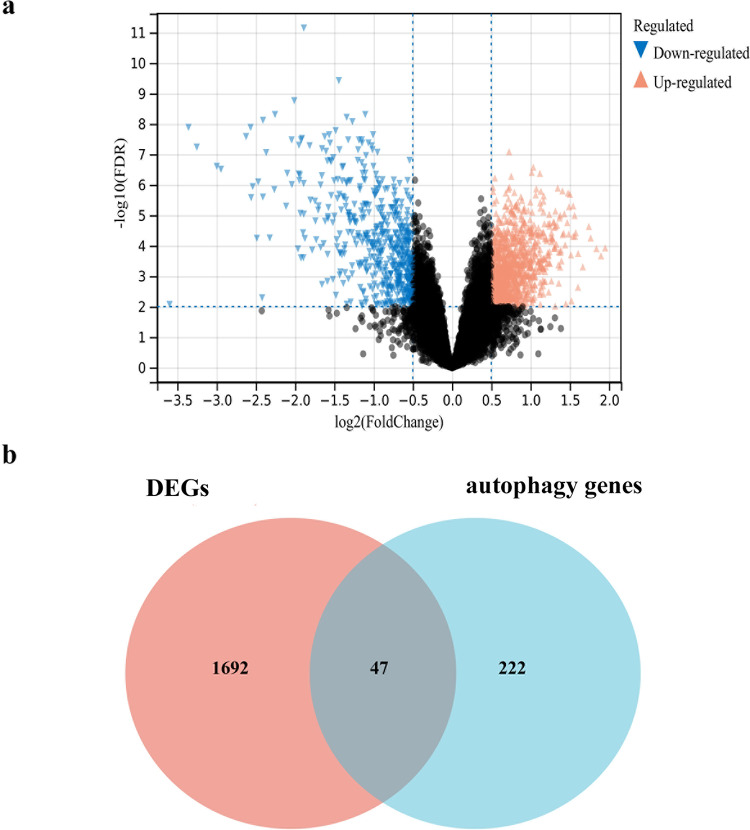
The GSE123568 dataset was selected for the analysis and identification of differentially expressed genes (DEGs). A total of 1692 DEGs were identified in SONFH samples compared to control samples. Among these, 1142 DEGs exhibited up-regulation, while 550 DEGs showed down-regulation, as shown in Fig. 2a. To investigate the association between SONFH and autophagy and elucidate whether autophagy was implicated in the development of SONFH, we retrieved a set of 222 autophagy genes from HADb and then intersected them with the pool of 1692 DEGs, resulting in the identification of 47 autophagy-related genes (Fig. 2b).
Fig. 2.
Identification of DEGs and screening of autophagy genes. (a) DEGs volcano plot between SONFH samples and control samples. The red graph shows up-regulated genes, the black graph shows non-significant genes, and the green graph shows down-regulated genes. (b) Wayne diagram. Red represents DEGs, blue represents downloaded autophagy genes. The intersection part is the autophagy genes related to SONFH.
Screening and validation of hub genes
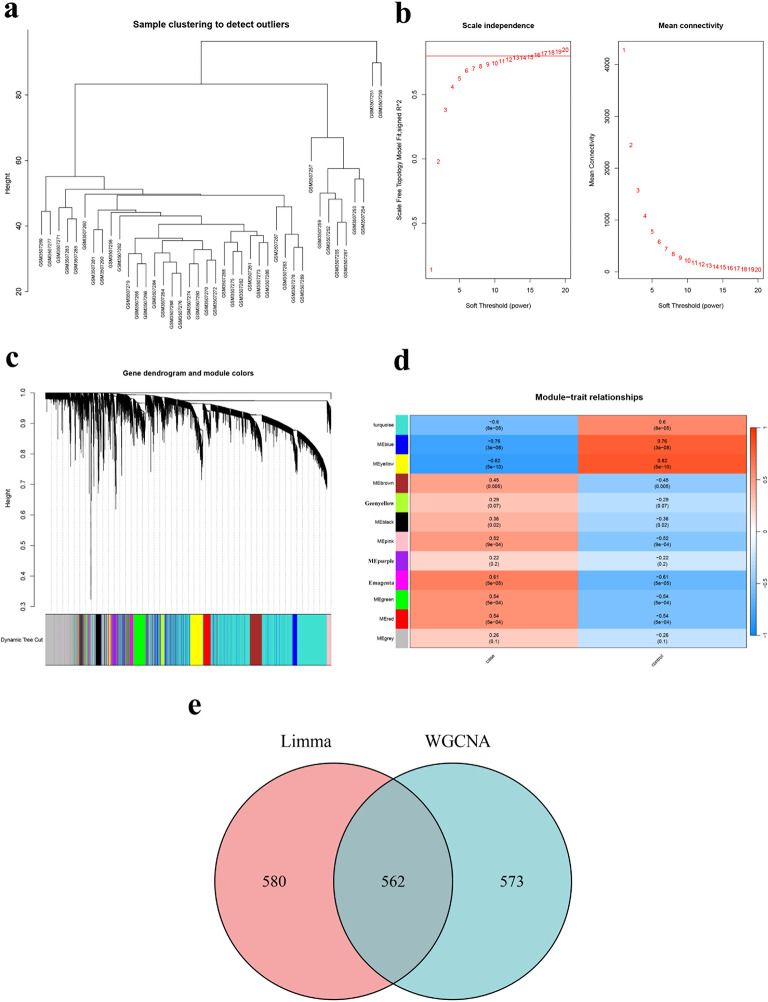
The genes associated with SONFH were further screened using the GSE123568 dataset through WGCNA. As shown in Fig. 3a, the cluster analysis of all samples revealed poor clustering for GSM3507251 and GSM3507256, leading to their exclusion from the subsequent WGCNA. A soft threshold of 16 (R2 = 0.8) was set to construct a scale-free network (Fig. 3b). By setting the minimum number of genes in a module to 100, a total of 12 co-expression modules were identified within the weighted gene co-expression network (Fig. 3c). Furthermore, an examination of module correlations highlighted magenta, MEgreen, and MEred as exhibiting the highest correlation with SONFH (Fig. 3d), Consequently, these three modules encompassed a total of 1,135 target genes.
Fig. 3.
Identification of target genes by WGCNA. (a) Sample clustering analysis revealed that GSM3507251 and GSM3507256 samples was an outlier. (b) Soft threshold analysis suggested that gene associations were maximally consistent with the scale-free distribution and when soft threshold to 16. (c) Modules identified by merging modules with feature factors greater than 0.5 and setting the minimum number of genes in a module as 100. (d) Correlation between modules and SONFH. (e) The 1,135 target genes were taken to intersect with the up-regulated DEGs.
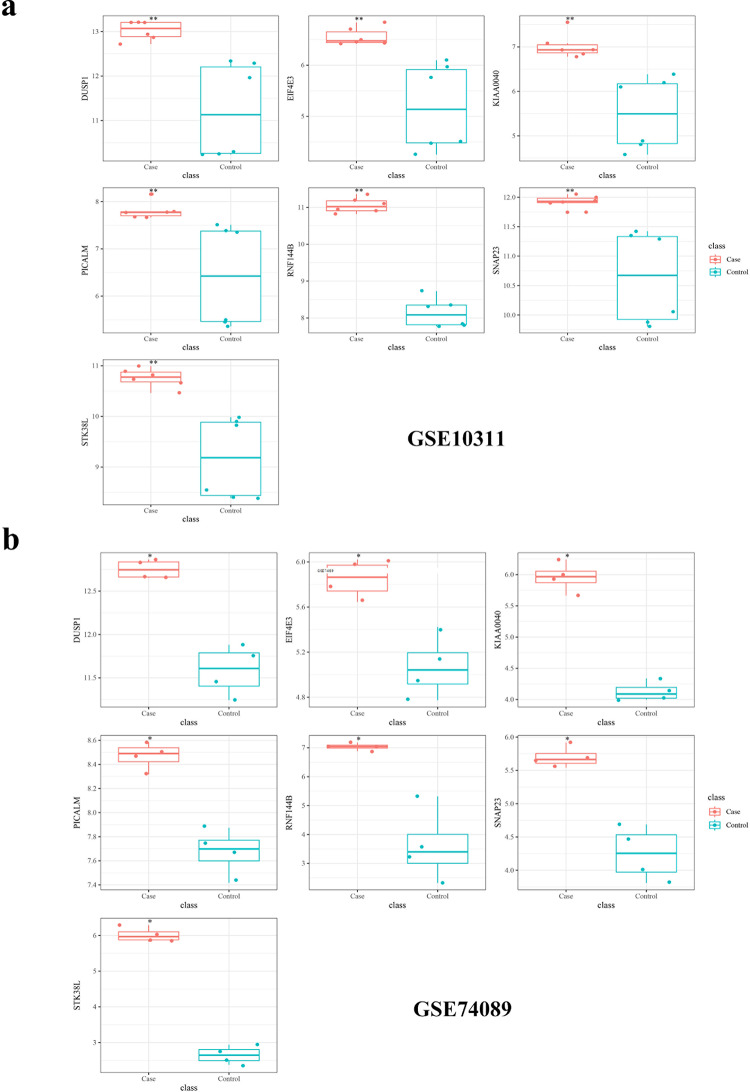
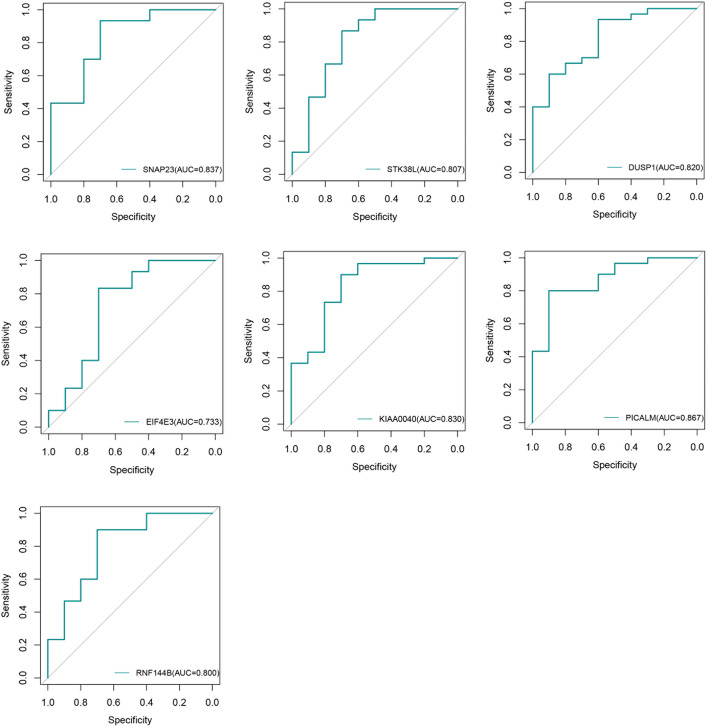
Finally, the intersection of the up-regulated DEGs with the initial pool of 1,135 target genes yielded a set of 562 hub genes (Fig. 3e). Subsequently, a comprehensive search was conducted on the Genecard database to identify genes associated with osteonecrosis of the femoral head, resulting in the identification and exclusion of previously studied genes from this pool, leaving us with a refined set of 457 unstudied candidate genes. The expression of 457 specific genes was validated using GEO datasets, namely GSE74089 and GSE10311. Analysis of the data revealed a trend of up-regulation and identified seven genes that showed significant differences: DUSP1, EIF4E3, KIAA0040, PICALM, RNF144B, SNAP23, and STK38L, as shown in Fig. 4. We generated ROC curves for each of the seven genes and the results were as follows: SNAP23 (AUC = 0.837), STK38L (AUC = 0.807), DUSP1 (AUC = 0.820), EIF4E3 (AUC = 0.733), KIAA0040 (AUC = 0.830), PICALM (AUC = 0.867), RNF144B (AUC = 0.800) (Fig. 5). These findings proved that the above genes have certain diagnostic value.
Fig. 4.
GEO database validation. (a) GSE10311 validation results. (b) GSE10311 validation results.
Fig. 5.
ROC curve of the hub gene: SNAP23(AUC = 0.837), STK38L(AUC = 0.807), DUSP1(AUC = 0.820), EIF4E3(AUC = 0.733), KIAA0040(AUC = 0.830), PICALM(AUC = 0.867), RNF144B(AUC = 0.800).
Gene set enrichment analysis
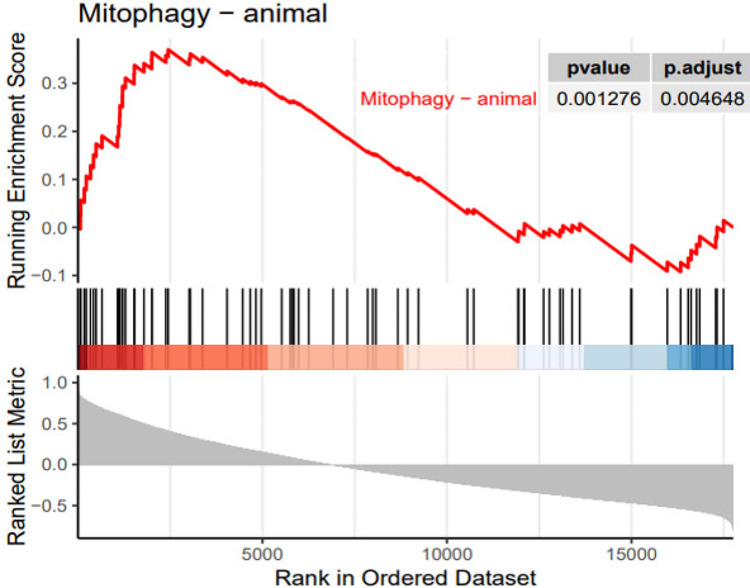
RNF144B, also known as PIR2 and IBRDC2, functions as an E3 ubiquitin ligase12. It played a crucial role in the apoptotic process and negatively regulates ubiquitin-dependent proteolysis and metabolism13. In view of the lack of research on RNF144B in femoral head necrosis and related diseases, we performed a specific single gene enrichment analysis for RNF144B. GSEA enrichment analysis revealed significant enrichment of pathways, primarily associated with autophagy (Fig. 6).
Fig. 6.
GSEA enrichment analyses of RNF144B.
Correlation analysis of RNF144B and autophagy genes
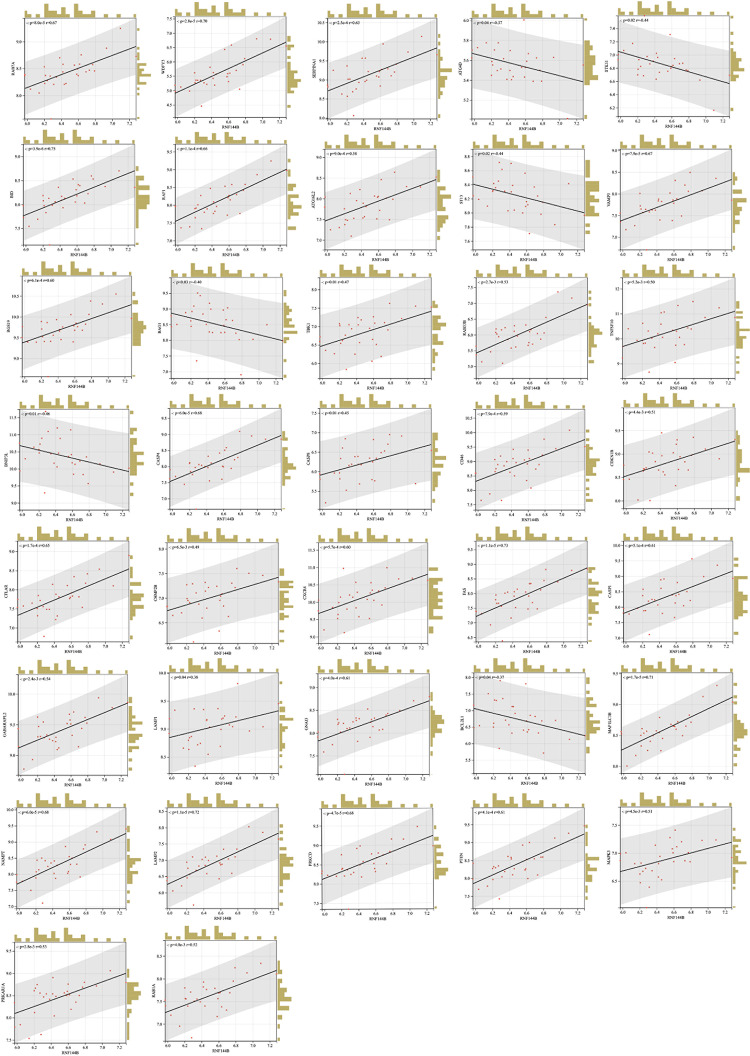
GSEA pathway enrichment analysis of RNF144B showed that it was associated with the autophagy pathway. Therefore, we correlated RNF144B with 47 individual autophagy genes that were screened and visualized at the SangerBox website. By Spearman correlation analysis, we found that 37 autophagy genes were significantly correlated with RNF144B (Fig. 7). This finding suggested that RNF144B may influence the onset and development of SONFH by regulating mitochondrial function and cellular autophagy.
Fig. 7.
Correlation of RNF144B with autophagy genes in SONFH.
Construction of lncRNA-miRNA-mRNA ceRNA network in SONFH
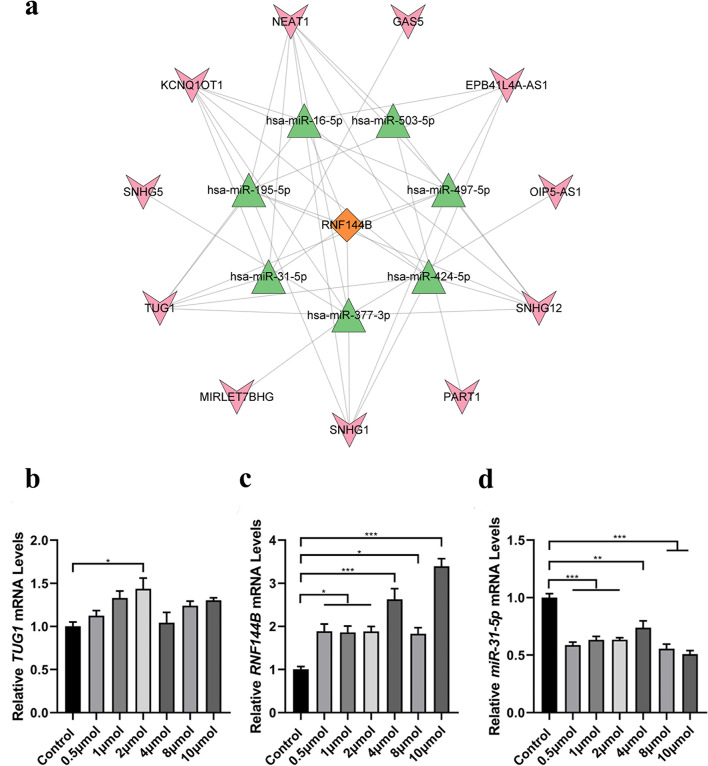
Based on the GEO dataset (GSE74089), we first performed differential lncRNA analysis. Meanwhile, we utilized three databases, namely miRDB, TargetScan, and StarBase, to predict the target miRNAs of RNF144B. Subsequently, we identified a total of 7 miRNAs: hsa-miR-16-5p, hsa-miR-195-5p, hsa-miR-31-5p, hsa-miR-377-3p, hsa-miR-424-5p, hsa-miR-497-5p, and hsa-miR503-p. In addition, we used StarBase database to predict the lncRNAs targeted by miRNAs, and identified 11 lncRNAs: GAS5, EPB41L4AAS1, OIP5AS1, SNHG12, PART1, SNHG1, MIRLET7BHG, TUG1, SNHG5, KCNQ10T1and NEAT1. Finally, Cytoscape was employed to construct the RNF144B-associated ceRNA network (Fig. 8a), which elucidated the intricate interplay between these RNAs during SONFH-induced autophagy. Furthermore, we performed a literature search based on the ceRNA hypothesis and identified a downregulated miRNA and an upregulated lncRNA that played a key regulatory role in other mitochondrial autophagy-associated diseases for further analyses. We proposed that TUG1- hsa-miR-31-5p - RNF144B axis may represent a potential RNA regulatory pathway for regulating the progression of SONFH.
Fig. 8.
ceRNA networks of RNF144B and validation of ceRNA networks in SONFH cell model. (a) ceRNA networks of RNF144B. (b) The expression level of TUG1 in SONFH cell model was detected by RT-qPCR. (c) The expression level of RNF144B in SONFH cell model was detected by RT-qPCR. (d) The expression level of hsa-miR-31 in SONFH cell model was detected by RT-qPCR.
Verification of TUG1, hsa-miR-31-5p, RNF144B expression in the SONFH ceRNA network
To investigate the impact of TUG1, hsa-miR-31-5p, and RNF144B on the pathogenesis of SONFH, we employed RT-qPCR to assess the expression levels of TUG1, hsa-miR-31-5p, and RNF144B in a cellular model of SONFH induced by dexamethasone at concentrations ranging from 0.5 µmoL to 10 µmoL. Our findings revealed that lncRNA TUG1 and RNF144B were up-regulated, while hsa-miR-31-5p was down-regulated in SONFH cell model exposed to varying concentrations (Fig. 8b-d). The results of RT-qPCR analysis provided evidence for the reliability of our bioinformatics results.
Discussion
SONFH is a progressive disease caused by excessive use of glucocorticoids, which eventually leads to femoral head collapse and hip dysfunction2, and more than half of the patients require artificial joint replacements4. Nevertheless, due to the absence of effective treatments, both the disability rate and the associated economic and social burden of SONFH are escalating. Therefore, further investigation into the pathogenesis of SONFH is imperative for guiding treatment.
Autophagy is an intracellular protective process that maintains the metabolic homeostasis and survival of cells by encapsulating and disassembling waste proteins and organelles within the cell. It involves steps such as formation of autophagosomes, target recognition, fusion and degradation, and is regulated by key regulators such as mTOR and AMP14,15.In recent years, accumulating evidence has suggested a potential role of autophagy in SONFH16. Y.H. et al. have found that estradiol enhances autophagy levels through the ER-ERK-mTOR pathway to mitigate osteoblast apoptosis in SONFH17. Luo, P. et al. have demonstrated that autophagy plays a crucial protective role in SONFH and can mitigate glucocorticoid-induced cellular damage18. In this study, we found RNF144B as a core hub gene that exhibited differential expression in SONFH. Previous studies have elucidated the crucial regulatory function of RNF144B in numerous diseases. For instance, it has been shown to stimulate the proliferation of human spermatogonial stem cells and inhibit apoptosis through the FCER2/NOTCH2/HES1 pathway, thereby playing a pivotal role in spermatogenesis19. Additionally, RNF144B has been found to prevent inflammatory responses and mitigate cardiac dysfunction in sepsis, highlighting its significance in the context of immune and cardiovascular health20. Furthermore, RNF144B regulates epithelial homeostasis by facilitating the degradation of p21WAF1 and p63, showcasing its involvement in maintaining tissue integrity and cell cycle progression21. We indicated its promising diagnostic value through ROC curve analysis and emphasized the pivotal role of RNF144B in SONFH pathogenesis. These findings suggested that RNF144B could serve as a potential biomarker for clinical diagnosis and treatment strategies targeting SONFH.
To further explore the biological function of RNF144B, we conducted an enrichment analysis on the screened core gene RNF144B and found it to be enriched in the autophagy pathway. Then, we identified 222 autophagy-related genes from HADb and subsequently overlapped them with DEGs, resulting in the identification of 47 autophagy genes associated with SONFH occurrence. We further investigated the correlation between RNF144B and 47 autophagy genes screened, revealing that 37 autophagy genes were positively correlated with RNF144B. Our findings suggested for the first time that RNF144B may regulate autophagy-related genes in SONFH, which could subsequently affect mitochondrial function and autophagy.
Moreover, the establishment of ceRNA networks can help us identify and study potential regulatory pathways and targets, providing new insights into disease pathogenesis and biological processes. In recent years, a growing number of studies have shown that the ceRNA network is widely involved in diseases such as tumors and neurological disorders22,23. However, less research has been undertaken in SONFH. Therefore, we constructed an RNF144B-associated ceRNA network, which included 11 lncRNAs and 7 miRNAs. The TUG1-hsa-miR-31-5p-RNF144B axis was examined in greater detail, revealing a decrease in hsa-miR-31-5p expression and an increase in TUG1 and RNF144B expression, according to RT-qPCR experiments. These results suggested that TUG1 can regulate the expression of RNF144B by acting as a ceRNA for hsa-miR-31-5p, and the ceRNA network may also elucidate the mechanism by which RNA induces autophagy and participates in the development of SONFH.
Although significant discovery has been made, our research has certain limitations. We conducted cellular experiments exclusively to investigate the expression of key genes in the ceRNA network associated with SONFH. Firstly, a dual luciferase reporter gene assay was carried out to confirm the exact regulatory relationship among the ceRNA. Secondly, the role of the ceRNA in the cell model was verified. Finally, the role of ceRNA in SONFH was verified by animal experiments.
In this study, we identified a novel core gene, RNF144B, and found a correlation between RNF144B and autophagy genes, indicating that RNF144B may regulate autophagy-related genes in SONFH, which in turn affected mitochondrial function and autophagy. Furthermore, we proposed a ceRNA network associated with autophagy genes, which may provide insights into RNA interactions that triggered autophagy in SONFH.
Methods
Data collection and identification of differentially expressed genes (DEGs)
The mRNA expression data of SONFH samples were obtained from the GEO datasets (https://www.ncbi.nlm.nih.gov/gds/) in this study. GSE123568 was selected as the test dataset, which comprised 30 samples of SONFH and 10 control samples. The Human Autophagy Database (HADb) network was utilized to retrieve a total of 222 autophagy genes (http://www.autophagy.lu). Differential expression analysis was performed using the “Limma” package in R software24, with screening criteria set at |log2FC| > 0.5 and p < 0.01. Heatmap and volcano plots were generated for visualization of DEGs through the SangerBox website.
Screening of target modules and hub genes based on WGCNA
To identify potential genes associated with SONFH, we employed the “WGCNA” R package to perform weighted gene co-expression network analysis using the GSE123568 dataset. Initially, all samples were clustered to ensure network reliability. Subsequently, soft threshold selection analysis was conducted to confirm that gene interactions followed a scale-free distribution. The neighborhood matrix was then transformed into a topological overlap matrix (TOM). Co-expression modules were identified through hierarchical clustering by setting a minimum of 100 genes per module. Finally, correlation analysis was used to select key modules and consider their constituent genes as hub genes.
GEO database validation, Differential lncRNA analysis and ROC curves plotting
The validation datasets, GSE74089 and GSE10311, were selected for differential mRNA and differential lncRNA analysis. Boxplots were generated using the “ggplot2” package in R software, followed by statistical analysis using Student’s t-test with the assistance of the “ggsignif” package. lncRNA differential expression analysis was performed using Limma package, and the screening conditions were that the absolute value of log2FC were greater than 0.5 and the p-value was less than 0.01. Additionally, prepare the metadata set gene expression file, then load the R package and read the preparation file. Subsequently, ROC model was constructed and ROC curve was plotted, AUC value was calculated25, and finally label information was added, the graph was exported and saved.
Gene set enrichment analysis
The function of hub gene expression was investigated by employing Gene Set Enrichment Analysis (GSEA). GSEA analysis was conducted using the R packages “enrichplot,” “clusterProfiler,” and “org.Hs.eg.db.” Significantly enriched functions and pathways were identified based on a p-value < 0.05.
Construction of ceRNA networks
We employed three databases, namely miRDB (http://mirdb.org), TargetScan (www.targetscan.org), and StarBase (version 3.0), to predict the target miRNAs for hub genes. Subsequently, we utilized the StarBase (version 3.0) database to predict the target lncRNA molecules of the selected miRNAs. Finally, we visualized the ceRNA network involving mRNAs, miRNAs, and lncRNAs using Cytoscape software.
Construction of femoral head necrosis cellular model
The mouse osteoblastic precursor cells (MC3T3-E1) obtained from Procell (Wuhan, China) were utilized in this study. Subsequently, the MC3T3-E1 cells were seeded into 96-well culture plates and incubated for 24 h with varying concentrations of dexamethasone. Following that, 100 µL of medium containing CCK-8 reagent (MCE, USA) was added to each well and incubated for a duration of 0.5–4 h to assess cell viability. Finally, the optical density (OD) values at a wavelength of 450 nm were measured using a microplate reader (BioTek, USA).
Reverse transcription-quantitative polymerase chain reaction (RT-qPCR) assay
The total RNA was extracted from the femoral head necrosis cellular model using Trizol reagent (Accurate Biology, China) and then subjected to reverse transcription. Real-time fluorescence quantitative PCR assays were conducted using 2×NovoStart® SYBR High-Sensitivity qPCR SuperMix (TIANGEN, China), following the manufacturer’s instructions.
Statistical analyses
Data analysis and statistical tests were conducted using R software (version 4.0.2, https://www.r-project.org/) and IBM SPSS Statistics. In this study, we analyzed mRNA expression data from SONFH samples obtained from the GEO database and identified autophagy genes associated with SONFH from the HADb. And spearman’s correlation coefficient was employed for the correlation analysis. Statistical significance was set at p-value < 0.05.
Author contributions
Ri-Jin Xing conceived and designed the experiments; Jian-Fei Chen analyzed the data; Zeng-Ying Xing and Wei Liu drafted the paper; Jun Xiong revised the paper. All authors read and approved the final version of the manuscript.
Funding
This study was supported by Hainan Provincial Natural Science Foundation of China (822RC808), Project supported by the Education Department of Hainan Province (Hnky2022ZD-13) and Clinical Translational Innovation Cultivating Fund 550 Project of Hainan General Hospital (2022CXZH02).
Data availability
The datasets used and analysed during the current study are available from the corresponding author on reasonable request.
Declarations
Competing interests
The authors declare no competing interests.
Footnotes
Publisher’s note
Springer Nature remains neutral with regard to jurisdictional claims in published maps and institutional affiliations.
Zeng-Ying Xing and Wei Liu contributed equally to this work.
References
- 1.Mont, M. A. et al. Nontraumatic Osteonecrosis of the femoral head: where do we stand today? a ten-year update. 97(19), 1604–1627 (2015). [DOI] [PubMed]
- 2.Wang, A., Ren, M. & Wang, J. The pathogenesis of steroid-induced osteonecrosis of the femoral head: a systematic review of the literature. Gene. 671, 103–109 (2018). [DOI] [PubMed] [Google Scholar]
- 3.Zhang, J. et al. Screening of potential biomarkers in the peripheral serum for steroid-induced osteonecrosis of the femoral head based on WGCNA and machine learning algorithms. 10, 2639470 (2022). [DOI] [PMC free article] [PubMed]
- 4.Wang, B. et al. Comprehensive analysis of pivotal biomarkers, immune cell infiltration and therapeutic drugs for steroid-induced osteonecrosis of the femoral head. 12(1), 5971–5984 (2021). [DOI] [PMC free article] [PubMed]
- 5.Truttmann, A. C., Ginet, V. & Puyal, J. Current evidence on cell death in Preterm Brain Injury in Human and Preclinical models. Front. Cell. Dev. Biol.8, 27 (2020). [DOI] [PMC free article] [PubMed] [Google Scholar]
- 6.Mizushima, N. & Komatsu, M. Autophagy: Renovation Cells Tissues Cell.147(4), 728–741 (2011). [DOI] [PubMed] [Google Scholar]
- 7.Levine, B. & Kroemer, G. Biological functions of Autophagy genes: a Disease Perspective. Cell. 176 (1–2), 11–42 (2019). [DOI] [PMC free article] [PubMed] [Google Scholar]
- 8.Galluzzi, L. et al. Molecular definitions of autophagy and related processes. Embo j.36 (13), 1811–1836 (2017). [DOI] [PMC free article] [PubMed] [Google Scholar]
- 9.Li, J. et al. Long noncoding RNA NORAD regulates lung cancer cell proliferation, apoptosis, migration, and invasion by the miR-30a-5p/ADAM19 axis. 13(1), 1 (2020). [PMC free article] [PubMed]
- 10.Fatica, A., I.J.N.R, G. & Bozzoni Long. non-coding RNAs: New. Players cell. Differ. Dev. 15(1), 7–21 (2014). [DOI] [PubMed] [Google Scholar]
- 11.Zhao, X. et al. Long noncoding RNA CA7-4 promotes autophagy and apoptosis via sponging MIR877-3P and MIR5680 in high glucose-induced vascular endothelial cells. Autophagy. 16 (1), 70–85 (2020). [DOI] [PMC free article] [PubMed] [Google Scholar]
- 12.Ariffin, J. K. et al. The E3 ubiquitin ligase RNF144B is LPS-inducible in human, but not mouse, macrophages and promotes inducible IL-1β expression. J. Leukoc. Biol.100 (1), 155–161 (2016). [DOI] [PubMed] [Google Scholar]
- 13.Wang, P. et al. RBR E3 ubiquitin ligases in tumorigenesis. Semin Cancer Biol.67 (Pt 2), 131–144 (2020). [DOI] [PubMed] [Google Scholar]
- 14.Glick, D., Barth, S. & Macleod, K. F. Autophagy: cellular and molecular mechanisms. J. Pathol.221 (1), 3–12 (2010). [DOI] [PMC free article] [PubMed] [Google Scholar]
- 15.Levine, B. & Kroemer, G. Autophagy in the pathogenesis of disease. Cell. 132 (1), 27–42 (2008). [DOI] [PMC free article] [PubMed] [Google Scholar]
- 16.Liang, X. Z. et al. Identification of potential autophagy-related genes in steroid-induced osteonecrosis of the femoral head via bioinformatics analysis and experimental verification. J. Orthop. Surg. Res.17 (1), 86 (2022). [DOI] [PMC free article] [PubMed] [Google Scholar]
- 17.Yang, Y. H. et al. Estradiol inhibits osteoblast apoptosis via promotion of autophagy through the ER-ERK-mTOR pathway. Apoptosis. 18 (11), 1363–1375 (2013). [DOI] [PubMed] [Google Scholar]
- 18.Luo, P. et al. The role of autophagy in steroid necrosis of the femoral head: a comprehensive research review. Int. Orthop.42 (7), 1747–1753 (2018). [DOI] [PubMed] [Google Scholar]
- 19.Du, L. et al. RNF144B stimulates the proliferation and inhibits the apoptosis of human spermatogonial stem cells via the FCER2/NOTCH2/HES1 pathway and its abnormality is associated with azoospermia. J. Cell. Physiol.237 (9), 3565–3577 (2022). [DOI] [PubMed] [Google Scholar]
- 20.Guo, R. et al. Rnf144b alleviates the inflammatory responses and cardiac dysfunction in sepsis. ESC Heart Fail.10 (4), 2338–2344 (2023). [DOI] [PMC free article] [PubMed] [Google Scholar]
- 21.Conforti, F. et al. PIR2/Rnf144B regulates epithelial homeostasis by mediating degradation of p21WAF1 and p63. Oncogene. 32 (40), 4758–4765 (2013). [DOI] [PubMed] [Google Scholar]
- 22.Salta, E. & De Strooper, B. Noncoding RNAs in neurodegeneration. Nat. Rev. Neurosci.18 (10), 627–640 (2017). [DOI] [PubMed] [Google Scholar]
- 23.Qi, X. et al. ceRNA in cancer: possible functions and clinical implications. J. Med. Genet.52 (10), 710–718 (2015). [DOI] [PubMed] [Google Scholar]
- 24.Ritchie, M. E. et al. Limma powers differential expression analyses for RNA-sequencing and microarray studies. 43(7), e47-e47 (2015). [DOI] [PMC free article] [PubMed]
- 25.Kumar, R. & Indrayan, A. Receiver operating characteristic (ROC) curve for medical researchers. Indian Pediatr.48 (4), 277–287 (2011). [DOI] [PubMed] [Google Scholar]
Associated Data
This section collects any data citations, data availability statements, or supplementary materials included in this article.
Data Availability Statement
The datasets used and analysed during the current study are available from the corresponding author on reasonable request.


