Abstract
Rock-filled concrete (RFC) construction technology is to construct a force-transferring skeleton with large-size rocks, and to use self-compacting concrete (SCC) as the filling and bonding material. In which the defects with different distributions and sizes contained in SCC are often the key factors determining the mechanical properties and damage behaviors of RFC. In this research, by utilizing the excellent properties of super absorbent polymer (SAP), such as water absorption and expansion and dehydration shrinkage, non-introduction of impurities, and not easy suspension or settlement in concrete, RFC and SCC specimens with different numbers and sizes of defects were precisely prepared and subjected to unconfined uniaxial compression physical tests. The effects of porosity and pore aperture on the compressive strength and damage pattern of the specimens were studied. The mechanical behavior of the defective concrete specimens under compressive loading was analyzed from a mesoscopic perspective by using a combination of physical tests and numerical simulation using the Realistic Failure Process Analysis (RFPA) method to reveal the internal damage phenomenon and damage destabilization mechanism of RFC and SCC. The results show that: SAP material can accurately construct concrete specimens with stable and uniform defects; under the same porosity and aperture, the compressive strength of RFC is greater than that of SCC; the compressive strength of the specimen decreases linearly with the growth of porosity for the same aperture, the compressive strength of the specimen decreases with the increase of aperture for the same porosity and the trend tends to be flat, and the sensitivity of the compressive strength to porosity is higher than that of aperture. In addition, it was found that the internal penetrating shear damage during the fracturing process of SCC was the core cause of the overall damage. For RFC, the tensile fracture that penetrated through the force transmission skeleton of the stacked rock was the key factor causing the overall instability.
Keywords: Rock-filled concrete, Compressive strength, Super absorbent polymer, Defect preparation, Damage mechanism
Subject terms: Civil engineering, Composites
Introduction
Rock-filled concrete (RFC) is a new type of concrete that emerged with the development of self-compacting concrete (SCC)1. The construction process of RFC consists of two main steps: firstly, rocks larger than 300 mm in size are stacked directly into the bin; then, SCC is poured into the voids between the rocks, filling the entire space by its self-weight and fluidity2–4.
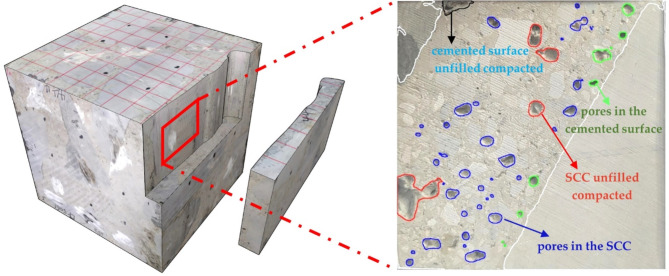
The unique construction process and discontinuous grading of RFC lead to many types of defects during the pouring process5. Zhang et al.6 investigated the flow process of SCC in the aggregate void using the Lattice Boltzmann Method (LBM) and showed that the filling effect of RFC was mainly affected by the SCC fluidity. During the RFC pouring process, the number, morphology, and type of defects in RFC will be different from that of conventional concrete as affected by SCC mobility. After analyzing and statistics of the RFC defects collected from the construction site. Ren et al.7 classified the defects in RFC into four categories: pores in the cemented surface, cemented surface unfilled compacted, pores in the SCC, and SCC unfilled compacted, as shown in Fig. 1. RFC is a composite material in which the rock mass constitutes the main compressive force-transferring skeleton, and the SCC acts as a cementing medium to bond the rock mass material8,9. Compressive tests on RFC have shown that damage to RFC occurs mainly in the SCC10 while the rock remains largely intact. In particular, when self-compacting concrete contains defects of different sizes and numbers, these defects significantly affect the mechanical properties of RFC.
Fig. 1.
Results of identification and categorization of different types of defects within RFC.
At the mesoscopic level, concrete contains many randomly and discretely distributed defects. Under external loading, cracks are more likely to develop at the defects, which vastly reduces the mechanical property parameters of concrete11–14. In the studied of the relationship between strength and porosity of conventional concrete15,16, the most widely accepted models are the linear relationship proposed by Hasselmann, the power function relationship proposed by Balshin, and the exponential relationship proposed by Ryshkewitch. After that, Revilla-Cuesta et al.17 studied the mechanical properties of SCC based on the porosity model and found that porosity significantly affects the compressive mechanical properties of SCC. Lian et al.18 deduced the analytical relationship between concrete porosity and compressive strength from Griffith’s fracture theory, and concluded that there is a linear relationship between concrete porosity and compressive strength; Deo et al.19 found that porosity has a more significant effect on compressive strength than pore diameter in the study of pervious concretes; Zhang et al.20 showed that the porosity not only has a significant effect on the compressive strength of concrete, but is also an important factor that affects its splitting strength. In addition, it was shown that even if the porosity is the same, the macroscopic mechanical properties of concrete may differ significantly due to the pore morphology, distribution, and size21,22.
To quantitatively control the geometric parameters of internal concrete defects, Xiao et al.23 prepared concrete with pores by applying a rosin-based blowing agent. Still, this method is difficult to achieve precise control of porosity. Zhang and Bi et al.24,25 used camphor as a pore-making material to precast concrete with definite-size pores, but this method may introduce additional chemicals inside the concrete; Dong et al.26 used Expanded Polystyrene (EPS) to precast concrete with specific porosity, but the EPS had the problem of uplift during the pouring process. Li et al.27 used polytetrafluoroethylene to prepare internal defects in concrete, but the strength of polytetrafluoroethylene itself affected the mechanical properties of concrete to some extent; Liu et al.28 used 3D printing technology to prepare concrete specimens containing defects, and examined the effect of pore defects on the hardening properties of concrete.
In this study, a new method is innovatively proposed to utilize the physical properties of super absorbent polymer (SAP) materials in terms of expansion by water absorption and contraction by dehydration in order to construct test samples of concrete containing spherical pores with specific porosities (0, 2, 4, 6, 8, and 10%) and aperture (6, 10, 14 mm). It was used to assess the effect of porosity and aperture on the mechanical properties of concrete. In order to gain a deeper understanding of the failure mechanism of defective concrete, this paper adopted the realistic failure process analysis (RFPA)29,30 numerical calculation method to simulate the failure process of defective concrete, revealing the influence of the internal mesostructure of the material on its macroscopic damage behavior, providing an essential means for understanding and predicting the failure behavior of concrete. Through these experiments and numerical simulations, this study would provide a significant reference value for designing RFC dams.
Use SAP for quantitative and accurate control to prepare concrete with specific pore structures and physical experiment scheme
Accurate preparation of concrete with pores using SAP
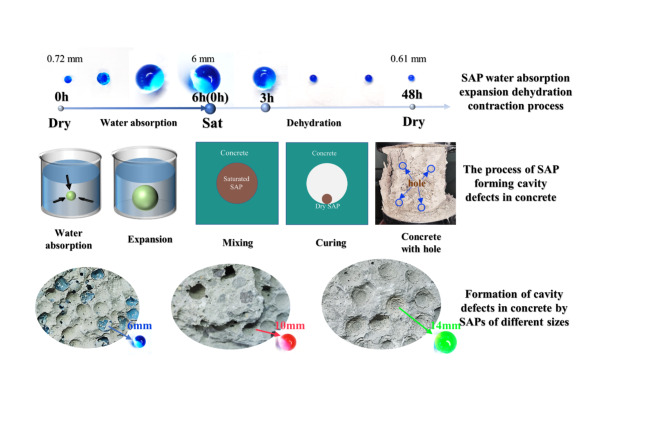
SAP is a new functional polymer material consisting of acrylonitrile and acrylate. SAP contains many hydrophilic groups, making it highly water absorbent, and its diameter can be swollen by 5–10 times after absorbing water. When preparing the SCC with pores, the application of SAP will bring the following advantages: (1) SAP dehydration shrinkage compared to the concrete curing time is shorter, in the cool conditions after 3 h has been obvious contraction behavior, 48 h has been completely dehydrated, in the concrete curing period can form a good cavity. (2) The density of SAP is slightly higher than water after absorbing water, so it is not easy to be suspended or settled in concrete, and it can form stable and uniform defects inside concrete. (3) SAP water absorption and dehydration is a purely physical phenomenon. In the process of forming defects, there will not be a chemical reaction with the concrete31. (4) SAP materials are inexpensive and provide a cost-effective approach for the preparation of concrete defects. In this study, the apparent density of SAP was shown in Table 1. The process of SAP expansion by water absorption and shrinkage by dehydration, as well as the formation of pore defects inside the concrete was shown in Fig. 2.
Table 1.
Apparent density of SAP granules.
| SAP particle size/(mm) | 5.8–6.2 | 9.8–10.2 | 13.8–14.2 |
|---|---|---|---|
| Apparent density/(kg m-3) | 1003 | 1009 | 1017 |
Fig. 2.
SAP water-absorbing expansion and dehydration shrinkage processes and the formation of pore defects within the concrete.
The SCC raw materials used in the experiment were as follows: P. O42.5 ordinary Portland cement, fly ash, the natural medium sand with a fineness modulus of 2.5–3.1, gravel aggregates of 5–10 mm in size, The experimental water was local tap water, 27% polycarboxylate superplasticizer admixture. The mixed proportion of SCC was shown in Table 2. To avoid the influence of the properties, geometric shape, and spatial stacking distribution of natural rock material on the compressive strength of RFC specimens, this study employs 120 mm diameter spherical specimens poured with the grouting material with a specific gravity of approximately 2460 kg/m3 to replace the rock in RFC. The compressive strength of the standard cube SCC specimen with a side length of 150 mm was determined to be 35.00 MPa, and that of the grouting material specimen was 55.86 MPa.
Table 2.
Mix proportions of the self-compacting concrete (kg/m3).
| Cement | Fly ash | Gravel aggregates | Medium sand | Water | Admixture |
|---|---|---|---|---|---|
| 142 | 289 | 571 | 1173 | 160 | 6.5 |
Test specimen preparation and physical experiment scheme.
After being hydrated and expanded, the SAP particles were sieved to obtain a diverse range of particle sizes required for the experiment. The target porosity of the precast concrete specimens was defined as the total volume of SAP particles as a percentage of the total volume of the specimen. The experimental SAP dosage was shown in Table 3.
Table 3.
Number of water-saturated SAP in concrete specimens with different porosity and aperture (particles).
| Porosity | Aperture5.8–6.2 mm | Aperture9.8–10.2 mm | Aperture13.8–14.2 mm |
|---|---|---|---|
| 2% | 597 | 129 | 47 |
| 4% | 1194 | 258 | 93 |
| 6% | 1790 | 387 | 140 |
| 8% | 2387 | 516 | 188 |
| 10% | 2984 | 645 | 235 |
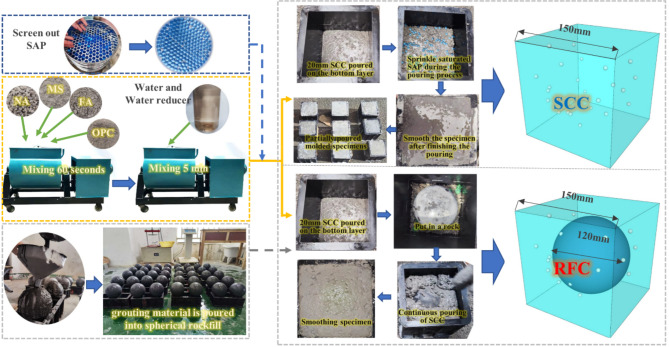
The sprinkling pouring method was adopted to avoid the fragmentation of saturated SAP when mixed with concrete grout. The specific pouring process was as follows: soak the spherical SAP in water for 24 h to fully saturate it. The concrete was stirred in a gravity mixer. The coarse and fine aggregates were mixed and stirred for 1 min without water, and then the water and water-reducing admixture were added to them after they were well-mixed. After the SCC was mixed sufficiently, it was poured into the mold, during which the screened SAP beads are sprinkled in layers, utilizing the high fluidity of the SCC to encapsulate the SAP beads and ensure that they were uniformly distributed within the specimen, the entire process without the need for vibration. The pouring process of RFC was like that of SCC. Spherical rocks were added after the SCC was poured into the mold to a depth of 20 mm. Using the early bearing capacity of SCC to fix the stacked rock at the center of the mold after a certain settlement. The pouring process was shown in Fig. 3. The specimens were demolded at a temperature of 25 after 48 h and maintained under standard conditions for 28 days before subsequent experiments.
Fig. 3.
The manufacturing process of RFC and SCC specimens with spherical saturated SAP.
The experiment set up 15 groups of specimens of RFC and SCC with prefabricated initial pores respectively, and two groups of no defect control groups, with 3 specimen samples in each group, for a total of 96 specimen samples in 32 groups cast. The specimens were subjected to uniaxial compressive stress tests using Rock Mechanics Testing (RMT-301) equipment with displacement loading at a loading rate of 0.01 mm/s (Fig. 4).
Fig. 4.
Uniaxial compressive stress loaded specimen with spherical hole defects.
Porosity and aperture as a control on mechanical properties
Analysis of stress-strain curve results of uniaxial compressive test
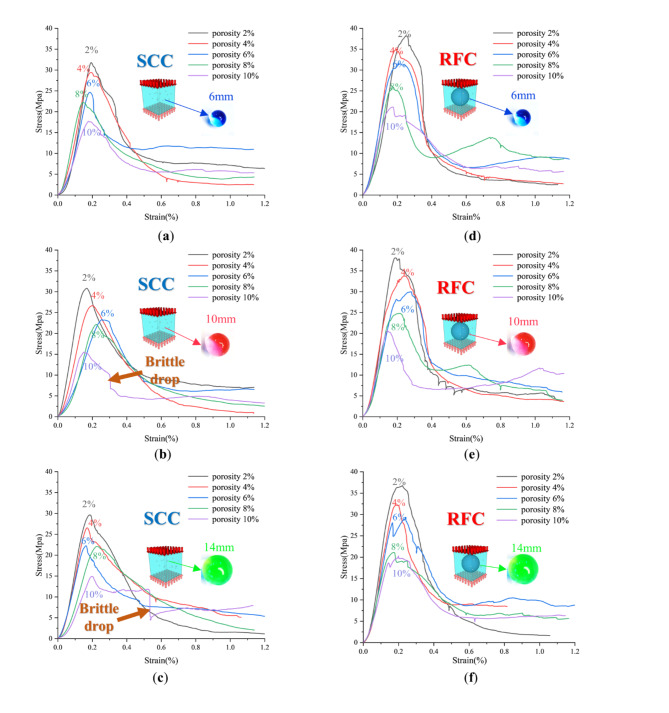
Through unconfined uniaxial compression tests on SCC and RFC specimens with 3 different aperture and 5 different porosity, the stress-strain curves of various concrete specimens with different pore structures were obtained during the complete process from the initial loading to the complete failure of the specimens (Fig. 5).
Fig. 5.
Stress-strain curves of RFC and SCC specimens during damage with different apertures and porosities (a) SCC aperture 6 mm, (b) SCC aperture 10 mm, (c) SCC aperture 14 mm, (d) RFC aperture 6 mm, (c) RFC aperture 10 mm, (f) RFC aperture 14 mm.
As shown in Fig. 5, at the same porosity and aperture, the peak strength of RFC is on average 10–20% higher than the peak strength of SCC, which indicates that the block aggregate has a significant increasing effect on the strength. As can be seen from the curves in each figure, the peak strength of both RFC and SCC monotonically decreases with increasing porosity, which is consistent with the findings of Victor Revilla Cuesta17. In addition, for SCC, the material failure mode gradually evolves from quasi-brittle to ductile with increasing porosity, while RFC is still dominated by quasi-brittle damage failure as a whole due to the presence of internal spherical stacked rock bodies. However, from Fig. 5 (b and c), it can be observed that when the pore diameter is larger than 10 mm and the porosity is more than 10%, the compressive curve of SCC shows an obvious brittle drop after the peak value. Analyzing the reason, this may be due to the absence of a stacked stone body as a force-transferring skeleton within the SCC specimen, and the destruction of individual large-grain-size defects is more likely to induce brittle overall instability, and the specific reasons for this will be detailed later in the analysis of the damage forms.
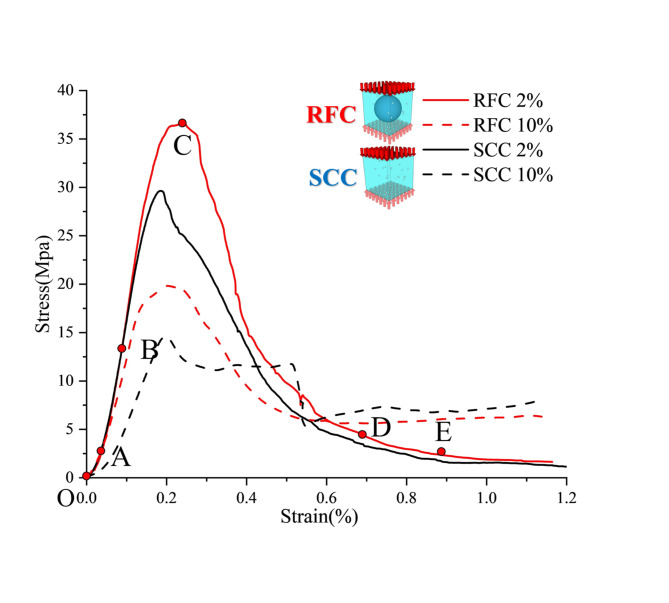
The stress-strain curves of RFC and SCC with a pore diameter of 14 mm and porosity of 2% and 10% were selected from Fig. 5 for comparative analysis. According to the characteristics of the curves in Fig. 6, the uniaxial compression of the specimen to damage destabilization could be divided into the following five stages: (1) Compacting phase (OA): At the early stage of loading, the stress of the specimen grew slowly with the strain, and the initial defects inside the specimen occur to be closed. From Fig. 6, it could be observed that the larger the initial defect content of SCC, the larger the strain in the compaction stage. The initial defects in RFC did not have much effect on the compaction stage. This is due to the fact that the well-performed rock pile force transfer skeleton in RFC could well prevent the specimen from excessive strain at the early loading stage. (2) Elastic phase (AB): In this phase the stress-strain approximately maintained a linear growth relationship. (3) Elastic-plastic stage (BC): As the pressure continued to increase, the slope of the stress-strain curve decreased, and at this time, microcracks began to sprout inside the specimen. (4) Plastic phase (CD): After the peak stress, as the strain increased, the stress decreased. The microcracks inside the specimen underwent development and extension to merge, resulting in the destruction of the original force chain of the specimen. (5) Residual stress stage (DE): As the strain continues to increased, the stress decreased to the lowest point after the stress-strain curve tended to flatten. 2% porosity and 10% porosity specimens of the residual stress of the peak stress of 15% and 40%, respectively, the residual stress of the high porosity was larger than that of the low porosity, suggesting that the destruction of the specimen of the low porosity of the specimen was more complete.
Fig. 6.
Stress-strain curves of specimens at various stages of the damage process.
Numerical calculation principle and analysis of simulation results
From a mesoscopic perspective, concrete with holes could be regarded as a heterogeneous composite material consisting of three components: rocks, SCC, and spherical defects. Select the appropriate concrete mesostructure model, use numerical methods to simulate the damage process of defective concrete specimens, and visualize the damage mechanism of the specimens32,33. Tang et al.29 proposed the RFPA method and led the development of numerical calculation software. The method assumes that each element satisfies a linear constitutive equation at the mesoscopic perspective, and the nonlinear deformation behavior exhibited by rocks at the macroscopic level is due to the uneven mechanical properties of the mesoscopic elements. The Weibull distribution with a threshold value is used in the method to describe the mechanical non-uniformity of mesoscopic elements. Its expression function is as follows:
 |
1 |
Where: characterized the strength of mesoscopic element, elastic modulus and other mesoscopic mechanical parameters.
  was the average value of the mesoscopic mechanical parameters. m was the degree of homogeneity, and the larger the value, the closer the mechanical property of each element was to the average value and the more homogeneous the specimen.
 was the mechanical properties of the mesoscopic mechanical element of the statistical density function.
Based on the RFPA method proposed by Tang29, Yang decomposed and refined the damage paths. Fully considering the influence of the element damage history on the current mechanical behavior, Yang extended it to multiple path damage analysis and developed the Rock Engineering Analysis System (REAS), which simulated the damage of rocks under a certain hydraulic gradient. REAS was developed to simulate rock damage under certain hydraulic gradients, and the results were consistent with those of physical experiments.
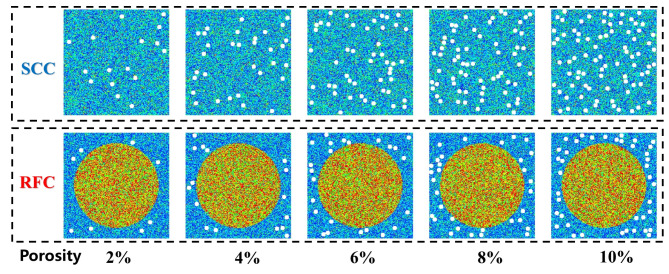
In this paper, a program for generating random pores was created by using the C#. The numerical specimens with side lengths of 150 mm and porosities ranging from 2 to 10% were established, containing random circular holes with average diameters of 6 mm, 10 mm, and 14 mm, and ensuring that the holes did not overlap with each other. The number of defects in the numerical specimens with different porosities and different apertures is shown in Table 4. After assigning the corresponding element mechanical parameters, part of the numerical model is shown in Fig. 7, and the loading mode is vertical displacement loading with a loading rate of 0.01 mm/step, to quantitatively analyze the effects of porosity and aperture on the compressive strength, respectively.
Table 4.
Numerical simulation of the number of circular defects (number).
| Porosity | SCC aperture 6 mm | SCC aperture 10 mm | SCC aperture 14 mm | RFC aperture 6 mm | RFC aperture 10 mm | RFC aperture 14 mm |
|---|---|---|---|---|---|---|
| 2% | 16 | 6 | 3 | 8 | 3 | 1 |
| 4% | 32 | 11 | 6 | 16 | 6 | 3 |
| 6% | 48 | 17 | 9 | 24 | 9 | 4 |
| 8% | 64 | 23 | 12 | 32 | 11 | 6 |
| 10% | 80 | 29 | 15 | 40 | 14 | 7 |
Fig. 7.
Numerical simulation scheme for RFC and SCC with 6 mm apertures.
Due to the influence of the element scale effect, the mesoscopic strength of the element would be much higher than the macroscopic strength of the specimen. By comparing with the macroscopic results of uniaxial compression physical experiments, the parameters were inverted to obtain the mesoscopic material properties. Equation (1) shows that the larger the value of the degree of homogeneity m is, the closer the mechanical properties of each element inside the specimen are to the mean value, and the more homogeneous the specimen is; regarding the settings of Li et al.34 and Dong et al.35for sandstone (m = 1.5) and granite (m = 3), given that the internal subunit defects of the SCC and grouting material are more than those of the intact granite, their degree of homogeneity should be lower than 3. Therefore, we reasonably set the degree of homogeneity of the degree of homogeneity of SCC and grout between 1 and 2. Finally, through extensive parameter inversion, the degree of homogeneity of SCC is determined to be 1.2, and the degree of homogeneity of grout, which is representative of artificial rock, is 1.5. Other mesoscopic material parameters of the element were shown in Table 5.
Table 5.
SCC and grouting material parameters.
| Parameters | SCC | grouting material |
|---|---|---|
| Homogeneity index | 1.2 | 1.5 |
| Mesoscopic modulus of elasticity (GPa) | 18 | 32 |
| Mesoscopic compressive strength (MPa) | 200 | 300 |
| Poisson’s ratio | 0.2 | 0.2 |
| Density | 2.3 | 2.5 |
| Residual strength coefficient | 0.25 | 0.2 |
| Ratio of compressive to tensile strength | 10 | 10 |
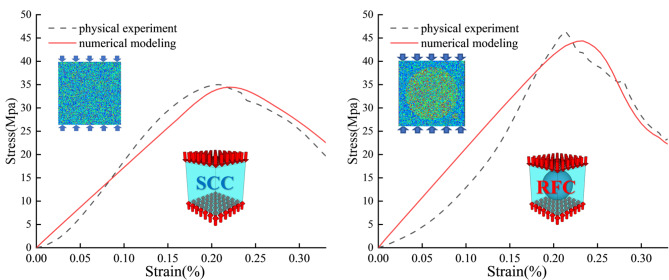
Comparing the results of physical experiments and numerical simulations, their loading curves are well matched. The without defects SCC and RFC were taken as examples (Fig. 8). Under uniaxial loading conditions, the compressive strengths of SCC and RFC were 35.00 MPa and 46.46 MPa for the physical tests and 34.45 MPa and 44.38 MPa for the numerical simulations, with a maximum error of not more than 5%.It can be concluded that the selected parameters can well reflect the real mechanical properties of concrete materials. Therefore, in this paper, numerical simulation of unconfined uniaxial compression of pre-existing defective concrete will be carried out using the above parameters. Three numerical simulations are performed for each model to take the average value, and the uniaxial compressive strength data of different specimens are obtained as shown in Table 6.
Fig. 8.
Comparison of numerical simulation and physical test stress-strain curves for defect-free SCC and RFC.
Table 6.
Mean values of compressive strength under numerical simulation with different models (MPa).
| Porosity | SCC aperture 6 mm | SCC aperture 10 mm | SCC aperture 14 mm | RFC aperture 6 mm | RFC aperture 10 mm | RFC aperture 14 mm |
|---|---|---|---|---|---|---|
| 2% | 30.28 | 29.97 | 28.92 | 37.72 | 36.89 | 36.42 |
| 4% | 27.39 | 26.58 | 26.30 | 34.30 | 33.71 | 32.53 |
| 6% | 24.10 | 23.50 | 22.96 | 31.16 | 29.67 | 28.24 |
| 8% | 20.00 | 19.51 | 19.30 | 25.11 | 24.51 | 23.72 |
| 10% | 17.04 | 16.14 | 15.84 | 21.14 | 20.76 | 20.27 |
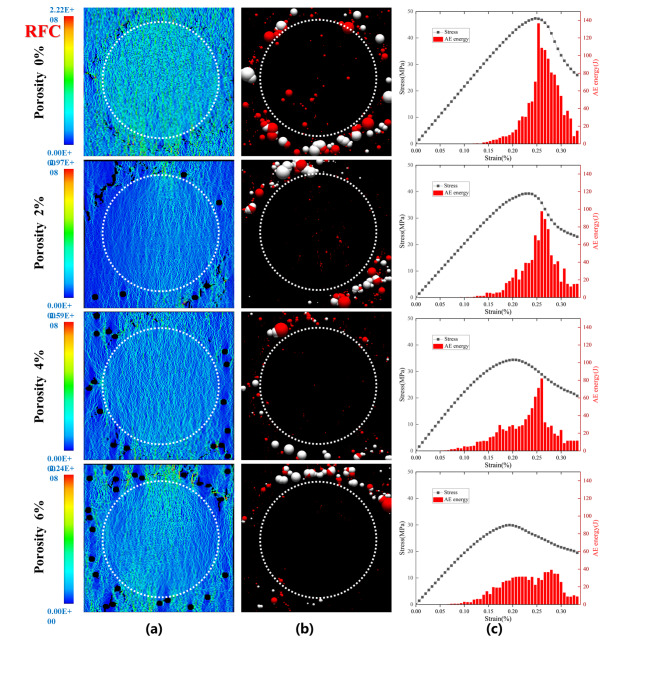
The first principal stresses, acoustic emission (AE) events and acoustic emission energies, and stress-strain process curves for RFC with defect porosities of 0%, 2%, 4%, and 6% under uniaxial compression conditions at peak strength are given in Fig. 9. Acoustic emission is a physical phenomenon that refers to the fact that when a specimen is deformed, the external work done is not completely transformed into the internal energy of the object, but part of it is released outward in the form of elastic waves. In the numerical simulation process wherein the red spheres represent the acoustic emission from tension damage, while the white spheres represent the acoustic emission from compression damage. The diameter size of the spheres indicates the relative magnitude of the acoustic emission energy released.
Fig. 9.
Effect of different numbers of defects on the mechanical response of RFC (a) first principal stress at peak stress (b) acoustic emission distribution at peak stress (c) stress-strain curve and acoustic emission energy.
At each porosity, the stress concentration preferences all appeared first around the region containing the initial defects (Fig. 9a). This suggests that the initial defects in RFC are the location of stress concentration and potential crack initiation. Upon reaching the peak strength (Fig. 9b), as the number of defects in the self-compacting concrete increases, the acoustic emission events are shifted from the center rock pile to the surrounding self-compacting concrete. It can be seen that at a porosity of 0%, some of the acoustic emission events occur in the center stacked stone region; however, as the porosity increases to 6%, the acoustic emission events in the center stacked stone region decrease significantly. This is due to the fact that the mechanical properties of the center stacked stone material are better than those of the surrounding self-compacting concrete during the building process of the stacked stone concrete, so under compressive loading, the damage occurs firstly in the self-compacting concrete, especially in the self-compacting concrete in the presence of super-unit-size defects, and the units around these defects are more prone to be damaged, which results in the transfer of acoustic emission events from the center stacked stone body to the surrounding self-compacting concrete. In addition, the average energy of acoustic emission decreases as the number of defects increases. This indicates that less energy is required to reach peak strength and the specimens are more susceptible to damage.
Figure 9(c) shows that the peak acoustic emission energy decreases with increasing RFC porosity, and the peak acoustic emission energy gradually lags behind the intensity limit. In particular, the peak acoustic emission energy becomes less pronounced when the porosity increases beyond 6%. In addition, the addition of defects caused the acoustic emission events to occur earlier, leading to earlier damage and reduced strain at peak strength. For example, no porosity and 6% porosity peaked at 0.26% and 0.21% strain, respectively. When defects are present in the RFC, the AE energy does not reach its maximum at the moment of peak compressive strength, but rather after the peak region. Liang et al.36 also observed this phenomenon in the numerical simulation process.
Porosity and aperture as a control on experimental phenomena and damage patterns
RFC and SCC test phenomena and damage patterns
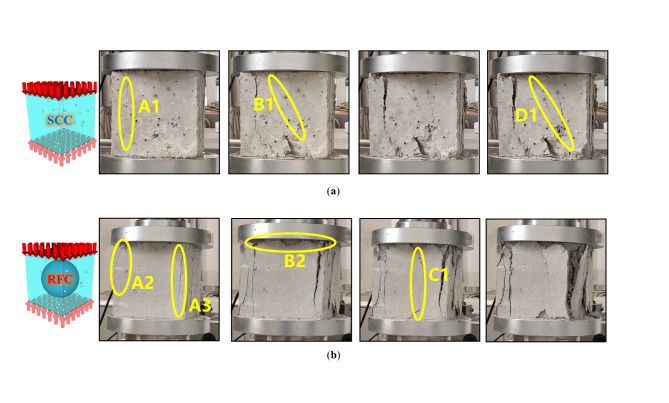
When comparing the unconfined uniaxial compression test process of 32 groups of specimens, the fractured phenomena on the surface of the SCC specimens had both splitting cracks and shear cracks, while almost only splitting cracks could be observed on the surface of the RFC specimens.
The development of surface cracks during the entire process of SCC and RFC fracturing (Fig. 10) is illustrated with a porosity of 10% and a pore diameter of 10 mm as an example. The SCC specimen initially exhibited vertical tension cracks from the upper left corner (Fig. 10A1). After continued loading, inclined shear cracks started to sprout in the center of the specimen (Fig. 10B1). Subsequently, shear cracks at all angles appeared gradually. Eventually, the surface of the specimen showed a pattern of damage with the coexistence of multiple inclined shear cracks and split-tension cracks (Fig. 10D1). During the loading process of the RFC specimen, split-tension cracks preferentially began to develop at the two sides without stacked rock bodies (Fig. 10A2, A3). Subsequently, the top of the specimen was partially broken due to end friction (Fig. 10B2). Afterward, vertical cracks started to develop in the center of the specimen (Fig. 10C1). Ultimately, multiple vertical splitting cracks in the RFC specimen stripped the surface.
Fig. 10.
Comparison of RFC and SCC damage failure process under uniaxial compression, (a) SCC aperture10mm porosity10%, (b) RFC aperture10mm porosity10%.
Numerical analysis of different damage patterns
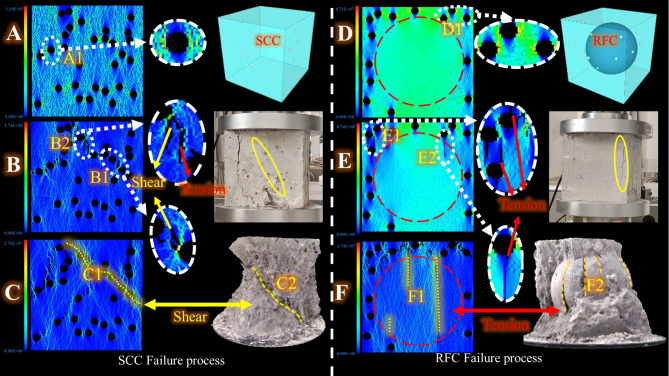
In order to investigate the morphology of the damage development inside the SCC and RFC during the fracturing process, the physical experiments were compared with the numerical simulations simultaneously. The development of internal defects in the specimens was observed through numerical simulation, and the damage mechanism was verified. Afterward, the surface of the fractured specimens from the physical experiments was peeled off, exposing the internal damage morphology for comparison with the numerical simulation results.
Taking the SCC and RFC specimens with 10 mm aperture and 10% porosity as an example, the compression process could be divided into three stages of damage evolution: stress concentration (Fig. 11A, D), crack extension (Fig. 11B, E), and crack penetration (Fig. 11C, F). At the beginning of loading, both SCC and RFC exhibited stress concentration on the left and right sides of the circular hole (Fig. 11A1, D1). However, when loaded around the peak strength, SCC and RFC showed different damage forms, with SCC showing mainly shear damage at 45° along the loading direction (Fig. 11B1, B2) and a small portion of tensile damage (Fig. 11B2). The RFC showed tensile damage parallel to the loading direction, and even cracks penetrated the rock pile (Fig. 11E1, E2). The SCC finally showed shear damage inclined to the loading direction (Fig. 11C1, C2), while the RFC showed tensile damage parallel to the loading direction (Fig. 11F1, F2). The damage patterns of the numerical simulation of the SCC and the RFC matched well with those of the physical tests.
Fig. 11.
Comparison of numerical simulations and physical experiments on damage evolution during fracturing of SCC and RFC specimens.
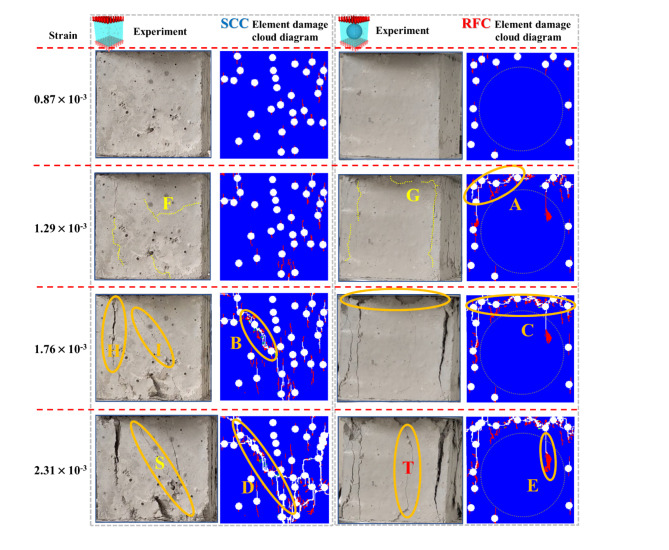
The internal damage resulting from the fracturing process of SCC and RFC specimens with a porosity of 10% and an aperture of 10 mm is analyzed by numerical simulation (Fig. 12). From the element damage cloud diagram of the specimen, it could be observed that the process from mesoscopic element damage to crack development and finally the formation of macroscopic cracks. Among them, the red color represented the tension damage element, and the green color represented the shear damage element.
Fig. 12.
Comparison of test and simulation of damage destruction process of specimen.
When entering the elastic-plastic phase (strain of 0.87 × 10 − 3), it was still challenging to observe apparent changes on the surface of the specimens for physical tests. However, by comparing the numerical experiments, red tensile damage elements had started to sprout along the vertical direction around the circular holes inside the SCC and RFC. When the strain increased to 1.29 × 10 − 3, the mesoscopic tensile damage continued to develop and began to interconnect the holes. In the concentrated part of the holes at the top of the RFC, the red damaged elements further cracked and formed white cracks. Concurrently, the surfaces of the specimens subjected to physical testing (SCC and RFC) exhibited cracking of varying degrees (yellow dashed line in Fig. 12F G). As the loading approached the peak intensity (strain of 1.76 × 10 − 3), fewer green shear damage elements appeared in the SCC, gradually connecting the holes and fissuring into macroscopic shear cracks (Fig. 12B). Concurrently, the physical specimen surface exhibited vertical downward macroscopic splitting tensile damage (Fig. 12H) and macroscopic shear cracks close to 45° (Fig. 12I). In the RFC, the SCC damage elements on the top surface opened into cracks in large numbers and penetrated each other. The mesoscopic cracks expanded and merged into trunk cracks (Fig. 12C), which was consistent with the damage on the upper surface of the specimen in the physical test. When the strain increased to 2.31 × 10 − 3, the SCC appeared to completely penetrate through the shear damage channel of the specimen (Fig. 12D, S). For the RFC, the SCC damage elements around the aggregate were massively tensioned into vertical splitting cracks. As the main body to bear the load, the aggregate had developed tension cleavage to penetrate the interior of the pile rock (Fig. 12E).
Through the physical tests described above, it could be observed that shear cracks (Fig. 10A1) and tension cracks (Fig. 10B1) tended to exist simultaneously on the surface of the SCC specimen when SCC was fractured. However, when RFC was fractured, the surface of the specimen showed multiple splitting and tension cracks through the specimen (Fig. 10A2A3C1).
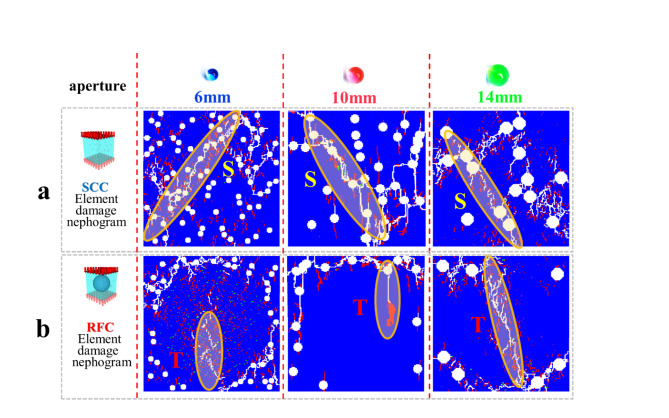
Further comparison of the internal damage characteristics of the specimens revealed that the internal penetrating shear damage (Fig. 13a) was the core cause of the overall damage destabilization of the SCC specimen when it was fractured. The multiple internal splitting and tensile cracks (Fig. 13b) penetrating through the force-transferring skeleton of the rock pile body inside the RFC specimen were the key factors contributing to the overall instability. The corresponding numerical simulation well matched the physical test results (Fig. 11) and revealed the whole process of internal damage development.
Fig. 13.
Comparison of RFC and SCC numerical simulation damage and failure under different aperture.
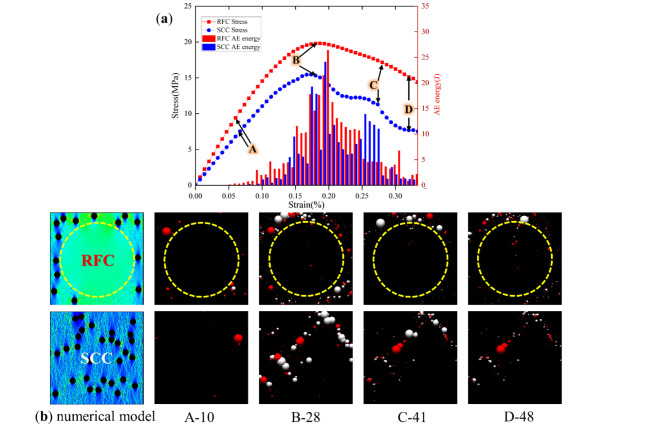
The numerical simulation procedure in Fig. 14 explains the reason for the different decreasing trend of SCC and RFC after the peak compressive strength at 10% porosity for 10 mm aperture. Compared with the physical test, the compaction stage of numerical simulation is not obvious, so the compaction stage is categorized into the elastic stage for analysis, and four strain level loading points are marked on the stress-strain curves, and A, B, C, D on the curves correspond to the AE process as shown in Fig. In addition, “A-10” indicates that the current loading step at point A is 10. The stress-strain curves of SCC and RFC have the same trend until the peak intensity point B. The stress-strain curves of SCC and RFC have the same trend until the peak intensity point B. The stress-strain curves of SCC and RFC are shown in Fig. 14. Acoustic emission occurs in small amounts during the elastic phase (point A), and the number of acoustic emission surges at the peak moment (point B). At point C, the numerical simulation results show a significant brittle decrease in the stress-strain curve of the SCC. Meanwhile, the AE single-step energy also exhibits a secondary peak phenomenon. These observations suggest that extensive re-damage occurred within the SCC. It can be observed from the corresponding AE plots that this is due to the fact that as the aperture diameter increases, the SCC is not supported by the stacked rock body resulting in a concentration of forces around the internal large aperture, and again a large amount of acoustic emission phenomenon occurs. For the RFC, due to the internal inclusion of stacked stones with excellent performance, these stacked stones acted as the main load-bearing structure after the external SCC damage, which effectively prevented the brittle destabilization phenomenon of the specimen caused by the large aperture after the peak.
Fig. 14.
Mechanical behavior of SCC and RFC with 10 mm aperture and 10% porosity (a) Stress-strain curve and single-step AE energy (b) AE distribution.
Discussion
Effect of porosity on compressive strength for the same aperture
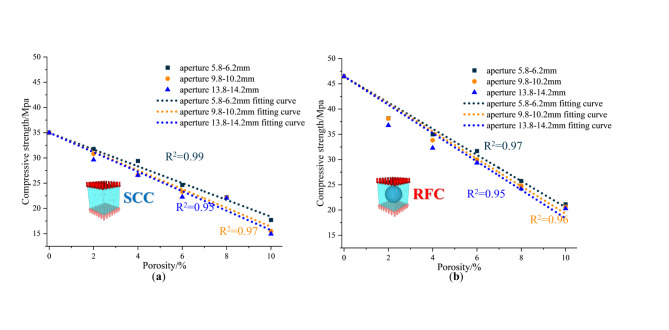
Many researchers have studied the relationship between porosity and strength and proposed various correlation formulas. In this paper, the Hasselmann linear model was used for fitting (Fig. 15). From the fitting effect, the correlation coefficients R2 were all greater than 0.95. Therefore, within 10% porosity, the formula could be used to calculate the relationship between porosity and peak strength.
Fig. 15.
Porosity versus compressive strength fitting curve (a) SCC (b) RFC.
Effect of aperture diameter on compressive strength for the same porosity
At the same porosity, as the aperture increases, the stress distribution inside the concrete becomes more uneven, and the compressive strength decreases as the aperture increases.
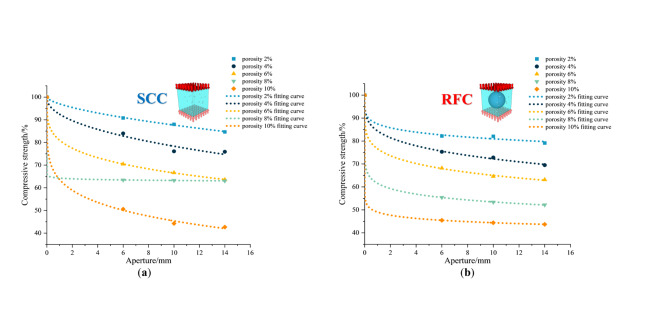
The compressive strength of concrete specimens with the same porosity and different apertures was fitted to the curve (Fig. 16). It could be seen that with the same porosity, the compressive strength gradually decreased with increasing aperture, and the decreasing trend was gradually flat. However, the compressive strength sensitivity to the aperture was different for RFC and SCC. Except for 8% porosity, in the case of the same porosity, when the aperture was 14 mm, the compressive strength of SCC was about 90% of the 6 mm aperture, while that of RFC was approximately 95%. This indicates that SCC was more sensitive to aperture than RFC.
Fig. 16.
Aperture versus compressive strength fitting curve (a) SCC (b) RFC.
Effect of dual factors of porosity and aperture on compressive strength
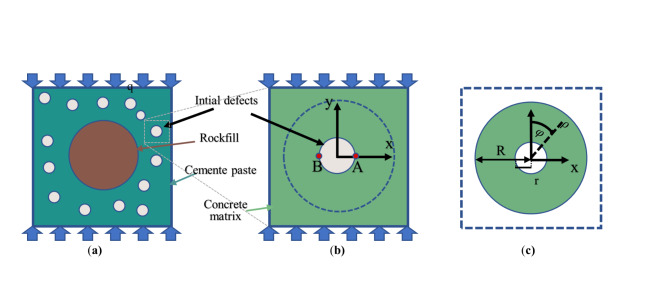
Localized stresses around internal defects were typically much higher than the average stresses, which was a significant factor inducing the failure of concrete structures. The stress state of a concrete specimen containing a large number of defects under loaded conditions was complex. For simplicity, firstly, on the mesoscopic scale, the RFC was considered as a three-phase composite material consisting of stacked rocks, cement paste, and initial defects, as shown in Fig. 17 (a). Secondly, all the defects were concentrated in the center of the matrix as the interlayer phase, and the stacked rock aggregates were equated with the cement paste to establish the central circular hole model, as shown in Fig. 17 (b). The model was subjected to the externally applied uniaxial compressive load q. In order to facilitate the analysis of the stress concentration problem at the edge of the hole, the form of a polar coordinate system was adopted, as shown in Fig. 17 (c).
Fig. 17.
Equivalent process for defects in round holes (a) loading of concrete with defects (b) simplified central round hole model (c) equivalent polar coordinate model.
Li et al.37 used a semi-inverse solution to give an analytical relationship between porosity and stress distribution.
 |
2 |
Where: c denotes the concrete porosity, expressed as 
Analyzing the maximum principal stresses at points A and B when subjected to uniaxial pressure. Since the stresses at points A and B are the same, point A is taken for analysis. According to the above equation, the radial and tangential stresses at point A are zero, and the circumferential stress is , simplified to
 . Therefore, the relationship between compressive strength and porosity of concrete containing defects is:
 |
3 |
Where: is the compressive strength of concrete specimens with a defect percentage of c.
 is the compressive strength of non-defective concrete specimens.
Based on the fitted relationship between aperture and concrete strength given by Gao38, the aperture had a power function relationship with compressive strength. The larger the aperture, the stronger the weakening effect on strength. The following equation was used to express the effect of aperture on strength.
 |
4 |
Where: M was the coefficient of influence of aperture on compressive strength, N and G denoted the parameters of the influence function, the value of which was fitted by the compressive strength.
From Eq. (2), the damage factor of compressive strength due to porosity could be defined as . Thus, obtaining the dual factors of porosity and aperture on the compressive strength of concrete:
 |
5 |
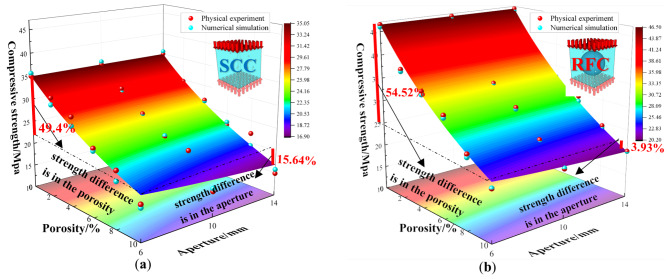
To verify the validity and superiority of the model, Eq. (5) was used to fit the results of physical and numerical experiments of RFC and SCC in this paper with different aperture and porosities. The fitted surfaces are shown in Fig. 18, where the red spheres are the compressive strength measured from physical experiments and the blue spheres are the compressive strength obtained from numerical simulations. The fitting results show that the numerical simulation is very close to the physical test results, for RFC, the R² value of the fitted surface is as high as 0.982, and for SCC, the R² value of the fitted surface reaches 0.988. Both R² values are more than 0.95, which can be regarded as the mathematical model’s performance in predicting the compressive strengths of RFC and SCC under the conditions of different porosity and aperture is better.
Fig. 18.
Fitted surface of aperture and porosity to compressive strength (a) SCC (b) RFC.
From the analysis of the physical test data, in the case of consistent aperture, for example, when the aperture is 6 mm, the SCC and RFC compressive strengths decreased from 35.00 MPa and 46.46 MPa without defects to 17.71 MPa and 21.13 MPa with a porosity of 10%, with a decrease of 49.4% and 54.52%, respectively, which indicates that in the case of consistent aperture, the RFC compressive strength is more sensitive to the porosity is more sensitive. In the case of consistent porosity, for example, 10% porosity, the SCC and RFC compressive strengths decreased from 17.71 MPa and 21.13 MPa for 6 mm aperture to 14.94 MPa and 20.30 MPa for 14 mm aperture, with decreases of 15.64% and 3.93%, respectively, which indicated that the SCC compressive strength was more sensitive to aperture under the case of consistent porosity.
Conclude
This study conducted uniaxial compression tests on concrete specimens by introducing internal defects and used the RFPA method for numerical simulation. The influence of aperture and porosity on the failure characteristics and mechanical properties of SCC and RFC specimens was deeply explored. The contributions and conclusions can be drawn as follows:
(1) By utilizing the physical properties of SAP materials, such as water absorption expansion and dehydration shrinkage, as well as their stable properties, suitable bulk density, and resistance to suspension or settlement in concrete, it is possible to accurately construct concrete specimens containing various porosity and aperture defects without introducing other impurities.
(2) Under the same conditions of porosity and aperture, the compressive strength of RFC increased by more than 10% compared to that of SCC. Relative to aperture, porosity is the main factor determining the compressive strength of RFC and SCC. Specifically, the strength of SCC and RFC decreases by half when the porosity is increased from 0 to 10%, implying that the control of porosity is crucial in actual building construction.
(3) RFC is more sensitive to changes in porosity, for example, when the porosity is 6 mm aperture and the porosity increases from 0 to 10%, the compressive strength of RFC decreases by 54.52%, whereas that of SCC decreases by only 49.4%.SCC is more sensitive to changes in porosity, when the porosity is 10%, and the porosity increases from 0 to 14 mm aperture, the compressive strength of SCC decreases by 15.64%, whereas that of RFC decreases by only 3.93%. When the porosity is below 10% with the same aperture, the compressive strength of RFC and SCC decreases linearly with the increase of porosity. When the aperture increases from 6 mm to 14 mm with the same porosity, the compressive strengths of RFC and SCC show a decreasing trend, and the decreasing trend tends to be flat in accordance with the power function law.
(4) In the case of SCC aperture less than 6 mm aperture, the failure mode shifted from quasi-brittle to ductile with the increase of porosity; aperture greater than 10 mm aperture induced a brittle drop after the peak intensity of SCC stress-strain curve. For RFC, on the other hand, it always fails in a quasi-brittle mode as the aperture increases. It can be observed by the acoustic emission technique that after the peak intensity, the stacked rock within the RFC plays the main load-bearing role, which effectively avoids the secondary acoustic emission peak phenomenon.
(5) Physical tests and numerical simulations are comprehensively applied to reveal the internal damage phenomena and damage destabilization mechanisms of RFC and SCC. Although shear and tensile cracks appear on the surface of SCC, the core reason for its overall damage and instability is the internal penetrating shear failure. For RFC, among the multiple penetrating cracks on the surface, the tensile cracks that penetrate the force transmission skeleton of the rock mass are the key factors causing overall instability.
Acknowledgements
This work was supported by the National Natural Science Foundation of China [No.52069004]; Guizhou Provincial Science and Technology Projects [QKHJC-ZK[2021]YB293].
Author contributions
Author Contributions: Study conception and design: T.Y Manuscript writing and preparation: Y.L. Data collection and analysis: G.W., H.Q., and L.Y. Revised the manuscript text Y.L and T.R . All authors have read and agreed to the published version of the manuscript.
Data availability
The datasets used and/or analysed during the current study available from the corresponding author on reasonable request.
Declarations
Competing interests
The authors declare no competing interests.
Footnotes
Publisher’s note
Springer Nature remains neutral with regard to jurisdictional claims in published maps and institutional affiliations.
References
- 1.Chen, S. et al. Lattice boltzmann-discrete element modeling simulation of SCC flowing process for rock-filled concrete[J]. Materials12 (19), 3128. 10.3390/ma12193128 (2019). [DOI] [PMC free article] [PubMed] [Google Scholar]
- 2.Jin, F., An, X., Shi, J. & Zhang, C. Study on rock-filled concrete dam[J]. J. Hydraul. Eng.36, 1347–1352. 10.3321/j.issn:0559-9350.2005.11.013 (2005). . [Google Scholar]
- 3.An, X. et al. Rock-filled concrete, the new norm of SCC in hydraulic engineering in China[J]. Cem. Concr. Compos.54, 89–99. 10.1016/j.cemconcomp.2014.08.001 (2014). . [Google Scholar]
- 4.Wang, Y., Liang, T. & Jin, F. Void effect study on the compressive behavior of RFC based on the 3D four-phase mesoscopic finite element model[J]. Constr. Build. Mater.417, 135145. 10.1016/j.conbuildmat.2024.135145 (2024). . [Google Scholar]
- 5.Xie, Y., Corr, D. J., Jin, F., Zhou, H. & Shah, S. Experimental study of the interfacial transition zone (ITZ) of model rock-filled concrete (RFC)[J]. Cem. Concr. Compos.55, 223–231. 10.1016/j.cemconcomp.2014.09.002 (2015). [Google Scholar]
- 6.Zhang, C., Jin, F., Chen, S. & Xu, X. Flow behaviors of self-compacting concrete in rockfill gaps[J]. J. Hydroelectric Eng.35 (10), 112–120. 10.11660/slfdxb.20161012 (2016). [Google Scholar]
- 7.Ren, T. et al. Identification and characteristic analysis of internal defects in rock-filled concrete based on deep learning method[J]. Mater. Today Commun. 110652. 10.1016/j.mtcomm.2024.110652 (2024).
- 8.Liu, W. & Pan, J. Filling capacity evaluation of self-compacting concrete in rock-filled concrete[J]. Materials13 (1), 108. 10.3390/ma13010108 (2019). [DOI] [PMC free article] [PubMed] [Google Scholar]
- 9.Li, X. et al. Study on the influence of specimen size and aggregate size on the compressive strength of rock-filled concrete[J]. Appl. Sci.13 (10), 6246. 10.3390/app13106246 (2023). [Google Scholar]
- 10.Zhou, H., An, X., Ren, M., Li, P. & Wang, C. Effect of rock shear keys on the shear performance of cold joints in rock-filled concrete structures: experimental and numerical investigation[J]. Constr. Build. Mater.336, 127315. 10.1016/j.conbuildmat.2022.127315 (2022). [Google Scholar]
- 11.Wong, R. H. C. et al. Analysis of crack coalescence in rock-like materials containing three flaws—part I: experimental approach[J]. Int. J. Rock Mech. Min. Sci.38 (7), 909–924. 10.1016/S1365-1609(01)00064-8 (2001). [Google Scholar]
- 12.Haeri, H. Propagation mechanism of neighboring cracks in rock-like cylindrical specimens under uniaxial compression[J]. J. Min. Sci.51 (3), 487–496. 10.1134/s1062739115030096 (2015). [Google Scholar]
- 13.Haeri, H. Simulating the crack propagation mechanism of pre-cracked concrete specimens under shear loading conditions[J]. Strength Mater.47 (4), 618–632. 10.1007/s11223-015-9698-z (2015). [Google Scholar]
- 14.Sun, L. et al. Investigating the Effect of various fibers on plasticity and compressive strength of concrete Samples[J]. Strength Mater.56 (1), 200–208. 10.1007/s11223-024-00639-3 (2024). [Google Scholar]
- 15.Röβler, M. & Odler, I. Investigations on the relationship between porosity, structure and strength of hydrated portland cement pastes I. Effect of porosity[J]. Cem. Concr. Res.15 (2), 320–330. 10.1016/0008-8846(85)90044-4 (1985). [Google Scholar]
- 16.HOFF, G. Porosity-strength considerations for cellular concrete[J]. Cem. Concrete Res.2 (1), 91–100. 10.1016/0008-8846(72)90026-9 (1972). [Google Scholar]
- 17.Revilla-Cuesta, V. et al. Porosity-based models for estimating the mechanical properties of self-compacting concrete with coarse and fine recycled concrete aggregate[J]. J. Building Eng.44, 103425. 10.1016/j.jobe.2021.103425 (2021). [Google Scholar]
- 18.Malani, S. R. & Pandey, R. K. The relationship between porosity and strength for porous Concrete[J]. Chin. J. Geotech. Eng.44 (12). 10.1016/j.conbuildmat.2011.05.005 (2022).
- 19.Deo, O. & Neithalath, N. Compressive response of pervious concretes proportioned for desired porosities[J]. Constr. Build. Mater.25 (11), 4181–4189. 10.1016/j.conbuildmat.2011.04.055 (2011). [Google Scholar]
- 20.Zhang, S. et al. Influence of the porosity and pore size on the compressive and splitting strengths of cellular concrete with millimeter-size pores[J]. Constr. Build. Mater.235, 117508. 10.1016/j.conbuildmat.2019.117508 (2020). [Google Scholar]
- 21.Zhou, T., Zhu, J., Ju, Y. & Xie, H. Volumetric fracturing behavior of 3D printed artificial rocks containing single and double 3D internal flaws under static uniaxial compression[J]. Eng. Fract. Mech.205, 190–204. 10.1016/j.engfracmech.2018.11.030 (2019). [Google Scholar]
- 22.Park, C. & Bobet, A. Crack coalescence in specimens with open and closed flaws: a comparison[J]. Int. J. Rock Mech. Min. Sci.46 (5), 819–829. 10.1016/j.ijrmms.2009.02.006 (2009). [Google Scholar]
- 23.Xiao, M. et al. Influence of slurry characteristics on the bubble stability in foamed concrete[J]. J. Building Eng.71, 106500. 10.1016/j.jobe.2023.106500 (2023). [Google Scholar]
- 24.Zhang, K., Wang, C., Zhao, Y. & Bi, J. Experimental study on cracking behavior of concrete containing hole defects[J]. J. Building Eng.65, 105806. 10.1016/j.jobe.2022.105806 (2023). [Google Scholar]
- 25.Bi, J., Tang, J., Wang, C., Quan, D. & Teng, M. Crack coalescence behavior of rock-like specimens containing two circular embedded flaws[J]. Lithosphere10.2113/2022/9498148 (2022). 2022(Special 11). [Google Scholar]
- 26.Dong, J., Cao, J., Li, Y., Zhou, Y. & Wang, L. Interfacial modification of EPS cement based composite materials[J]. J. Building Mater.22 (6), 917–921. 10.3969/j.issn.1007-9629.2019.06.012 (2019). [Google Scholar]
- 27.Li, P., Zhao, Y., Wu, Y. & Lin, J. Effect of defects in adhesive layer on the interfacial bond behaviors of externally bonded CFRP-to-concrete joints[J]. Eng. Struct.278, 115495. 10.1016/j.engstruct.2022.115495 (2023). [Google Scholar]
- 28.Liu, H. et al. Influence of pore defects on the hardened properties of 3D printed concrete with coarse aggregate[J]. Additive Manuf.55, 102843. 10.1016/j.addma.2022.102843 (2022). [Google Scholar]
- 29.Tang, C. Numerical simulation of progressive rock failure and associated seismicity[J]. Int. J. Rock Mech. Min. Sci.34 (2), 249–261. 10.1016/S0148-9062(96)00039-3 (1997). [Google Scholar]
- 30.Yang, T., Liu, H. & Tang, C. Scale effect in macroscopic permeability of jointed rock mass using a coupled stress–damage–flow meth-od[J]. Eng. Geol.228, 121–136. 10.1016/j.enggeo.2017.07.009 (2017). [Google Scholar]
- 31.Shang, X., Zhan, B., Li, J. & Rui, Z. Novel microcapsules for internal curing of high-performance cementitious system[J]. Sci. Rep.10 (1), 8318. 10.1038/s41598-020-65285-6 (2020). [DOI] [PMC free article] [PubMed] [Google Scholar]
- 32.Yang, Y. et al. Numerical Investigation of Rock-Breaking Force Analysis of TBM Disk-Cutters[J]. Strength Mater., 56(2): 419–430. 10.1007/s11223-024-00659-z (2024).
- 33.Fu, J. et al. Investigating Rock-Breaking Mechanisms Under TBM Hobs: Energy Analysis and Finite Element Modeling[J]. Strength Mater., : 1–18. 10.1007/s11223-024-00672-2 (2024).
- 34.Li, J. et al. Experimental and numerical study on the influence of gravitational stress gradient on the mechanical behavior of 3D printing sandstone models[J]. Int. J. Rock Mech. Min. Sci.159, 105224. 10.1016/j.ijrmms.2022.105224 (2022). [Google Scholar]
- 35.Dong, Z. et al. Mechanical properties and failure mechanism of concrete-granite composite specimens under compression load[J]. Constr. Build. Mater.435, 136768. 10.1016/j.conbuildmat.2024.136768 (2024). [Google Scholar]
- 36.Liang, X., Hu, L., Tang, S. & Liang, Z. Shear behavior and fracturing mechanism of intact sandstone affected by spatio-temporally varying water[J]. Comput. Geotech.155, 105200. 10.1016/j.compgeo.2022.105200 (2023). [Google Scholar]
- 37.Li, D., Li, Z., Lv, C., Zhang, G. & Yin, Y. A predictive model of the effective tensile and compressive strengths of concrete considering porosity and pore size[J]. Constr. Build. Mater.170, 520–526. 10.1016/j.conbuildmat.2018.03.028 (2018). [Google Scholar]
- 38.Gao, H., Zhang, X. & Zhang, Y. Effect of Air Void structure on strength and interfacial transition zone of concrete[J]. J. Tongji Univ. (Natural Science). 5, 751–756. 10.3969/j.issn.0253-374x.2014.05.015 (2014). . [Google Scholar]
Associated Data
This section collects any data citations, data availability statements, or supplementary materials included in this article.
Data Citations
- Yang, Y. et al. Numerical Investigation of Rock-Breaking Force Analysis of TBM Disk-Cutters[J]. Strength Mater., 56(2): 419–430. 10.1007/s11223-024-00659-z (2024).
- Fu, J. et al. Investigating Rock-Breaking Mechanisms Under TBM Hobs: Energy Analysis and Finite Element Modeling[J]. Strength Mater., : 1–18. 10.1007/s11223-024-00672-2 (2024).
Data Availability Statement
The datasets used and/or analysed during the current study available from the corresponding author on reasonable request.


