Abstract
To investigate the energy-saving advantages of truck platoons, this study focused on two, three, and six-axle trucks as research subjects. A non-uniform platoon model of trucks was constructed based on braking performance differences. The aerodynamic characteristics of the non-uniform platoon fleet were analyzed in depth using numerical simulation methods, and the fuel consumption rate of the fleet was calculated. In a heterogeneous three-vehicle platoon, the 3-2-6 platooning approach exhibited the most effective reduction in fuel consumption, whereas the 3-6-2 platooning approach was the least effective. For a four-vehicle heterogeneous platoon comprising a three-axle truck, a six-axle truck, and two two-axle trucks, the 3-2-2-6 platooning approach yielded the best fuel efficiency. In a four-vehicle heterogeneous platoon with a two-axle truck, a six-axle truck, and two three-axle trucks, the 3-2-3-6 platooning approach proved to be the most effective in reducing fuel consumption. In a four-vehicle heterogeneous fleet composed of two-axle trucks, three-axle trucks, and two six-axle trucks, the 3-2-6-6 platooning approach achieved the best fuel efficiency. The conclusions of this study offer a fundamental scheme for truck formation, laying a crucial theoretical foundation for energy conservation and emissions reduction in transport systems.
Keywords: Truck platoon, Non-uniform platooning, Fluid simulation, Fuel-saving effect, Formation strategy
Subject terms: Engineering, Civil engineering
Introduction
Concerns regarding environmental pollution and energy consumption have intensified as the convenience and efficiency of the transport industry have increased1. When trucks travel on a platoon, the close proximity between the vehicles results in aerodynamic drag changes that influence the overall aerodynamic drag characteristics of the platoon. Different types of trucks exhibit varying degrees of aerodynamic drag reduction and increased fuel efficiency when forming a platoon. The study of the energy conservation of trucks in platoons is of practical importance.
The experiments conducted using a 1/8 scale model aimed to investigate and quantify the relationship between drag and vehicle spacing during platoon travel, simulated with uniform vehicle spacing, indicating that reducing the vehicle spacing and increasing the number of vehicles in the platoon enhanced the average fuel savings2. The average drag coefficient of a four-vehicle platoon was lowest at spacings of 0.1 and 0.3 times the length of the vehicles. Similarly, wind tunnel experiments on a two-vehicle platoon using a 1/15.7 isometric model with different spacing conditions were conducted3.
Lammert et al.4 conducted a vehicle experiment with three lorries forming a platoon traveling at high speeds with uniform spacing. The fuel consumption of the two following trucks and the lead truck were recorded at different steady-state speeds, following distances, and gross vehicle weights. The effects of speed, following distance, and gross vehicle weight on fuel consumption were observed and analyzed. However, experiments on equally spaced vehicles were conducted, and non-uniform spacing was not considered. Vohra et al.5 conducted simulation experiments of a wind tunnel using a 1/64 scale model of a medium-sized Volvo VNL-2 lorry to study the effect of truck spacing on the drag coefficient. Simulation experiments for a three-vehicle platoon were conducted at different spacings, revealing a 53% reduction in drag at a spacing distance of 2 m. Törnell et al.6 conducted simulation experiments using two 1:6 scale lorry models in wind tunnels with a moving floor, setting up different workshop distances, transverse offsets, and yaw conditions. Pressure measurements on the surfaces of the trucks revealed that a decrease in the workshop distance led to a smaller platoon resistance. Nayeri et al.7 conducted wind tunnel simulation experiments using a 1:15 scale truck model and measured the platoon resistance by varying the spacing of a three-vehicle platoon with equal spacing. The platoon resistance decreased with a smaller workshop distance.
Previous fleet studies have typically focused on platoons of the same vehicle type or different vehicle types with the same workshop spacing. However, in practice, various vehicles of different models must travel in a formation, considering the differences in braking performance and vehicle dimensions. Thus, it is more reasonable for vehicles of different models to travel in formations with different spacing. By analyzing the airflow field of a platoon composed of vehicles of different models with varying spacing, the fuel-saving effect of each vehicle and the entire fleet can be derived, providing a reference basis for vehicle platooning. This paper innovatively explores vehicle formations, establishes a non-uniform arrangement model, and analyzes the flow fields of different types of vehicles under non-uniform arrangement conditions through numerical simulations.
Simulation modeling of non-uniform platooning of trucks and modeling of fuel economy
In this study, the initial step involved determining the required truck models and simulation parameters. The platform selected for the virtual wind tunnel simulation was XFlow. A simulation model for a non-uniform truck platoon and a fuel economy model were established. This facilitated the simulation of virtual wind tunnels for various combinations of truck models to identify the optimal truck platoon configuration.
Truck models and parameter settings
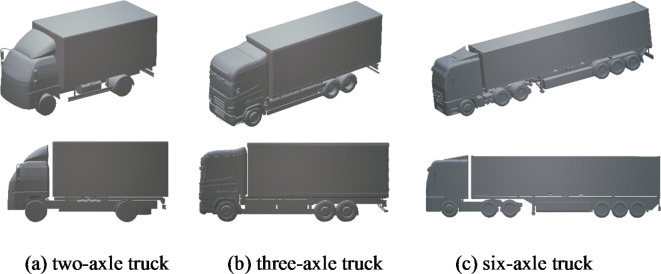
The study scenario was a motorway, and three distinct truck models were selected: two-axle truck, three-axle truck, and six-axle truck, as shown in Fig. 1.
Fig. 1.
Simulation models for three types of trucks.
The basic parameters of the three truck types are presented in Table 1.
Table 1.
Basic parameters of the three truck types.
| Two-axle truck | Three-axle truck | Six-axle truck | |
|---|---|---|---|
| Truck length (m) | 6 | 9.55 | 15 |
| Truck width (m) | 2.44 | 2.55 | 2.55 |
| Truck height (m) | 3 | 3.95 | 4 |
| Windward area (m2) | 6.39 | 8.54 | 7.98 |
| Total masses (t) | 4.5 | 25 | 49 |
For aerodynamic virtual simulation, the obstruction ratio (ε) is calculated using the formula
 |
1 |
where A is the projected area of the vehicle model on the wind tunnel cross-section, and AN is the wind tunnel cross-sectional area.
The results indicated that the simulation accuracy improved as the obstruction ratio decreased. When the obstruction ratio was below 2%, the impact on the simulation accuracy was negligible8. The blockage ratios for the three models, calculated based on a wind tunnel 20 m in height and 30 m in width, were 1.22%, 1.68%, and 1.70%, respectively, satisfying the requirement of a blockage ratio of less than 2%.
Modeling of non-uniform displacements
Previous platooning studies have often focused on scenarios in which vehicles of the same type travel in formation or vehicles of different types travel with uniform spacing. However, during actual motorway driving, different types of vehicles often form platoons. Considering the differences in braking performance and vehicle size, a non-uniform formation model is proposed for different types of vehicles. The model analyzes the distance between each vehicle and the vehicle in front and comprises two components:
 |
2 |
where d is the distance between the rear and front vehicles, da is the safe distance required for braking, and d0 is the desired stopping spacing.
d0 is the distance that must be maintained from the front vehicle after braking. The wiedemann99 model suggests a reasonable range of 0.5 to 2.5 m for the desired stopping distance in motorway following scenarios9. Considering the larger trucks used in this study, d0 was set to 2.5 m.
When calculating da for braking, the communication delay and the difference in braking coordination time of different types of vehicles are considered, and the difference in the time for each vehicle to overcome the brake clearance is ignored. The acceleration of the vehicles is assumed to change uniformly to the maximum braking acceleration during the braking coordination time and remain constant after reaching the maximum braking acceleration, and each vehicle can reach the same maximum braking acceleration. Therefore, for the accelerations of the front and rear vehicles, we obtain the following:
da for braking considers the communication delay and difference in braking coordination time between different types of vehicles. Assuming a uniform acceleration to the maximum braking acceleration during the coordination time, the acceleration equations for the front (a1) and rear (a2) vehicles are expressed as follows:
 |
3 |
 |
4 |
where amax is the maximum braking acceleration of the vehicle (default negative), t1 is the braking coordination time of the front vehicle in the queue, t2 is the braking coordination time of the rear vehicle in the queue, and td is the communication delay.
Integrating Eqs. (3) and (4), we respectively obtain
 |
5 |
 |
6 |
where v0 is the initial speed of the platoon before braking, v1 is the speed of the front vehicle in the platoon, and v2 is the speed of the rear vehicle in the platoon.
Integrating Eqs. (5) and (6), we respectively obtain
 |
7 |
 |
8 |
where s1 and s2 are the displacements of the front and rear vehicles in the platoon, respectively.
The initial speed v0 before braking of the platoon was set to 22 m/s after considering the passing efficiency and energy consumption. This speed was applied to all three truck models to ensure that they satisfied the Reynolds-number requirement. The road surface adhesion coefficient was set as 0.8, and the maximum braking deceleration achieved by the vehicle was 8 m/s².
As the research object of this model was a fleet of trucks traveling on a motorway in a connected-vehicle environment, different networked vehicles are equipped with different communication devices. According to relevant studies, the end-to-end communication delay between networked vehicles is between 30 and 100 ms10. To ensure sufficient safety for truck platooning, we selected the maximum value of the communication delay, i.e., 100 ms, as the communication delay for the truck platoon.
According to the Chinese national standard GB7258-2017 “Motor Vehicle Operation Safety Technical Conditions,” the braking coordination times for two-, three-, and six-axle trucks are 0.35, 0.6, and 0.8 s, respectively.
Substituting these parameters into Eqs. (5) and (6), the speed equations for the braking process of the platoon can be obtained. The distance between the platoon truck and front vehicle in different platooning cases was obtained by adding the calculated safety distance required for braking in different platooning cases with the desired stopping spacing. Table 2 provides the specific values.
Table 2.
Non-uniform truck spacing.
| Truck platoon arrangement | Non-uniform truck spacing (m) |
|---|---|
| Two-axle trucks after three-axle trucks | 2.54 |
| Two-axle truck after six-axle truck | 2.51 |
| Three-axle trucks after two-axle trucks | 7.37 |
| Three-axle trucks after six-axle trucks | 2.59 |
| Six-axle truck after two-axle truck | 9.48 |
| Six-axle truck after three-axle truck | 6.81 |
| Same trucks front and rear | 4.70 |
Modelling of fuel economy
To quantitatively analyze the fuel consumption of each vehicle and the platoon of trucks under different conditions, this section derives the fuel economy equations.
Ideally, without considering the gradient and acceleration resistance when the vehicle is traveling, when the vehicle is traveling alone on a horizontal road,
 |
9 |
where Ft is the required driving force of the vehicle, Ff is the wheel rolling resistance, Fw is the air resistance, m is the total mass of the vehicle (as shown in Table 1: Total masses), g is the gravitational acceleration (set to 9.81 m/s²), f is the wheel rolling resistance coefficient (set to 0.01), A is the windward area of each vehicle (as shown in Table 1: Windward area), Cd is the air resistance coefficient obtained via CFD simulation, and ua is the vehicle operating speed (set to 22 m/s).
The fuel consumption of the vehicle at an equivalent speed of 100 km is
 |
10 |
where Qs is the 100 km fuel consumption, Pe is the engine power, b is the fuel consumption rate (set to 220 g/(kW·h)), ρ is the density of the fuel (set to 835 g/L), and ηT is the mechanical efficiency of the driveline (set to 0.95).
The fuel-saving rate is denoted as β. Assuming that the mechanical efficiency of the driveline and fuel consumption rate do not change when the vehicle is converted from solo to platoon driving, the joint Eqs. (9) and (10) can be obtained as follows:
 |
11 |
where Qs is the 100-km fuel consumption when driving in the platoon, Qs0 is the 100-km fuel consumption when the vehicle is driving alone, Cd is the air resistance coefficient when driving in the platoon, and Cd0 is the air resistance coefficient when the vehicle is driving alone.
For the truck platoon as a whole, defining the overall fuel-saving rate of the platoon as βp, we obtain
 |
12 |
where n denotes the number of vehicles in the queue, Fw0i is the air resistance when the ith vehicle in the queue travels individually, Fw is the air resistance when the ith vehicle in the queue travels in a platoon, Ft0i is the required driving force when the ith vehicle in the queue travels individually, mi is the mass of the ith vehicle in the queue, Cd0i is the coefficient of air resistance when the ith vehicle in the queue travels individually, Cdi is the air resistance coefficient when driving in the platoon, and Ai is the windward area of the ith vehicle in the platoon.
CFD simulation analysis of truck platoon
Aerodynamic simulations were performed using XFlow software and a non-uniform arrangement model to analyze the flow field velocity vectors and static pressures of the platoon. The air resistance coefficients of the platoon were further calculated as they tended toward a steady state, and a fuel economy model was applied to calculate the fuel savings of the platoon.
CFD simulated analysis of a three-truck platoon
The main research object of this study was three types of trucks with large differences in size, namely two-axle, three-axle, and six-axle trucks, as well as the non-uniform layout platoon arrangement adopted. To highlight the characteristics of the non-uniform arrangement and effective use of simulation resources, we constructed a simulation truck platoon composed of these three different types of trucks.
As shown in Fig. 2, from the velocity vector side view, the characteristics of the flow field around the first two-axle truck in the two types of truck platoon were similar to those when driving alone. The high-speed airflow was blocked by the truck cab and flowed over the top, bottom, and sides of the truck before converging at the rear to form a vortex. However, the bottom airflow velocities were significantly lower for the two rear vehicles in both platoons. In the 2-6-3 platoon, significant high-speed vortices were formed in front of and above the three-axle truck. Combined with the top view of the velocity vectors, we observed that because of the longer body of the six-axle truck, the airflow on both sides of the second six-axle truck located in the 2-6-3 platoon gradually accelerated as it passed through the compartment of the six-axle truck. The accelerated flow field then converged behind the six-axle truck compartment in front of the three-axle truck, creating a region of cluttered turbulence. This turbulent region resulted in increased pressure at the rear of the six-axle truck and the head of the three-axle truck.
Fig. 2.
Flow field velocity vectors for 2-3-6 and 2-6-3 platoons.
The hydrostatic pressure plots in Fig. 3 show that the head of the pilot truck in both truck platoons had a significant positive pressure region. In the 2-3-6 platoon, the head of the following truck had a relatively small positive pressure region. However, in the 2-6-3 platoon, the three-axle truck in the third position was affected by the turbulent region in front of it; the pressure value of the positive pressure region in its head increased significantly, and the maximum pressure value was 339.25 Pa. This phenomenon was attributed to the high-velocity airflow from the rear of the six-axle truck in the 2-6-3 platoon converging in front of the three-axle truck following it, which led to a significant decrease in the fuel-saving rate of the three-axle truck. However, the fuel-saving rate of the six-axle truck in front of it increased.
Fig. 3.
Static pressure diagrams for 2-3-6 and 2-6-3 platoons.
Table 3 lists the average static pressure values for each truck in the 2-3-6 and 2-6-3 platoons. Because the two-axle trucks were the lead trucks of the platoons, and their aerodynamic characteristics were similar to those when traveling alone, the relevant data are not shown in the table. The results in Table 3 were consistent with the results of the above analyses, in that the pressure difference between the last two trucks in the 2-3-6 platoon was significantly lower. In contrast, in the 2-6-3 platoon, the turbulent region between the two rear trucks affected the rear of the six-axle truck and the head of the three-axle truck, resulting in a decrease in the differential pressure resistance at the rear of the six-axle truck and an increase in the differential pressure resistance at the head of the three-axle truck.
Table 3.
Pressure averages for three-axle and six-axle trucks in the 2-3-6 and 2-6-3 platoons.
| Head of truck | Rear of truck | Pressure difference | |
|---|---|---|---|
| 236 platoon − 3z | 122.54 Pa | -85.51 Pa | 208.05 Pa |
| 236 platoon − 6z | 107.17 Pa | -36.39 Pa | 143.56 Pa |
| 263 platoon − 6z | 99.75 Pa | -7.85 Pa | 107.60 Pa |
| 263 platoon − 3z | 205.22 Pa | -96.24 Pa | 301.46 Pa |
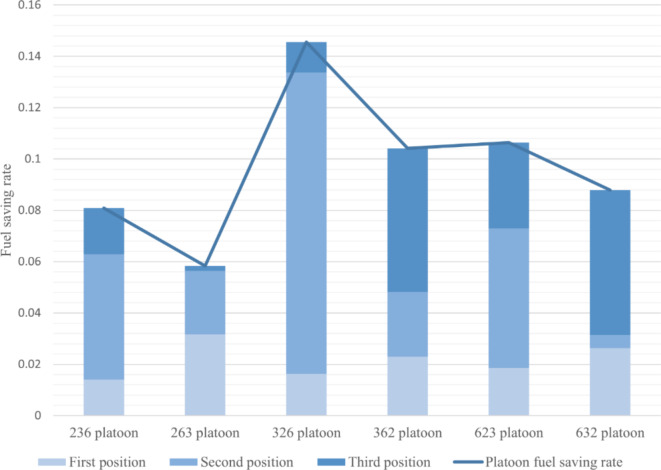
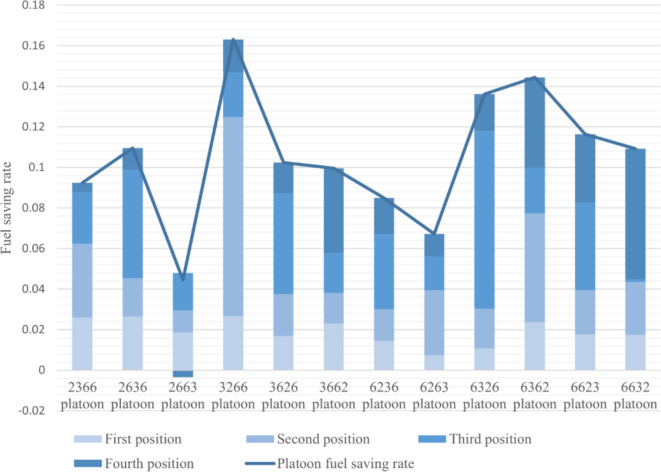
As shown in Fig. 4, the overall fuel savings for the three-vehicle platoon ranged from 5.83 to 14.55%. The best fuel-saving rates for the platoons were ranked as follows: 3-2-6, 6-2-3, 3-6-2, 6-3-2, 2-3-6, and 2-6-3. Therefore, we can infer that a 3-2-6 platoon achieves the best fuel savings in a fleet consisting of three different vehicle types.
Fig. 4.
Fuel-saving rate of three-axle, six-axle, and two-axle truck platoons.
CFD simulated analysis of a four-truck platoon
This section focuses on the numerical simulation analysis of a four-vehicle platoon with a non-uniform truck arrangement. Because the average fuel-saving effect of the queue is affected by the overall quality of the queue, to ensure the accuracy of the fuel-saving effect analysis, we divide the four-vehicle platoon into three groups and analyze them separately.
Simulation analysis of three-axle, six-axle, and two two-axle truck platoons
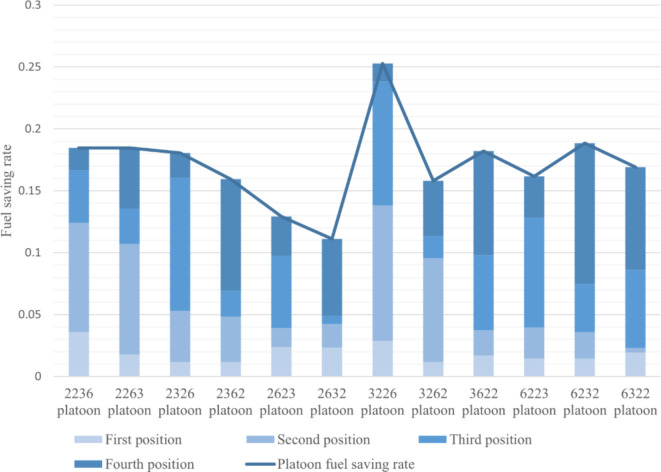
As shown in Fig. 5, the overall fuel savings for platoons consisting of three-axle trucks, six-axle trucks, and two-axle trucks varied between 11.12% and 25.27%. In the 2-6-3-2 platoon, the six-axle trucks had a large negative impact on the trucks at the back of the platoon, resulting in the lowest fuel savings. In contrast, in the 3-2-2-6 queue, the flow rate between trucks was lower, resulting in the best fuel savings for this platoon.
Fig. 5.
Fuel-saving rate of three-axle, six-axle and two two-axle truck platoons.
Simulation analysis of two-axle, six-axle, and two three-axle truck platoons
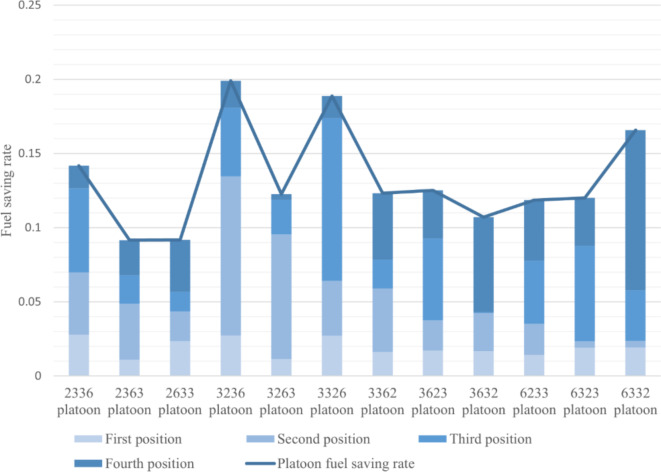
As shown in Fig. 6, the overall fuel savings for the platoon consisting of a two-axle truck, six-axle truck, and two three-axle trucks varied between 9.17% and 19.91%. In the 2-6-3-3 platoon, the high-speed airflow from the rear of the six-axle truck significantly reduced the fuel savings of the truck behind it, resulting in the worst fuel savings. In contrast, in the 3-2-3-6 cohort, the flow field between trucks had lower flow velocities, resulting in the best fuel savings for this platoon.
Fig. 6.
Fuel-saving rate of two-axle, six-axle, and two three-axle truck platoons.
Simulation analysis of two-axle, three-axle, and two six-axle truck platoons
As shown in Fig. 7, the overall fuel savings for the platoon consisting of a two-axle truck, a three-axle truck, and two six-axle trucks varied between 4.45% and 16.31%. The fuel savings of six-axle trucks decreased because the aerodynamic drag was a smaller part of the driving resistance of the trucks. In the platoon of trucks studied in this section, the three-axle truck in the fourth position of the 2-6-6-3 platoon was affected by the high-intensity turbulence created by the high-speed wake of the two six-axle trucks in front of it, which resulted in a negative gain, and hence, the worst fuel savings for this platoon. In contrast, the flow field between the trucks in the 3-2-6-6 platoon had low flow velocities; therefore, this platoon had the best fuel-saving effect.
Fig. 7.
Fuel-saving rate of two-axle, three-axle, and two six-axle truck platoons.
Heterogeneous platoon scheduling decisions for three trucks
As described in the previous section, a simulation analysis of a heterogeneous platoon of three types of trucks was performed, and the fuel-saving rates of the platoon as a whole and each truck were derived. Based on the simulation data, we analyzed the effects of different positions in the platoon and different types of front and rear vehicles on the fuel-saving effect of trucks interested in joining the fleet from the perspective of the trucks themselves to provide a basis for decision-making for the truck group arrangement.
Strategy for the sequence of two-axle trucks in a platoon
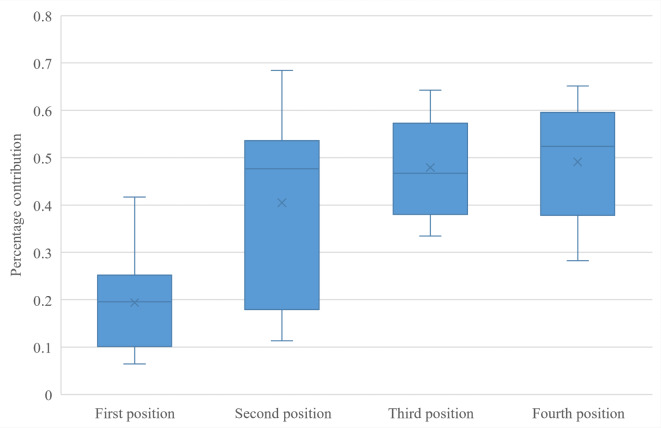
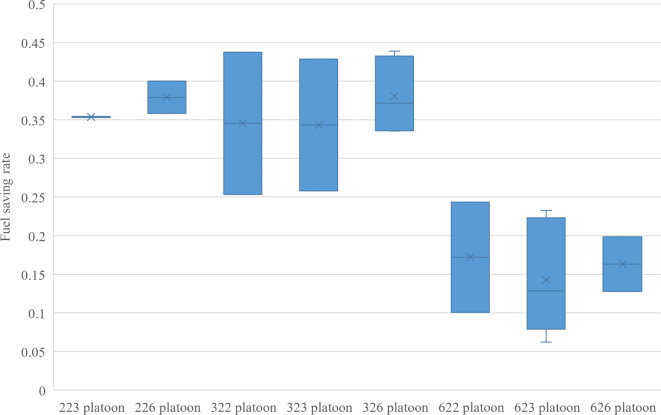
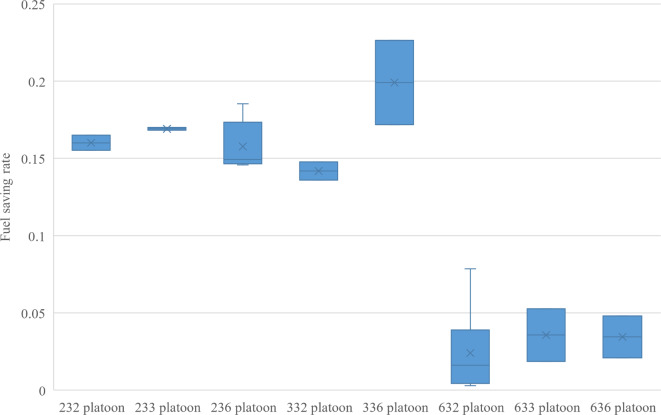
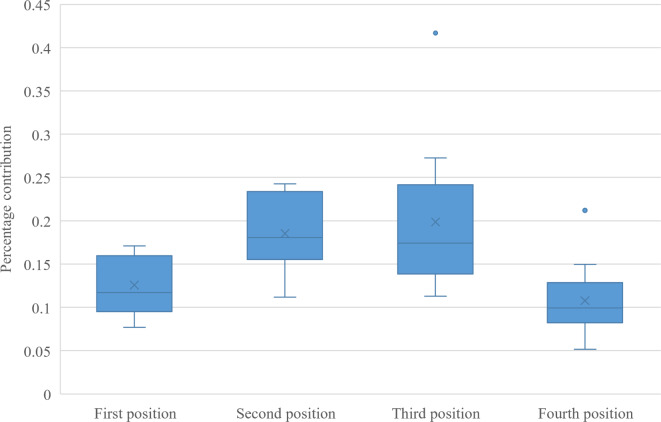
Based on the simulation data, both the change in the platoon and the change in the position of the platoon affected the fuel-saving effect of the two-axle truck. As the box plot in Fig. 8 shows, when the two-axle truck was in the third or fourth position of the platoon, its fuel-saving effect was better; however, when the two-axle truck was in the first position of the platoon, its fuel-saving effect was worse. Similarly, as shown in the box plot in Fig. 9, when the two-axle truck was located behind the six-axle truck, the fuel-saving rate of the two-axle truck decreased significantly.
Fig. 8.
Percentage contribution to fuel-savings of two-axle trucks at different positions in the platoon.
Fig. 9.
Fuel-saving rate of a two-axle truck in the middle.
Therefore, to maximize the fuel-saving effect of two-axle trucks, two-axle trucks intending to join the fleet should attempt to be in the third or fourth position in the platoon and avoid driving behind six-axle trucks.
Strategy for the sequence of three-axle trucks in a platoon
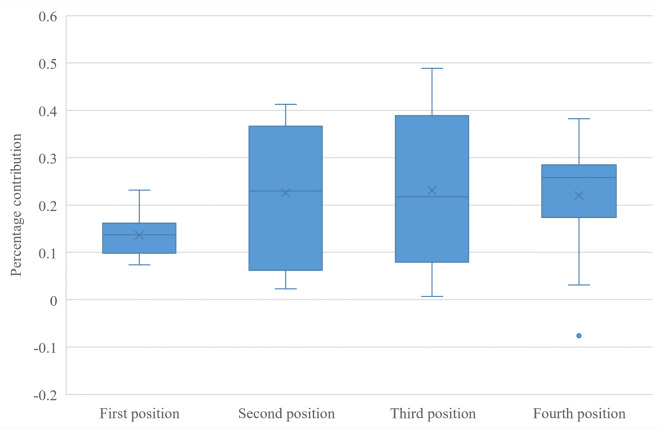
Similarly, the overall fuel-saving effect of three-axle trucks varied for different positions in the platoon. The box plot in Fig. 10 shows that the overall fuel-saving contribution of a three-axle truck was relatively low despite its larger total mass when the three-axle truck was in the second or third position of the platoon. However, the box plots in Fig. 11 show that similar to the two-axle trucks, the fuel savings of the three-axle trucks decreased significantly when they were behind the six-axle trucks.
Fig. 10.
Percentage contribution to fuel-savings of three-axle trucks at different positions in the platoon.
Fig. 11.
Fuel-saving rate of a three-axle truck in the middle.
Note that three-axle trucks may be affected by the high-speed tailpipe of a six-axle truck in front of them, resulting in poor fuel savings and even a negative gain. Therefore, to maximize the fuel-saving effect of three-axle trucks, the three-axle trucks intended to join the platoon should prioritize the second or third position and avoid being located at the rear of six-axle trucks.
Strategy for the sequence of six-axle trucks in a platoon
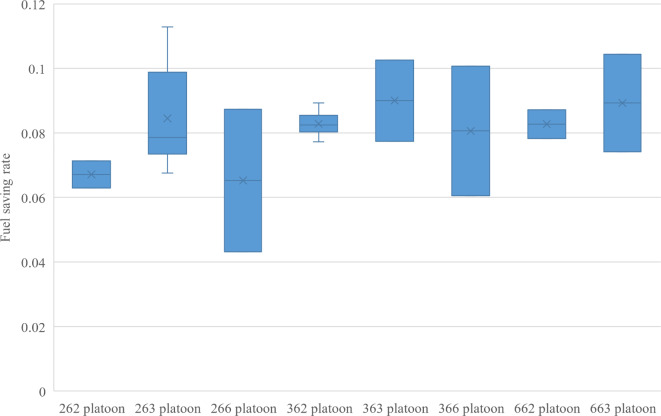
Because of their large total mass, six-axle trucks have a small proportion of aerodynamic drag in their traveling resistance, resulting in a relatively low overall fuel-saving effect. However, the different positions in the platoon have a relatively small effect on their fuel savings. The box plot in Fig. 12 shows that, although the six-axle truck performed better when it was in the second and third positions in the platoon, no negative gain was observed. However, the box plot in Fig. 13 suggests that six-axle trucks should avoid being located in front of other six-axle trucks to avoid a decrease in fuel savings.
Fig. 12.
Percentage contribution to fuel-savings of six-axle trucks at different positions in the platoon.
Fig. 13.
Fuel-saving rate of a six-axle truck in the middle.
Therefore, from the perspective of fuel savings for the six-axle trucks, when a six-axle truck is interested in joining a convoy, it should be in the second or third position in the platoon and avoid being in front of the six-axle trucks as much as possible. However, changes in the platoon and position in the platoon have a relatively small effect on the fuel efficiency of six-axle trucks.
Conclusion
In this study, three truck models were simulated and analyzed using the fluid simulation software XFlow for a non-uniform arrangement in a convoy on a motorway. The air resistance coefficients of each truck in the platoon were obtained, and the fuel-saving rates for each truck and entire platoon were calculated to assess the energy-saving effects of the three trucks.
Each truck contributed to the overall fleet fuel savings for a three-vehicle heterogeneous platoon. The overall fuel-saving rate of the fleet ranged from 5.83 to 14.55%, with the 3-2-6 platoon having the best fuel-saving effect. The 3-6-2 platoon was negatively affected by the high-speed wake of the six-axle trucks, resulting in the worst fuel-saving effect.
In the simulation analysis of the four-vehicle heterogeneous queue, we divided the four-vehicle platoon into three groups and analyzed them separately to ensure the accuracy of the fuel-saving effect analysis. In a heterogeneous vehicle platoon consisting of a three-axle truck, six-axle truck, and two two-axle trucks, the overall fuel savings ranged from 11.12 to 25.27%, with the 2-6-3-2 and 3-2-2-6 platoons having the worst and best fuel savings, respectively. In a heterogeneous vehicle platoon consisting of a two-axle truck, a six-axle truck, and two three-axle trucks, the overall fuel savings ranged from 9.17 to 19.91%, with the 2-6-3-3 and 3-2-3-6 platoons being the least and most fuel efficient, respectively. Finally, in a heterogeneous vehicle platoon consisting of a two-axle truck, a three-axle truck, and two six-axle trucks, the overall fuel savings ranged from 4.45 to 16.31%, with the 2-6-6-3 and 3-2-6-6 platoons being the least and most effective, respectively.
Therefore, from the perspective of the trucks, when a two-axle truck is interested in joining a platoon, the optimal position is the third or fourth position of the queue if possible, and it should avoid being at the rear of a six-axle truck. For a three-axle truck interested in joining a platoon, the optimal option is to be in the second or third position of the queue, and it should avoid being at the rear of a six-axle truck. For a six-axle truck interested in joining a platoon, the optimal position is the third or fourth position of the platoon, and it should avoid being at the rear of another six-axle truck. Note that changes in the platoon and position in the platoon have a relatively small effect on the fuel efficiency of six-axle trucks.
From the perspective of the platoon as a collective entity, the fuel savings of the 3-2-6 platoon, 3-2-2-6 platoon, 3-2-3-6 platoon, and 3-2-6-6 platoon are the most optimal within their respective categories. This is due to the fact that, based on the modelling of non-uniform displacements, the 3-axle and 2-axle trucks have the smallest safe inter-vehicle spacing, which consequently results in a significant fuel saving benefit. Furthermore, the substantial load capacity of the 6-axle trucks enables them to optimally utilise the vortex low-pressure region created by the preceding platoon when situated at the end of the formation. This results in a further notable enhancement in fuel savings in comparison to models with a lower load capacity. It can thus be concluded that a platoon combination that adheres to the 3-2-6 rule represents the optimal choice from the perspective of the platoon as a whole, as it allows for the achievement of substantial fuel savings.
Acknowledgements
This work was supported by the National Key Research and Development Program of China under Grant No. 2018YFA0703300, and the National Nature Science Foundation of China under Grant No. 51978310.
Author contributions
Zhifa Yang: Conceptualization, Investigation, Writing-original draft. Long Wang: Methodology, Writing-original draft. Zhuo Yu: Conceptualization, Writing – review & editing. Haiwei Wang: Investigation, Conceptualization. Wencai Sun: Investigation, Writing – review & editing.
Data availability
The datasets used and analyzed during the current study are available from the corresponding author on reasonable request.
Declarations
Competing interests
The authors declare no competing interests.
Footnotes
Publisher’s note
Springer Nature remains neutral with regard to jurisdictional claims in published maps and institutional affiliations.
Contributor Information
Zhuo Yu, Email: 13504464151@163.com.
Wencai Sun, Email: swcai@163.com.
References
- 1.Sun, H., Geng, Y., Hu, L., Shi, L. & Xu, T. Measuring China’s new energy vehicle patents: A social network analysis approach. Energy153 (JUN.15), 685–693 (2018). [Google Scholar]
- 2.Zabat, M., Stabile, N., Farascaroli, S. & Browand, F. The aerodynamic performance of platoons: A final report. Institute of Transportation Studies, Research Reports, Working Papers, Proceedings. (1995).
- 3.Hammache, M., Michaelian, M. & Browand, F. Aerodynamic forces on truck models, including two trucks in Tandem. Institute of Transportation Studies, Research Reports, Working Papers, Proceedings. (2001).
- 4.Lammert, M. P., Adam, D., Jeremy, D., Kevin, B. & Alex, N. Effect of Platooning on Fuel Consumption of Class 8 Vehicles Over a Range of Speeds, Following Distances, and Mass (2014).
- 5.Vohra, V., Wahba, M., Akarslan, G., Ni, R. & Brennan, S. An examination of vehicle spacing to reduce aerodynamic drag in truck platoons. In 2018 IEEE Vehicle Power and Propulsion Conference (VPPC) (2018).
- 6.Törnell, J., Sebben, S. & Elofsson, P. Experimental investigation of a two-truck platoon considering inter-vehicle distance, lateral offset and yaw. J. Wind Eng. Ind. Aerodyn.213, 104596 (2021). [Google Scholar]
- 7.Nayeri, C. N. & Schmidt, H. J. Platooning and base flaps for drag reduction of trucks. Int. J. Autom. Technol.23 (6), 1673–1680 (2022). [Google Scholar]
- 8.Altinisik, A., Yemenici, O. & Umur, H. Aerodynamic analysis of a passenger car at yaw angle and two-vehicle platoon. J. Fluids Eng.137 (12), 121107 (2015). [Google Scholar]
- 9.Wang, T. Optimization study of VISSIM following model for traffic emission measurement. TRAFFIC Transp.37 (04), 26–31 (2021). [Google Scholar]
- 10.Lu, Z., Chen, W., Wei, J. & Yu, H. Current situation and prospect of V2X with ultra-reliable and low-latency. J. Signal. Process.35, 1773–1783 (2019). [Google Scholar]
Associated Data
This section collects any data citations, data availability statements, or supplementary materials included in this article.
Data Availability Statement
The datasets used and analyzed during the current study are available from the corresponding author on reasonable request.


