Abstract
Aim
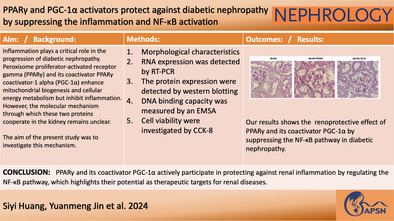
Inflammation plays a critical role in the progression of diabetic nephropathy. Peroxisome proliferator‐activated receptor gamma (PPARγ) and its coactivator PPARγ coactivator‐1 alpha (PGC‐1α) enhance mitochondrial biogenesis and cellular energy metabolism but inhibit inflammation. However, the molecular mechanism through which these two proteins cooperate in the kidney remains unclear. The aim of the present study was to investigate this mechanism.
Methods
HK‐2 human proximal tubular cells were stimulated by inflammatory factors, the expression of PPARγ and PGC‐1α were determined via reverse transcription‐quantitative polymerase chain reaction (PCR) and western blotting (WB), and DNA binding capacity was measured by an EMSA. Furthermore, db/db mice were used to establish a diabetic nephropathy model and were administered PPARγ and PGC‐1α activators. Kidney injury was evaluated microscopically, and the inflammatory response was assessed via WB, immunohistochemistry and immunofluorescence staining. Besides, HK‐2 cells were stimulated by high glucose and inflammatory factors with and without ZLN005 treatment, the expression of PPARγ, PGC‐1α, p‐p65 and p65 were determined via qPCR and WB.
Results
Our results revealed that both TNF‐α and IL‐1β significantly decreased PPARγ and PGC‐1 expression in vitro. Cytokines obviously decreased PPARγ DNA binding capacity. Moreover, we detected rapid activation of the NF‐κB pathway in the presence of TNF‐α or IL‐1β. PPARγ and PGC‐1α activators effectively protected against diabetic nephropathy and suppressed NF‐κB expression both in db/db mice and HK‐2 cells.
Conclusion
PPARγ and its coactivator PGC‐1α actively participate in protecting against renal inflammation by regulating the NF‐κB pathway, which highlights their potential as therapeutic targets for renal diseases.
Keywords: inflammation, kidney, NF‐κB, PGC‐1α, PPARγ
Summary at a Glance
PPARγ and its coactivator PGC‐1α actively participate in protecting against renal inflammation by regulating the NF‐κB pathway. Their activator Rosiglitazone and ZLN005 have renoprotective effects on the prevention and treatment of diabetic nephropathy.
1. INTRODUCTION
Inflammation is one of the most important factors in the development of various complications of renal diseases and leads to renal injury and renal insufficiency. Proinflammatory cytokines such as tumour necrosis factor‐α (TNF‐α) and interleukin‐1β (IL‐1β) play a major role in the onset of acute and chronic inflammatory responses in the kidney by activating the NF‐κB pathway. 1 , 2 Our previous studies revealed the importance of proinflammatory mechanisms in diabetic nephropathy through differentially expressed RNAs between diabetic nephropathy patients and normal controls. 3
Peroxisome proliferator‐activated receptors (PPARs) are a group of nuclear transcription factors that play key roles in the regulation of lipid metabolism and inflammation. Among the various subtypes of PPARs, peroxisome proliferator‐activated receptor gamma (PPARγ) is the best‐characterized receptor in humans and is widely expressed in the nuclei of mesangial and epithelial cells in glomeruli, proximal and distal tubules. 4 PPARγ has been verified to exert renoprotective effects through an anti‐inflammatory mechanism in glomerulosclerosis, glomerulonephritis, and interstitial inflammation. 5 , 6 Corepressors inhibit and coactivators stimulate PPARγ activity by binding to PPARγ and changing its conformation without directly binding to DNA. 7 , 8 Previous studies have also demonstrated that PPARγ and its coactivator, PPARγ coactivator‐1 alpha (PGC‐1α), exert renoprotective effects against diabetic nephropathy through metabolic and antioxidative mechanisms. 9 , 10
Investigations have verified that the expression of coregulators is crucial for nuclear receptor‐mediated transcription, and some coregulators have been demonstrated to target diverse intracellular signalling pathways and posttranslational modifications. 11 , 12 , 13 Moreover, recent studies suggested that some coactivators are regulated together with nuclear receptors during the inflammatory response induced by TNF‐α and IL‐1β in the heart, the liver, the brain and adipose tissue. 14 , 15 However, the molecular mechanism underlying the anti‐inflammatory effects of PPARγ and PGC‐1α in the kidney has not been fully elucidated.
In the present study, we investigated the changes in the expression of PPARγ and its coactivators, including steroid receptor coactivators (SRCs) and PGC‐1α, in vitro after treatment with TNF‐α and IL‐1β, as well as changes in NF‐κB pathway activity to explore the mechanism underlying these changes. We further verified the effects of activating PPARγ and PGC‐1α on diabetic nephropathy and the mechanisms related to NF‐κB.
2. MATERIALS AND METHODS
2.1. Materials
Cytokines (human TNF‐α and human IL‐1β) and PPARγ activator (Rosiglitazone) were purchased from Sigma–Aldrich (St. Louis, MO). Serum‐free keratinocyte medium for cell culture was obtained from Invitrogen Co., Ltd. (United States), and supplemented with bovine pituitary extract (BPE) and epidermal growth factor (EGF). PGC‐1α activator (ZLN005) was obtained from Selleck Co., Ltd. (China) and was diluted with 0.5% sodium carboxymethylcellulose (Sangon Biotech Co., Ltd.) (China).
2.2. Cell culture
HK‐2 cells (immortalized human proximal tubular cell line CRL‐2190) were purchased from American Type Culture Collection (Rockville, MD) and maintained in the serum‐free keratinocyte medium mentioned above. The cells were cultured in a 37°C incubator in 5% CO2 and subcultured using 0.05% trypsin‐0.02% EDTA once they reached 80% confluence (invitrogen).
2.3. Animal experiments
A total of 18 male db/db diabetic mice on the C57BL/KsJ (BKS.Cg‐Dock7m+/+Leprdb/Nju) background weighing 32–34 g and 6 male nondiabetic littermate control db/m mice weighing 16–18 g (6 weeks old) were obtained from Nanjing Biomedical Research Institute of Nanjing University (Nanjing, China). The animals were bred in the laboratory animal center at Ruijin Hospital, Shanghai Jiao Tong University School of Medicine (Shanghai, China) as previously described. 12 The mice were divided into the following four groups (n = 6/group): the control group (db/m mice); the db/db group (db/db mice), the db/db + ROSI group (db/db mice administered 20 mg/kg/day Rosiglitazone by gavage for 8 weeks) and the db/db + ZLN group (db/db mice administered 15 mg/kg/day ZLN005 by gavage for 8 weeks). The mice were housed in a specific pathogen‐free room at a constant temperature of 22 ± 2°C and a constant humidity of 50± 5%, in normal air (CO2) on a 12‐h light/dark cycle and were allowed free access to chow and water. The mice were sacrificed after treatment for 8 weeks. Surgeries were performed under general anaesthesia with isoflurane. All procedures were performed in accordance with the guidelines established by the National Research Council Guide for the Care and Use of Laboratory Animals and with the approval of our Institute Animal Care and Use Committee (IACUC). The experiments are reported in accordance with the ARRIVE guidelines (https://arriveguidelines.org) and other relevant guidelines and regulations.
2.4. Cell viability test (CCK‐8 assay)
The cell counting Kit‐8 (CCK‐8) assay was used to evaluate the viability of HK‐2 cells. The cells were seeded into 96‐well cell culture plates and stimulated with 30 mM glucose with or without the drug according to the group. After 48 h of cultivation, the medium was discarded and replaced with fresh DMEM/F12 medium containing 10 μL of CCK‐8 solution (Dojindo, Japan). Afterward, the cells were incubated at 37°C for 2–4 h, and the absorbance was measured at 450 nm using a microplate reader.
2.5. RNA isolation and real‐time quantitative reverse transcription–polymerase chain reaction (RT–PCR)
Total RNA was extracted from renal cortex tissues using TRIzol (Applied Biosystems, Waltham, MA, USA). The RNA concentration was measured by an ND‐1000 spectrophotometer (NanoDrop Technologies, Wilmington, DE, USA). First‐strand cDNA synthesis was carried out by using a reverse transcription kit according to the manufacturer's instructions (Promega, Madison, WI). Real‐time polymerase chain reaction (PCR) amplification was performed using SYBR Green master mix (Toyobo, Japan) and an Opticon Real‐time PCR Detection System (Bio‐Rad). Primers for GAPDH, PPARγ, SRC‐1, SRC‐2, and PGC‐1 were designed using Primer software, and the sequences were as follows: GAPDH, 5′‐CAG‐GGC‐TGC‐TTT‐TAA‐CTC‐TGG‐TAA‐3′ (sense) and 5′‐ GGG‐TGG‐AAT‐CAT‐ATT‐GGA‐ACA‐TGT‐3′ (antisense); PPARγ, 5′‐GGG‐CCC‐TGG‐CAA‐AAC‐ATT‐3′ (sense) and 5′‐AAG‐ATC‐GCC‐CTC‐GCC‐TTT‐3′ (antisense); SRC‐1, 5′‐TGG‐GTA‐CCA‐GTC‐ACC‐AGA‐CA‐3′ (sense) and 5′‐GAA‐TGT‐TTG‐CGT‐TTC‐CAC‐CT‐3′ (antisense); SRC‐2, 5′‐GAC‐AGA‐TCG‐TGC‐CAG‐TAA‐CAC‐AA‐3′(sense) and 5′‐TTC‐AGC‐TGT‐GAG‐TTG‐CAT‐GAG‐G‐3′ (antisense); PGC‐1, 5′‐CCA‐AGA‐CCA‐GCA‐GCT‐CCT‐A‐3′ (sense) and 5′‐CCA‐CTG‐TCA‐AGG‐TCT‐GCT‐CA‐3′(antisense); monocyte chemoattractant protein‐1 (MCP‐1), 5′‐CAG‐CCA‐GAT‐GCA‐ATC‐AAT‐GC‐3′ (sense) and 5′‐GTG‐GTC‐CAT‐GGA‐ATC‐CTG‐AA‐3′ (antisense). Relative mRNA expression was normalized to the expression of GAPDH and calculated using the comparative Ct (∆∆Ct) method.
2.6. Western blot analysis
The nuclear and cytosolic fractions of HK‐2 cells were isolated using NE‐PER™ Nuclear and Cytoplasmic Extraction reagents (Thermo Fisher Scientific, Inc., Waltham, MA, USA), and renal tissues were lysed in radioimmunoprecipitation assay buffer (Beyotime Institute of Biotechnology, Haimen, China) containing protease inhibitor cocktail (Bimake, Houston, TX, USA) to extract total protein. The protein concentration was determined by the bicinchoninic acid (BCA) method using a BCA Protein Assay Kit (Shanghai Epizyme Biotechnology, China). Western blotting (WB) was performed as previously described. 16 The following primary antibodies were used: anti‐PPARγ (Santa Cruz Biotechnology), anti‐NLRP3 (Novus Biologicals), anti‐PGC‐1α (EMD Millipore), anti‐MCP‐1 (Proteintech), anti‐NF‐κB p65, anti‐phospho‐NF‐κB p65 (Cell Signalling Technology), anti‐nephrin and anti‐NF‐κB (Abcam) antibodies. The immunoblot density was examined by ImageJ and normalized by β‐actin, GAPDH or LaminB (corresponding antibodies obtained from Abcam).
2.7. MCP‐1 assays
Culture supernatants were collected from 6‐well plates, and the concentration of MCP‐1 was measured by enzyme‐linked immunosorbent assay (ELISA) according to the manufacturer's protocol (R&D Systems, Abingdon, UK) and normalized to the cellular protein concentration.
2.8. Electrophoretic mobility shift assay
Nuclear protein (10 μg) was added to DNA binding buffer. The resulting nucleoprotein complexes were separated on a 6% native polyacrylamide gel in 0.5 × TBE buffer, dried, and visualized by autoradiography. In each set of experiments, self‐competition electrophoretic mobility shift assay (EMSA) was performed by adding an excess of the same unlabeled oligonucleotide probe or a corresponding mutant oligonucleotide probe to the binding reaction during the preincubation step. The sequences of the oligonucleotides were as follows: peroxisome proliferator response element (PPRE), 5′biotin‐GAT‐CCT‐CCC‐GAA‐CGT‐GAC‐CTT‐TGT‐CCT‐GGT‐CCA‐3′ and 3′biotin‐CTA‐GGA‐GGG‐CTT‐GCA‐CTG‐GAA‐ACA‐GGA‐CCA‐GGT‐5′; mutant PPRE, 5′biotin‐GAT‐CCT‐CCC‐GAA‐CGC‐AGC‐TGT‐CAG‐CTG‐GGT‐CCA‐3′ and 3′biotin‐CTA‐GGA‐GGG‐CTT‐GCG‐TCG‐ACA‐GTC‐GAC‐CCA‐GGT‐5′; NF‐κB response element, 5′biotin‐AGT‐TGA‐GGG‐GAC‐TTT‐CCC‐AGG‐C‐3′ and 3′biotin‐TCA‐ACT‐CCC‐CTG‐GGG‐TCC‐G‐5′; and mutant NF‐κB response element, 5′biotin‐AGT‐TGA‐GGC‐GAC‐TTT‐CCC‐AGG‐C‐3′ and 3′biotin‐TCA‐ACT‐CCG‐CTG‐AAA‐GGG‐TCC‐G‐5′.
2.9. Biochemical analysis of serum and urine samples
The protein concentration in the urine was measured using a BCA Protein Assay Kit (Shanghai Epizyme Biotechnology, China), and the glucose concentration in the serum was measured with a Glucose LiquiColor® test kit (EFK Diagnostics, Inc., Boerne, TX, USA). After 8 weeks of treatment, urine was collected over 24 h in metabolic cages to measure urinary protein excretion (UAE). Blood from the caudal vein was collected to monitor the serum glucose concentration.
2.10. Kidney histopathology
Kidney histopathology was performed as previously described. 12 Kidneys were removed from euthanized mice, immediately cut in half, fixed in 10% formaldehyde in 0.1 mol/L phosphate buffer (PBS) (pH 7.2) at 4°C for 24 h, embedded in paraffin and sectioned at 4 μm. The 4‐μm‐thick sections were dewaxed in xylene, rehydrated in decreasing concentrations of ethanol and washed in PBS. Subsequently, one section from each sample was stained with periodic acid‐Schiff (Goodbio Technology Co., Ltd., Wuhan, China). Following staining, the sections were dehydrated in increasing concentrations of ethanol and xylene. The general histological alterations in glomerular and tubular structures were evaluated under a light microscope.
2.11. Immunohistochemistry and immunofluorescence staining
Kidney tissues were immersion‐fixed in 4% paraformaldehyde in 0.1 M sodium PBS. The kidney samples were embedded in paraffin, sliced into 4 μm thick sections, deparaffinized for 10 min with 3% hydrogen peroxide and blocked in 3% BSA for half an hour at room temperature. After antigen retrieval, immunohistochemical staining was performed by incubation with the following biotinylated primary antibodies overnight at 4°C: anti‐TNF‐α (1:100; Abcam, ab307164), anti‐IL‐1β (1:400; Servicebio, GB11113), and anti‐PPARγ (1:600; Servicebio, GB112205). Subsequently, an HRP‐DAB system was used to detect immunoreactivity, and the sections were counterstained with Harris's haematoxylin. Ten random images per section were taken under a light microscope (three mice per group). To analyse the phenotype of macrophages in the kidney tissues, kidney sections were stained with antibodies against CD86 (1:400; Cell Signalling Technology, Danvers, MA, USA) and CD206 (1:200; Cell Signaling Technology, Danvers, MA, USA). Cell nuclei were counterstained with DAPI (Beyotime, Nantong, China). Ten random images of each section were captured in a blinded manner (three mice per group).
2.12. Transmission electron microscopy
Renal cortical tissues were fixed in 2% glutaraldehyde in phosphate‐buffered saline (pH 7.4). The samples were further incubated with 2% osmium tetroxide in phosphate‐buffered saline (pH 7.4) for 2 h at 4°C. Ultrathin sections were stained with lead citrate and uranyl acetate and viewed under an HT770 transmission electron microscope (Hitachi, Japan) at an accelerating voltage of 80 kV as previously described. 17
2.13. Statistical analysis
The data are expressed as the mean ± SEM. Multiple comparisons were examined for significant differences using analysis of variance (ANOVA) followed by Bonferroni correction. All experiments were repeated at least three times, and representative experiments were shown. Statistical significance was set at p < .05.
3. RESULTS
3.1. TNF‐α and IL‐1β decrease PPARγ mRNA and protein levels
As shown in Figure 1, we first investigated the dose‐dependent effect and of TNF‐α and IL‐1β on PPARγ expression in HK‐2 cells and the time course of this effect. At the 24‐h time point, TNF‐α induced a dose‐dependent decrease in PPARγ mRNA levels, with a nearly 60% decrease in the 10 ng/mL TNF‐α treatment group compared with the control group (Figure 1A). IL‐1β also decreased PPARγ mRNA levels by nearly 50% at the same concentration (Figure 1C). Thereafter, we selected 10 ng/mL TNF‐α and 10 ng/mL IL‐1β for subsequent experiments in this study.
FIGURE 1.
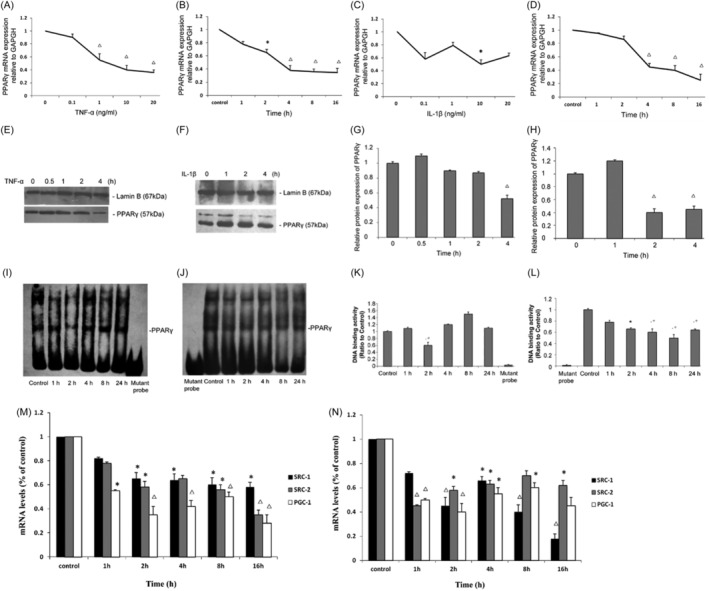
Effects of tumour necrosis factor‐α (TNF‐α) and interleukin‐1β (IL‐1β) on the expression of peroxisome proliferator‐activated receptor gamma (PPARγ), SRC‐1, SRC‐2, PGC‐1 and the binding of nuclear proteins to PPARγ in HK‐2 cells. Total mRNA levels of PPARγ when HK‐2 cells were cultured for 24 h with various concentrations of TNF‐α (A) and IL‐1β (B) as indicated. Additionally, total mRNA levels of PPARγ when HK‐2 cells were cultured with 10 ng/mL TNF‐α (C) or IL‐1β (D) for various durations as indicated. (E, F) Nuclear protein of HK‐2 cells treated for various durations with 10 ng/mL TNF‐α or IL‐1β was extracted, and Western blot analysis was performed using antibodies recognizing PPARγ as described in the Methods section. (G, H) Relative protein levels (% of the control group) normalized to Lamin B levels are reported. 10 μg of the nuclear protein was used for the electrophoretic mobility shift assay (EMSA) with oligonucleotides corresponding to PPARγ‐specific response elements as described in the Materials and Methods. (I, J) Representative EMSA results for the nuclear receptors studied. (K, L) Quantification of the EMSA data from individual experiments. Total mRNA levels of SRC‐1, SRC‐2 and PGC‐1 when HK‐2 cells were treated for various durations with 10 ng/mL TNF‐α (M) or IL‐1β (N). The data (means±SEMs, n = 3) are expressed as percentages of the control values.*p < .05 versus the contro groupl, △ p < .01 versus the control group.
Furthermore, at different time points, 10 ng/mL TNF‐α and IL‐1β decreased PPARγ mRNA expression as early as 4 h after treatment (Figure 1B,D). We also examined PPARγ protein levels, 10 ng/mL TNF‐α or IL‐1β induced a decrease in PPARγ protein levels at 4 h after treatment or even (2 h after treatment) (Figure 1E–H). Taken together, these results demonstrate that TNF‐α and IL‐1β could rapidly suppress PPARγ expression and that this decrease was sustained.
3.2. TNF‐α and IL‐1β decrease the binding of nuclear proteins to PPARγ response elements
To determine whether the decrease in PPARγ expression induced by TNF‐α and IL‐1β influenced the binding of nuclear proteins to PPREs, we carried out EMSAs. PPARγ binding activity was significantly reduced by 10 ng/mL IL‐1β (Figure 1J,L) as early as 2 h after treatment, and this effect was sustained for 24 h. PPARγ binding activity was also decreased by TNF‐α (Figure 1I,K) at 2 h after treatment but gradually recovered beginning at 4 h after treatment. These data demonstrate that TNF‐α and IL‐1β could reduce the binding of PPARγ to known cognate response elements of their target genes, especially at the early stage after stimulation.
3.3. TNF‐α and IL‐1β influence the levels of the coactivators SRC‐1, SRC‐2 and PGC‐1
Since TNF‐α and IL‐1β could strongly decrease the expression levels of PPARγ, we examined whether cytokine treatment also affects the expression of coactivators (including SRC‐1, SRC‐2 and PGC‐1). We found that the mRNA levels of SRC‐1 and SRC‐2, which are p160 family coactivators, decreased by 35% and 41%, respectively, within 2 h after TNF‐α (10 ng/mL) treatment (Figure 1M). The expression of PGC‐1, another coactivator of PPARγ, was also markedly decreased by 46% as early as 1 h after TNF‐α stimulation (Figure 1M). Similarly, treatment with IL‐1β (10 ng/mL) also reduced the mRNA levels of SRC‐1, SRC‐2 and PGC‐1 by 43%, 58% and 48%, respectively, within 2 h (Figure 1N). These results proved that the mRNA levels of the coactivators SRC‐1, SRC‐2 and PGC‐1 in addition to that of PPARγ could be influenced by TNF‐α and IL‐1β, and this change may contribute to cytokine‐induced renal interstitial inflammation.
3.4. TNF‐α and IL‐1β effectively induce NF‐κB activation and MCP‐1 production
To explore the mechanism underlying the inhibitory effects of TNF‐α and IL‐1β on PPARγ and its coactivators, we focused on the NF‐κB pathway, which plays a critical regulatory role in inflammation and can be directly activated by TNF‐α and IL‐1β. Previous investigations have proven that the NF‐κB pathway is strongly related to PPARγ and can directly repress the expression of PPARγ and related genes.
By the EMSA, we found that TNF‐α or IL‐1β could significantly promote NF‐κB DNA binding activity at 2 h after treatment, at which point NF‐κB DNA binding activity was increased 2.5‐fold (Figure 2A,B) or 2.3‐fold relative to baseline (Figure 2C,D), respectively. MCP‐1 is a target of the NF‐κB pathway and plays important roles in the transmigration of inflammatory cells. Through ELISA we found that TNF‐α significantly increased the MCP‐1 protein concentration from 15.52 ± 1.05 pg/mL at baseline to 40.47 ± 0.97 pg/mL at 24 h after treatment (Figure 2E). Moreover, IL‐1β strongly increased the MCP‐1 concentration from 19.33 ± 2.33 pg/mL at baseline to 160.56 ± 2.8 pg/mL at 8 h after treatment (Figure 2E). These data verify that TNF‐α and IL‐1β effectively induced the activation of the NF‐κB signalling pathway under the same experimental conditions, mediating the downregulation of PPARγ and coactivator expression.
FIGURE 2.
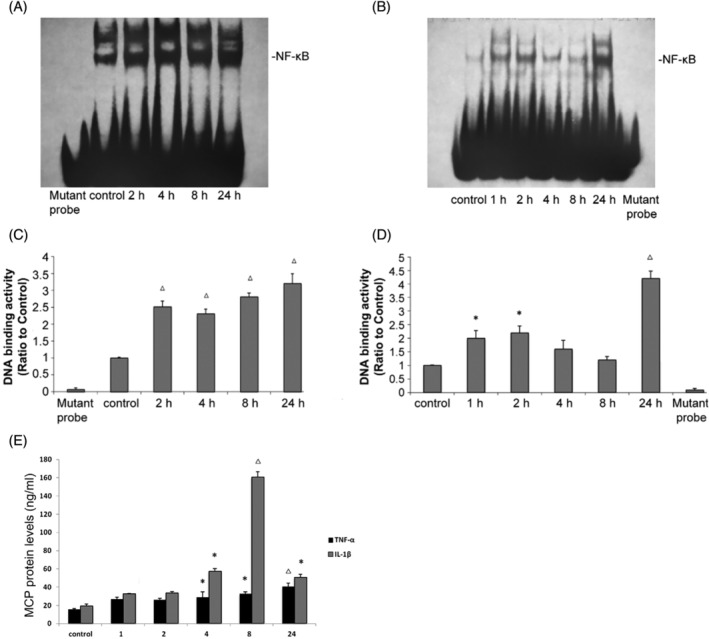
Tumour necrosis factor‐α (TNF‐α) and interleukin‐1β (IL‐1β) increase the binding of nuclear proteins to NF‐κB and monocyte chemoattractant protein‐1 (MCP‐1) expression. HK‐2 cells were treated with TNF‐α or IL‐1β at 10 ng/mL as indicated. Nuclear protein was used for the electrophoretic mobility shift assay (EMSA) with oligonucleotides corresponding to PPARγ‐specific response elements as described in the Materials and Methods. (A, B) Representative EMSA results for the nuclear receptors studied. (C, D) Quantification of the EMSA data from individual experiments. (E) MCP‐1 protein levels in the cell culture supernatant were determined by enzyme‐linked immunosorbent assay (ELISA) as described in the Materials and Methods. The data (means±SEMs, n = 3) are from duplicate experiments and expressed as percentages of the control values. *p < .05 versus the control group, △ p < .01 versus the control group. PPARγ, peroxisome proliferator‐activated receptor.
3.5. PPARγ and PGC‐1α activators protect against diabetic nephropathy and suppress NF‐κB expression in db/db mice
The body weight and serum glucose levels of 14‐week‐old db/db mice were significantly higher than those of db/m control mice (Figure 3A,B). Rosiglitazone administration but not ZLN005 administration reduced serum glucose levels to control levels, and neither agonist had any effect on the body weight of the db/db mice after 8 weeks of administration (Figure 3A,B). The 24‐h urinary protein level in 14‐week‐old mice in the db/db group was significantly increased compared with of in 14‐week‐old mice in the control group, and 8 weeks of treatment with either Rosiglitazone or ZLN005 significantly reduced the 24‐h urinary protein level in db/db mice (Figure 3C).
FIGURE 3.
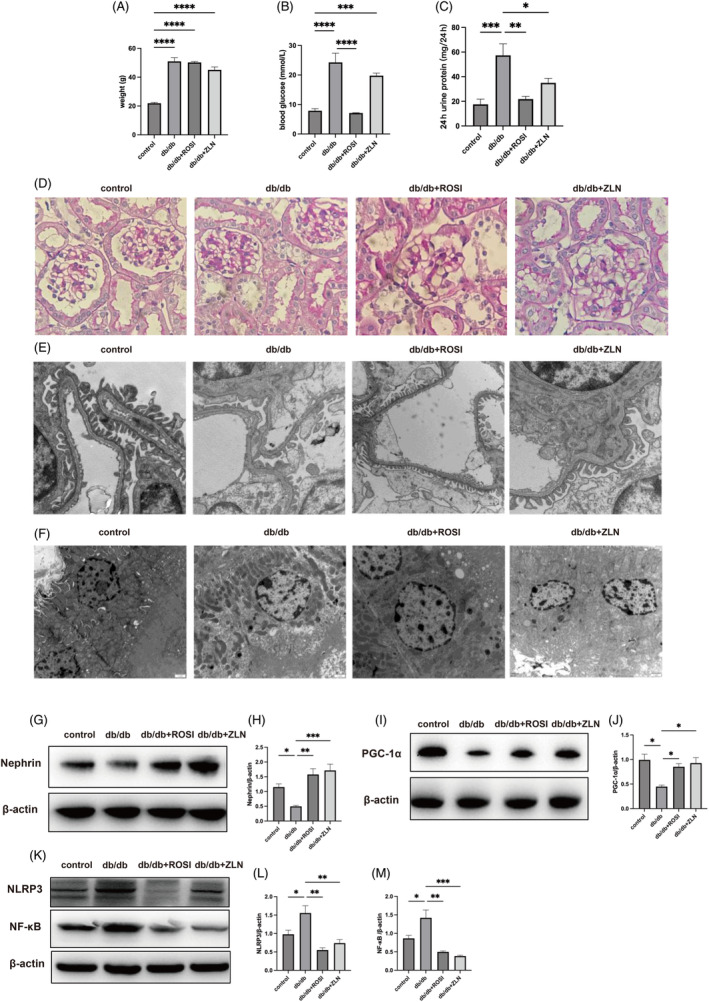
Treatment with Rosiglitazone or ZLN005 exerts protective effects against diabetic nephropathy and inhibits inflammation in the renal tissues of db/db mice. After 8 weeks of treatment, (A) body weight in the control, db/db, db/db + ROSI, db/db + ZLN groups was measured. (B) Blood glucose levels in the four mentioned groups were measured. (C) Twenty‐four‐hour urinary albumin excretion in mice from the four mentioned groups was measured. The data are presented as the mean ± SEM (n = 6 per group). Representative photomicrographs depicting (D) PAS staining in the four groups after the 8‐week experimental period. Original magnification, ×400. Representative transmission electron microscopy (TEM) micrographs of foot processes, the glomerular basement membrane (GBM) (E) and tubular cells (F) in the control, db/db, db/db + ROSI, db/db + ZLN groups. Original magnification, ×10 000. (G) Western blot (WB) analysis of nephrin and β‐Actin expression in the control, db/db, db/db + ROSI, db/db + ZLN groups. (H) Densitometric analysis of the WB results. The relative band intensity was normalized to the intensity of the corresponding β‐actin band. (I) WB analysis of PPARγ coactivator‐1 alpha (PGC‐1α) and β‐actin expression in the control, db/db, db/db + ROSI, db/db + ZLN groups. (J) Densitometric analysis of the WB results. The relative band intensity was normalized to the intensity of the corresponding β‐actin band. (K) WB analysis of NF‐κB, NLRP3 and β‐Actin expression in the control, db/db, db/db + ROSI, db/db + ZLN groups. (L, M) Densitometric analysis of the WB results. The relative band intensity was normalized to the intensity of the corresponding β‐actin band. The data are presented as the mean ± standard deviation (n = 6 per group). NS p ≥ .05, *p < .05, **p < .01, ***p < .001, ****p < .0001.
PAS staining revealed obvious mesangial cell proliferation and mesangial matrix expansion in the db/db group compared with the control group, and treatment with either Rosiglitazone or ZLN005 markedly attenuated the pathological characteristics, resulting in only minor differences between the drug treatment groups and the control group (Figure 3D). Transmission electron microscopy (TEM) micrographs revealed that podocyte foot processes effaced, the glomerular basement membrane (GBM) was thickened, and the density and quantity of mitochondria in tubule cells were decreased in the db/db mice compared with control mice, and morphological damage was alleviated after treatment with Rosiglitazone or ZLN005 (Figure 3E,F).
Total protein was extracted from kidney tissues, and the western blotting results showed significantly reduced expression of nephrin and PGC‐1α (Figure 3G–J) but significantly increased levels of NF‐κB and NLRP3 in db/db mice compared with control mice (Figure 3K–M); additionally, Rosiglitazone or ZLN005 treatment reversed these changes. These results indicate both PPARγ and PGC‐1α played a renoprotective role in diabetic nephropathy and that PGC‐1α expression was increased while NF‐κB levels were reduced.
3.6. Rosiglitazone or ZLN005 treatment alleviates the renal inflammatory response and renal fibrosis induced by diabetic nephropathy
The protein expression levels of TNF‐α and IL‐1β were upregulated and the protein expression of PPARγ was downregulated in renal sections from the db/db group compared with those from the control group. After treatment with either Rosiglitazone or ZLN005, the increase in TNF‐α and IL‐1β levels was inhibited, concomitant with the restoration of PPARγ expression (Figure 4A–D). Sirius Red staining and immunohistochemical staining for α‐SMA revealed obvious alleviation of collagen deposition and myofibroblasts in db/db mice under the treatment with either Rosiglitazone or ZLN005 (Figure 4E–G). To further substantiate the anti‐inflammatory and antifibrotic effects of Rosiglitazone or ZLN005, immunofluorescence was performed to evaluate macrophage phenotypes. As shown in Figure 5, the number of CD86+ and CD206+ macrophages was greater in the db/db group than in the control group. Following treatment with either Rosiglitazone or ZLN005, there was a reduction in the number of CD86+ macrophages coupled with a decrease in the number of CD206+ macrophages; CD86+ macrophages are proinflammatory macrophages, while CD206+ macrophages highly express fibrosis‐promoting genes and can be converted into fibrocytes. Notably, these findings suggest the potential renoprotective effects of Rosiglitazone or ZLN005 against inflammation and fibrosis.
FIGURE 4.
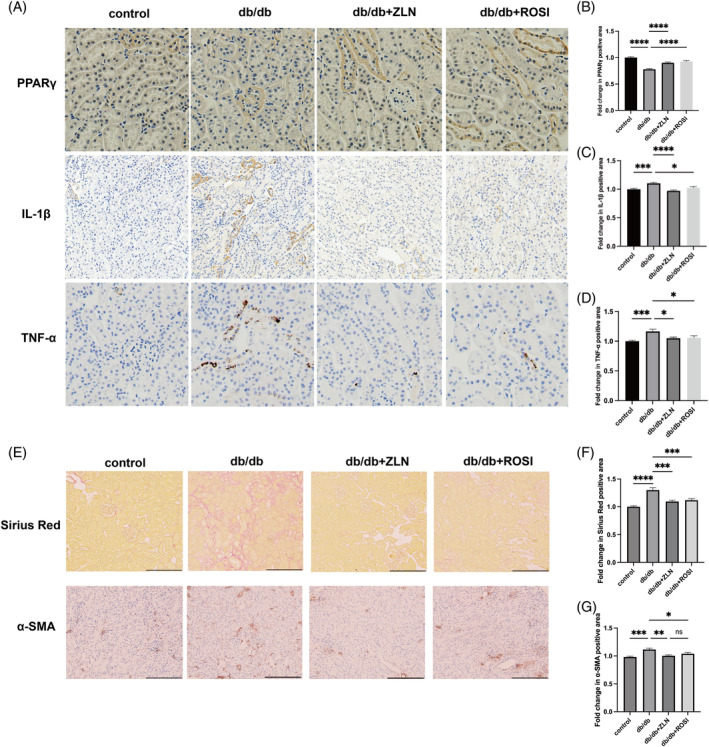
Rosiglitazone or ZLN005 alleviates renal inflammatory response and fibrosis in diabetic nephropathy mice. (A) Representative images of immunohistochemical staining for peroxisome proliferator‐activated receptor (PPARγ), tumour necrosis factor‐α (TNF‐α) and interleukin‐1β (IL‐1β) at ×200 magnification. (B–D) the PPARγ‐positive, TNF‐α‐positive and IL‐1β‐positive areas in db/db mice, ZLN005 or Rosiglitazone treatment mice are shown as the fold change relative to the control group. (E) Representative photomicrographs depicting Sirius Red staining and immunohistochemical staining for α‐SMA in the control, db/db, db/db + ROSI, db/db + ZLN groups after the 8‐week experimental period. Original magnification, ×200. (F and G) the Sirius Red‐positive and α‐SMA‐positive areas in db/db mice, ZLN005 or Rosiglitazone treatment mice are shown as the fold change relative to the control group. (n = 10, NS p ≥ .05, *p < .05, ***p < .001, ****p < .0001).
FIGURE 5.
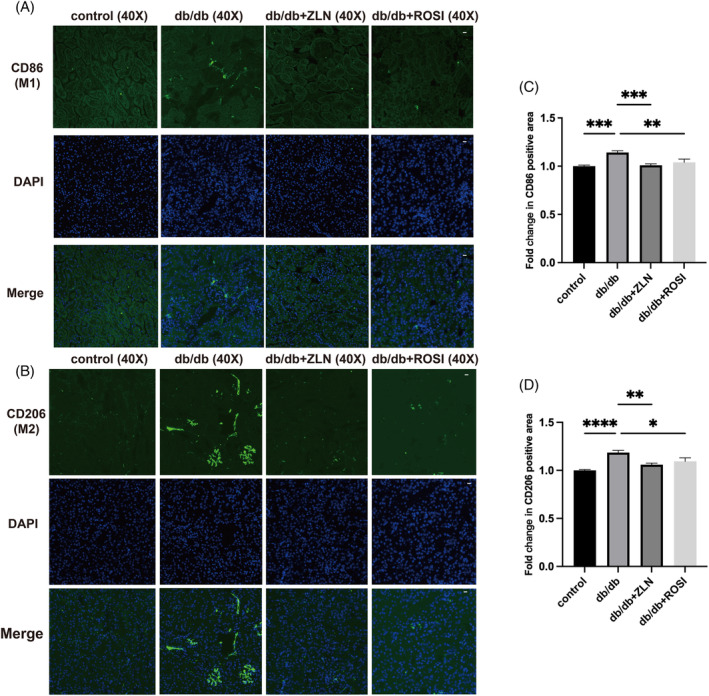
Effects of ZLN005 on macrophage phenotypes. (A and B) Representative images of immunofluorescence staining for the M1 macrophage marker CD86 and the M2 macrophage marker CD206 at ×40 magnification. Scale bar = 50 μm. (C and D) Quantification of CD86+ macrophages and CD206+ macrophages in db/db mice and db/m mice is shown as the fold change relative to the ZLN005 treatment group (n = 10, NS p ≥ .05, *p < .05, **p < .01, ***p < .001, ****p < .0001).
3.7. The PGC‐1α activator ZLN005 protects against diabetic nephropathy‐induced activation of NF‐κB by increasing PGC‐1α and PPARγ levels in HK2 cells
A safety analysis was conducted by administering different doses of ZLN005 to HK2 cells cultured in 5 mM glucose medium. The results presented in Figure 6 demonstrate a concentration‐dependent reduction in cell viability upon ZLN005 treatment, which was particularly noteworthy when ZLN005 concentrations in the cell culture medium exceeded 20 μM. Conversely, treatment with 2.5–10 μM ZLN005 significantly increased the viability of HK2 cells subjected to high‐glucose stimulation. HK2 cells were treated with ZLN005 at a concentration of 10 μM or lower in vitro. Both the protein and mRNA levels of PGC‐1α and PPARγ exhibited a marked increase in response to 10 μM ZLN005 treatment. Therefore, 10 μM ZLN005 was chosen for subsequent cell experiments.
FIGURE 6.
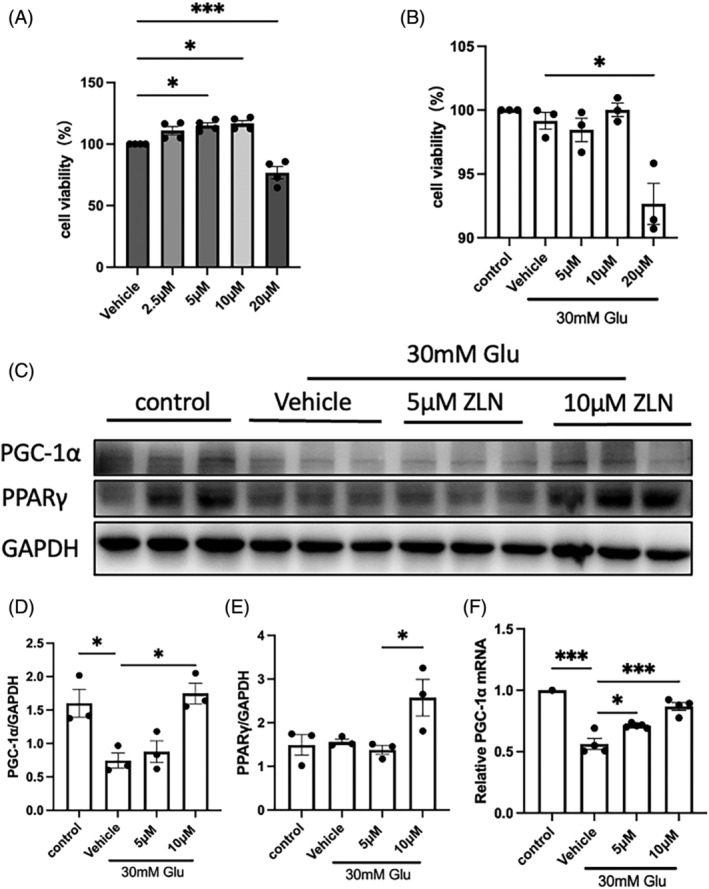
Effects of ZLN005 treatment on high glucose‐induced HK2 cell injury. (A) Summary data showing the viability of HK2 cells treated with 0, 2.5, 5, 10 or 20 μM ZLN005 under low‐glucose conditions to determine safe treatment concentrations. (B) Summary data showing the viability of HK2 cells cultured under low‐glucose conditions or treated with 0, 5, 10 or 20 μM ZLN005 under high‐glucose stimulation for 48 h. (C) Representative Western blot images and (D, E) summary data showing the dose‐dependent effect of ZLN005 on the high glucose‐induced decrease in PPARγ coactivator‐1 alpha (PGC‐1α) and peroxisome proliferator‐activated receptor gamma protein expression. (F) Summary data showing relative PGC‐1α mRNA levels in HK2 cells cultured under low‐glucose conditions or treated with 0, 5, or 10 μM ZLN005 under high‐glucose stimulation for 48 h. n = 8–9. NS p ≥ .05, *p < .05, **p < .01, ***p < .001.
Similar to high‐glucose stimulation, exposure to TNF‐α and IL‐1β at 10 ng/mL suppressed PGC‐1α and PPARγ protein expression while activating the NF‐κB pathway. All of these deleterious effects were mitigated to varying extents following ZLN005 treatment, as illustrated in Figure 7 and Figure S1. These results reveal the significance of a decrease in NF‐κB pathway activation as one of the mechanisms by which ZLN005 exerts renoprotective effects against diabetic nephropathy.
FIGURE 7.
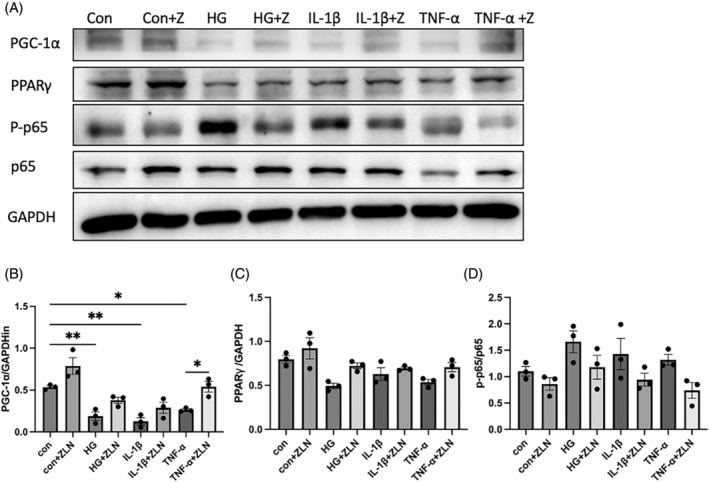
The peroxisome proliferator‐activated receptor (PPARγ) coactivator‐1 alpha (PGC‐1α) activator ZLN005 protects against diabetic nephropathy‐induced activation of NF‐κB by increasing PGC‐1α and PPARγ levels in HK2 cells. (A) Representative Western blot images and (B–D) summary data showing PGC‐1α, PPARγ and p65/p‐p65 protein levels in HK2 cells treated with ZLN005 or without ZLN005 and exposed to high glucose, interleukin‐1β and tumour necrosis factor‐α (TNF‐α). n = 8–9. NS p ≥ .05, *p < .05, **p < .01, ***p < .001.
3.8. Rosiglitazone or ZLN005 alleviates MCP‐1 production in diabetic nephropathy
The results presented in Figure 8A–F show that the protein levels of PGC‐1α and PPARγ exhibited a marked decrease in HK2 cells under exposure to high‐glucose and IL‐1β, while followed by different extent of increase in response to 50 μM Rosiglitazone treatment. The protein expression of MCP‐1 was upregulated in renal tissues from the db/db group compared with those from the control group, which was significantly alleviated after treatment with either Rosiglitazone or ZLN005 (Figure 8G,I). Similarly, the increased protein expression of MCP‐1 under high‐glucose stimulation was inhibited in vitro following the treatment with either Rosiglitazone or ZLN005 (Figure 8H,J). These results suggest that treatment with Rosiglitazone or ZLN005 suppressed MCP‐1 production in diabetic nephropathy, which may contributed to the reduced macrophage influx.
FIGURE 8.
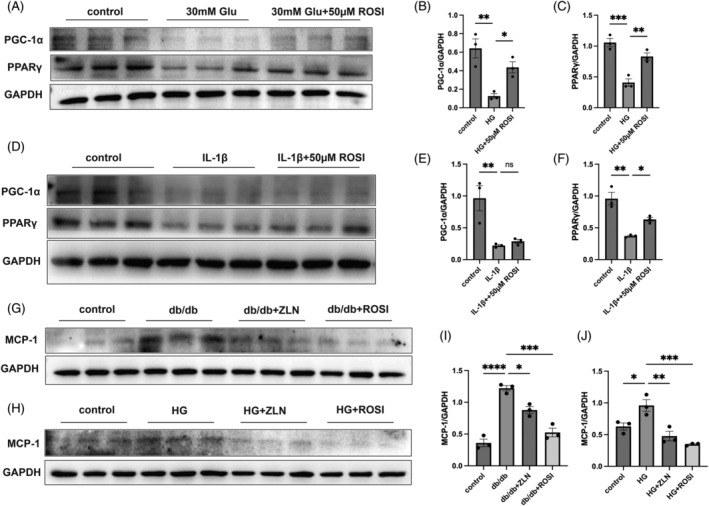
Rosiglitazone or ZLN005 alleviates diabetic nephropathy‐induced monocyte chemoattractant protein‐1 (MCP‐1) production. (A) Representative western blot (WB) images and (B and C) summary data showing the peroxisome proliferator‐activated receptor (PPARγ) coactivator‐1 alpha (PGC‐1α) and PPARγ protein expression levels in HK2 cells cultured under low‐glucose conditions or treated with 0, 50 μM Rosiglitazone under high‐glucose stimulation for 48 h. (D) Representative WB images and (E and F) summary data showing the PGC‐1α and PPARγ protein expression levels in HK2 cells treated with 0, 50 μM Rosiglitazone under interleukin‐1β stimulation for 48 h. (G) Representative WB images and (H) summary data showing MCP‐1 protein levels in kidney lysates of the control, db/db, db/db + ROSI, db/db + ZLN groups mice. (I) Representative WB images and (J) summary data showing MCP‐1 protein levels in HK2 cells treated with either Rosiglitazone or ZLN005 or without treatment under exposure to high glucose. n = 8–9. NS p ≥ .05, *p < .05, **p < .01, ***p < .001, **** p < .0001.
4. DISCUSSION
Numerous studies have confirmed the protective roles of the nuclear receptor PPARγ and its coactivators in the heart, the liver, the brain and adipose tissue. These roles involve a well‐established mechanism by which PPARγ and its coactivators govern the regulation of inflammatory responses, energy metabolism, and mitochondrial biogenesis. In acute renal failure, cisplatin deactivates PPARα by reducing its DNA‐binding activity and the expression of its specific coactivator PGC‐1. The administration of either LPS in vivo or TNF‐α in vitro decreases the expression of PPARs as well as its coactivators in the heart and adipose tissue. Moreover, inflammatory stimuli decrease the expression of PPARγ, SRC‐1, SRC‐2 and PGC‐1 in liver cells and uterine smooth muscle cells. Our results are consistent with those of previous work showing that PPARs and its coregulators actively contribute to the progression of inflammatory injuries.
We also explored the molecular mechanism underlying these effects. NF‐κB is a critical transcription factor whose signalling pathway represents a major avenue by which TNF‐α and IL‐1β inhibit PPARγ function. 18 , 19 , 20 , 21 , 22 , 23 Previous studies have confirmed that NF‐κB activation can inhibit PPARγ function in several ways. First, NF‐κB can cause direct phosphorylation of serine residues of the PPARγ protein, such as Ser112 and Ser82, resulting in a reduction in its transcriptional activity. 24 Second, in an acute manner, IκB degradation can cause the nuclear translocation of the PPARγ corepressor HDAC3 and increase the binding of the corepressor complex to PPARγ. 24 Moreover, recent studies have verified that NF‐κB directly interacts with PPARγ and its coactivators and downregulates the expression of transcriptional coactivators of PPARγ. In the present study, we also found that NF‐κB activity was greatly upregulated along with reduced expression of PPARγ as well as its coactivators, providing new evidence for the inhibitory effects of NF‐κB. However, the exact mechanism underlying this phenomenon and other possible contributors still need to be explored further.
PGC‐1α interacts with transcription factors of PPARs, nuclear respiratory factors (NRFs) family, oestrogen related receptors (ERRs) family, and other nuclear receptors to regulate their expression and function by binding to target genes, thereby widely regulating biological processes. PGC‐1α can participate in inducing the effective expression of glucose transporter GLUT4, thereby increasing the ability of cells to transport glucose to hypoglycemia and affecting processes such as glucose utilization and fatty acid oxidation in peripheral tissues, 25 also regulates insulin resistance and sensitivity in several pathological processes. 26 PPARγ has a strong interaction with PGC‐1α, inactivation of PPARγ will lead to insulin resistance as well. Besides, the direct regulatory effect of PPARγ on lipid metabolism and its critical role in insulin intercellular signalling further influence glucose levels, which may become the reason why we found that the activators of PPARγ and PGC‐1α differentially modulate glucose levels in this study.
Since Zhang et al. 27 reported that ZLN005 is a small molecule that induces PGC‐1α expression at the mRNA level in 2013, its antioxidative effects and ability to repair mitochondrial damage have been studied in nerve and cardiovascular tissues and cells. 28 , 29 , 30 However, to our knowledge, there are no reports on the effect of ZLN005 in kidney disease or its anti‐inflammatory effects. For the first time, we investigated the mechanism by which ZLN005, as a PGC‐1α activator, regulates inflammation in diabetic nephropathy. The data strongly suggested that ZLN005 induced PGC‐1α expression in kidney tissue, which protected against renal inflammatory injury and ameliorated diabetic nephropathy.
The downregulation of PPARγ and PGC‐1α by TNF‐α and IL‐1β was accompanied by an increase in the expression and DNA‐binding activity of the proinflammatory transcription factor NF‐κB in this study, which provides strong evidence for the molecular mechanism by which systemic and renal inflammation exacerbates kidney disease. The renoprotective effect of PPARγ and PGC‐1α activators through a mechanism involving NF‐κB expression and reduced inflammation was verified in both db/db diabetic nephropathy model mice and HK‐2 cells. In summary, these results highlight that PPARγ, together with its coactivator PGC‐1α, actively participates in renal inflammation through an NF‐κB‐related mechanism. Further exploration of the detailed underlying mechanisms may reveal novel potential therapeutic targets for renal inflammatory diseases.
There are several limitations of the current study as well. First, the mouse model we used in this study moduled diabetic nephropathy caused by T2DM, these findings need to be verified in diabetic nephropathy caused by T1DM. Second, more detailed experiments are needed to explore the exact mechanism of the effect of PPARγ and PGC‐1α mediates on macrophages in diabetic nephropathy. Third, the doses of Rosiglitazone used in the mouse model were much higher than those employed in clinical settings, the preventive and therapeutic effects, as well as the safety of Rosiglitazone and ZLN005 for clinical practice need further confirmation by well‐designed clinical research.
AUTHOR CONTRIBUTIONS
Weiming Wang and Nan Chen designed and supervised the study. Yuanmeng Jin, Siyi Huang, Liwen Zhang and Ying Zhou performed the experiments and data analysis. Siyi Huang, Liwen Zhang and Yuanmeng Jin wrote the manuscript. Weiming Wang and Nan Chen critically edited and revised the manuscript. All authors contributed to the preparation and approved the final draft of manuscript.
FUNDING INFORMATION
This study was supported by the National Key Research and Development Program of China (No. 2016YFC1305402), the National Natural Science Foundation of China (Nos. 81870492, 82070740, 81900699 and 81200526).
CONFLICT OF INTEREST STATEMENT
All the authors declared no competing interests.
ETHICS STATEMENT
All procedures used in animal experiments were conducted following the ARRIVE guidelines. This study was approved by the Animal Ethics Committee of Ruijin Hospital according to the provisions in the 1975 Declaration of Helsinki and its later amendments.
Supporting information
Figure S1. Supporting Information.
Huang S, Jin Y, Zhang L, Zhou Y, Chen N, Wang W. PPAR gamma and PGC‐1alpha activators protect against diabetic nephropathy by suppressing the inflammation and NF‐kappaB activation. Nephrology. 2024;29(12):858‐872. doi: 10.1111/nep.14381
Siyi Huang and Yuanmeng Jin contribute equally to this work.
DATA AVAILABILITY STATEMENT
The data sets used for this work can be requested from the corresponding author on reasonable request.
REFERENCES
- 1. Araújo LS, Torquato BGS, da Silva CA, et al. Renal expression of cytokines and chemokines in diabetic nephropathy. BMC Nephrol. 2020;21:308. [DOI] [PMC free article] [PubMed] [Google Scholar]
- 2. Sun X, Liu Y, Li C, et al. Recent advances of curcumin in the prevention and treatment of renal fibrosis. Biomed Res Int. 2017;2017:2418671. [DOI] [PMC free article] [PubMed] [Google Scholar]
- 3. Zhang L, Zhou Y, Zhou F, et al. Altered expression of long noncoding and messenger RNAs in diabetic nephropathy following treatment with rosiglitazone. Biomed Res Int. 2020;2020:1360843. [DOI] [PMC free article] [PubMed] [Google Scholar]
- 4. Wu H, Malone AF, Donnelly EL, et al. Single‐cell transcriptomics of a human kidney allograft biopsy specimen defines a diverse inflammatory response. J Am Soc Nephrol. 2018;29:2069‐2080. [DOI] [PMC free article] [PubMed] [Google Scholar]
- 5. Borsting E, Cheng VP, Glass CK, Vallon V, Cunard R. Peroxisome proliferator‐activated receptor‐γ agonists repress epithelial sodium channel expression in the kidney. Am J Physiol Renal Physiol. 2012;302:F540‐F551. [DOI] [PMC free article] [PubMed] [Google Scholar]
- 6. Henique C, Bollee G, Lenoir O, et al. Nuclear factor erythroid 2‐related factor 2 drives podocyte‐specific expression of peroxisome proliferator‐activated receptor γ essential for resistance to crescentic GN. J Am Soc Nephrol. 2016;27:172‐188. [DOI] [PMC free article] [PubMed] [Google Scholar]
- 7. Koppen A, Kalkhoven E. Brown vs white adipocytes: the PPARgamma coregulator story. FEBS Lett. 2010;584:3250‐3259. [DOI] [PubMed] [Google Scholar]
- 8. Annese V, Rogai F, Settesoldi A, Bagnoli S. PPARγ in inflammatory bowel disease. PPAR Res. 2012;2012:620839. [DOI] [PMC free article] [PubMed] [Google Scholar]
- 9. Nierenberg AA, Ghaznavi SA, Sande Mathias I, Ellard KK, Janos JA, Sylvia LG. Peroxisome proliferator‐activated receptor gamma coactivator‐1 alpha as a novel target for bipolar disorder and other neuropsychiatric disorders. Biol Psychiatry. 2018;83:761‐769. [DOI] [PubMed] [Google Scholar]
- 10. Zhang L, Liu J, Zhou F, Wang W, Chen N. PGC‐1α ameliorates kidney fibrosis in mice with diabetic kidney disease through an antioxidative mechanism. Mol Med Rep. 2018;17:4490‐4498. [DOI] [PMC free article] [PubMed] [Google Scholar]
- 11. de Vera IMS, Zheng J, Novick S, et al. Synergistic regulation of coregulator/nuclear receptor interaction by ligand and DNA. Structure. 2017;25:1506‐1518. [DOI] [PMC free article] [PubMed] [Google Scholar]
- 12. Zhang XK, Su Y, Chen L, Chen F, Liu J, Zhou H. Regulation of the nongenomic actions of retinoid X receptor‐α by targeting the coregulator‐binding sites. Acta Pharmacol Sin. 2015;36:102‐112. [DOI] [PMC free article] [PubMed] [Google Scholar]
- 13. Jehle K, Cato L, Neeb A, et al. Coregulator control of androgen receptor action by a novel nuclear receptor‐binding motif. J Biol Chem. 2014;289:8839‐8851. [DOI] [PMC free article] [PubMed] [Google Scholar]
- 14. Shavva VS, Mogilenko DA, Nekrasova EV, et al. Tumor necrosis factor α stimulates endogenous apolipoprotein A‐I expression and secretion by human monocytes and macrophages: role of MAP‐kinases, NF‐κB, and nuclear receptors PPARα and LXRs. Mol Cell Biochem. 2018;448:211‐223. [DOI] [PubMed] [Google Scholar]
- 15. He K, Dai ZY, Li PZ, Zhu XW, Gong JP. Association between liver X receptor‐α and neuron‐derived orphan nuclear receptor‐1 in kupffer cells of C57BL/6 mice during inflammation. Mol Med Rep. 2015;12:6098‐6104. [DOI] [PubMed] [Google Scholar]
- 16. Donizetti‐Oliveira C, Semedo P, Burgos‐Silva M, et al. Adipose tissue‐derived stem cell treatment prevents renal disease progression. Cell Transplant. 2012;21:1727‐1741. [DOI] [PubMed] [Google Scholar]
- 17. Zhang L, Zhou F, Yu X, et al. C/EBPα deficiency in podocytes aggravates podocyte senescence and kidney injury in aging mice. Cell Death Dis. 2019;10(10):684. [DOI] [PMC free article] [PubMed] [Google Scholar]
- 18. Luo C, Widlund HR, Puigserver P. PGC‐1 coactivators: shepherding the mitochondrial biogenesis of tumors. Trends Cancer. 2016;2:619‐631. [DOI] [PMC free article] [PubMed] [Google Scholar]
- 19. Goyal G, Wong K, Nirschl CJ, et al. PPARγ contributes to immunity induced by cancer cell vaccines that secrete GM‐CSF. Cancer Immunol Res. 2018;6:723‐732. [DOI] [PMC free article] [PubMed] [Google Scholar]
- 20. Mastropasqua F, Girolimetti G, Shoshan M. PGC1α: friend or foe in cancer? Genes. 2018;9:48. [DOI] [PMC free article] [PubMed] [Google Scholar]
- 21. Scharping NE S, Menk AV, Moreci RS, et al. The tumor microenvironment represses T cell mitochondrial biogenesis to drive intratumoral T cell metabolic insufficiency and dysfunction. Immunity. 2016;45:701‐703. [DOI] [PubMed] [Google Scholar]
- 22. Liu T, Zhang L, Joo D, Sun SC. NF‐κB signaling in inflammation. Signal Transduct Target Ther. 2017;2:17023. [DOI] [PMC free article] [PubMed] [Google Scholar]
- 23. Su M, Cao J, Huang J, et al. The in vitro and in vivo anti‐inflammatory effects of a phthalimide PPAR‐γ agonist. Mar Drugs. 2017;15:7. [DOI] [PMC free article] [PubMed] [Google Scholar]
- 24. Wright MB, Bortolini M, Tadayyon M, Bopst M. Minireview: challenges and opportunities in development of PPAR agonists. Mol Endocrinol. 2014;28:1756‐1768. [DOI] [PMC free article] [PubMed] [Google Scholar]
- 25. Michael LF, Wu Z, Cheatham RB, et al. Restoration of insulin‐sensitive glucose transporter (GLUT4) gene expression in muscle cells by the transcriptional coactivator PGC‐1. Proc Natl Acad Sci U S A. 2001;98:3820‐3825. [DOI] [PMC free article] [PubMed] [Google Scholar]
- 26. Garg M, Thamotharan M, Becker DJ, Devaskar SU. Adolescents with clinical type 1 diabetes display reduced red blood cell glucose transporter isoform 1 (GLUT1). Pediatr Diabetes. 2014;15:511‐518. [DOI] [PMC free article] [PubMed] [Google Scholar]
- 27. Zhang LN, Zhou HY, Fu YY, et al. Novel small‐molecule PGC‐1α transcriptional regulator with beneficial effects on diabetic db/db mice. Diabetes. 2013;62:1297‐1307. [DOI] [PMC free article] [PubMed] [Google Scholar]
- 28. Xu Y, Kabba JA, Ruan W, et al. The PGC‐1α activator ZLN005 ameliorates ischemia‐induced neuronal injury in vitro and in vivo. Cell Mol Neurobiol. 2018;38:929‐939. [DOI] [PMC free article] [PubMed] [Google Scholar]
- 29. Satish S, Philipose H, Rosales MAB, Saint‐Geniez M. Pharmaceutical induction of PGC‐1α promotes retinal pigment epithelial cell metabolism and protects against oxidative damage. Oxidative Med Cell Longev. 2018;2018:9248640. [DOI] [PMC free article] [PubMed] [Google Scholar]
- 30. Zhang T, Liu CF, Zhang TN, Wen R, Song WL. Overexpression of peroxisome proliferator‐activated receptor γ coactivator 1‐α protects cardiomyocytes from lipopolysaccharide‐induced mitochondrial damage and apoptosis. Inflammation. 2020;43:1806‐1820. [DOI] [PubMed] [Google Scholar]
Associated Data
This section collects any data citations, data availability statements, or supplementary materials included in this article.
Supplementary Materials
Figure S1. Supporting Information.
Data Availability Statement
The data sets used for this work can be requested from the corresponding author on reasonable request.


