Abstract
The analysis of data-independent acquisition (DIA) mass spectrometry data is crucial for comprehensive proteomics studies. However, traditional single-run methods often fall short in terms of identification depth and consistency. We present HFDiscrim, a specialized multirun DIA analysis tool aimed at enhancing the depth and consistency of reliable peptide identifications of DIA analysis tools. HFDiscrim was extensively benchmarked on multiple data sets, including the MCB data set, the ccRCC data set, and a three-species benchmark mixture. Compared to PyProphet, HFDiscrim identified 22.04% more precursors, 19.1% more peptides, and 13.2% more proteins while maintaining a controllable false discovery rate. Furthermore, HFDiscrim demonstrated higher identification rates and improved reproducibility across multiple runs. HFDiscrim is publicly available at https://github.com/yachliu/HFDiscrim.
Introduction
Proteins are indispensable and versatile molecules, essential for nearly every aspect of cellular function and biological processes.1−3 Data-independent acquisition (DIA) is a widely used technique for exploring the proteome landscape of biological samples through liquid chromatography coupled with tandem mass spectrometry (LC-MS/MS).4,5 Unlike data-dependent acquisition (DDA), which selects specific precursors based on their higher intensities for fragmentation, DIA captures all precursors within a predefined isolation range for MS2 acquisition in an unbiased manner. However, the computational processing of DIA data sets remains challenging owing to their inherent complexity. One major difficulty arises from the fact that, in DIA, each precursor generates not just one spectrum, but a series of chromatograms corresponding to various fragment ions produced by collision-induced dissociation.6 Furthermore, these chromatograms are frequently highly multiplexed because of interferences from cofragmenting precursors.7,8
To meet those challenges in DIA studies, various tools have been developed. Existing tools like OpenSWATH,9 MaxDIA,10 DIA-NN,11 and DreamDIA12 employ various strategies to enhance the distinction of peptide signals from interference signals. OpenSWATH utilizes a peptide-centric analysis approach, comparing chromatographic peak signals against a spectral library to derive multiple subscores for signal characterization. Target peptides are then identified using the PyProphet13 algorithm, which differentiates them from decoy peptides based on the derived subscores. DIA-NN further increases the number of subscores to 73 and uses a neural network to distinguish between target and decoy peptides. MaxDIA improves the signal-to-noise ratio of chromatographic signals through iterative hyperparameter optimization. DreamDIA extracts additional features from hundreds of theoretical elution profiles of different ions for each precursor using a deep representation network. These methods significantly enhance the depth of peptide identification in single samples. However, due to sample complexity, instrument stability, and variations in experimental conditions, there remains substantial room for improving the consistency of identification across multiple runs. At the multirun level, the TRIC14 algorithm performs retention time alignment of fragment ion chromatograms using a nonlinear warping function to ensure consistency and complete identification by determining the correct chromatographic peak in each MS run. DIAlignR15,16 provides another strategy for retention time alignment of SWATH-MS data based on the direct alignment of raw MS2 chromatograms using a hybrid dynamic programming approach. Similarly, in MaxDIA,10 the MBR feature enhances identification consistency and data completeness across runs by utilizing prior knowledge to set thresholds for retention time, m/z, and ion intensity during cross-sample peptide matching. Although these three methods enhance identification consistency and completeness, they lack statistically supported quality control, which would lead to unreliable identification results. CRISP17 focuses on quantitative accuracy by utilizing the consistency of DIA runs to examine DIA data across the entire run set, filtering out interfering signals through a single-center comparison strategy. mapDIA18 enhances the accuracy of differential protein expression analysis in DIA-MS by leveraging multirun information for fragment-level normalization, filtering noisy fragments, and performing robust statistical analysis with controlled false discovery rates.
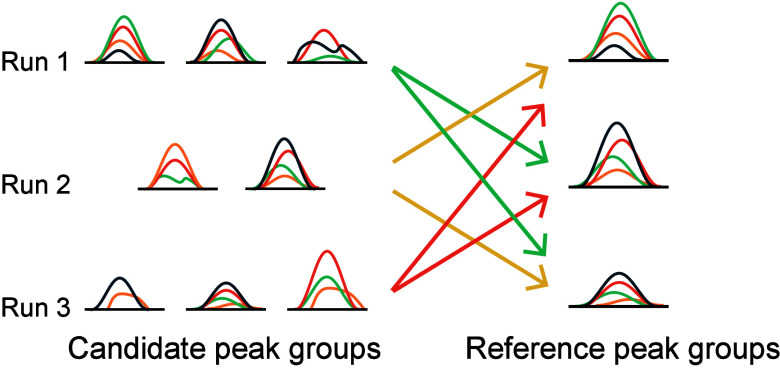
Despite the advances in these tools, the potential of multirun level information for peptide identification remains underutilized. Therefore, we present HFDiscrim, a specialized multirun DIA analysis tool aimed at enhancing the depth and consistency of reliable peptide identifications of DIA analysis tools. HFDiscrim begins by aligning the retention times of multiple runs based on single-run results obtained from OpenSWATH and PyProphet. It then compares multirun chromatographic peak signals to derive subscores representing the cross-run features of the chromatographic peaks. By comparing with multiple reference chromatographic peaks instead of a single reference chromatographic peak, HFDiscrim avoids errors arising from insufficient single-run feature characterization. Finally, it distinguishes peptide signals from interference signals using a semisupervised model based on both single-run and cross-run features. Benchmarking results on laboratory and clinical samples demonstrated that HFDiscrim outperformed PyProphet and other multirun tools in the two-species library, providing more accurate quantification in the LFQbench test.19 This highlights the advantages of incorporating hybrid features across multiple runs for reliable identification.
Methods
HFDiscrim Workflow
The HFDiscrim workflow includes four primary components (Figure 1): (1) obtaining single-run discriminant scores, (2) aligning retention times across multiple runs, (3) extracting cross-run features based on reference peak group, and (4) discriminating results based on hybrid subscores. Briefly, in HFDiscrim, we first utilize the chromatographic signal extraction, peak detection, and single-run scoring modules from OpenSWATH for single-run feature extraction. Additionally, we use PyProphet to obtain discriminant scores on single runs. Afterward, HFDiscrim incorporates cross-run features into the single-run features to form an expanded set of hybrid subscores, leading to peptide identification and quantification results.
Figure 1.
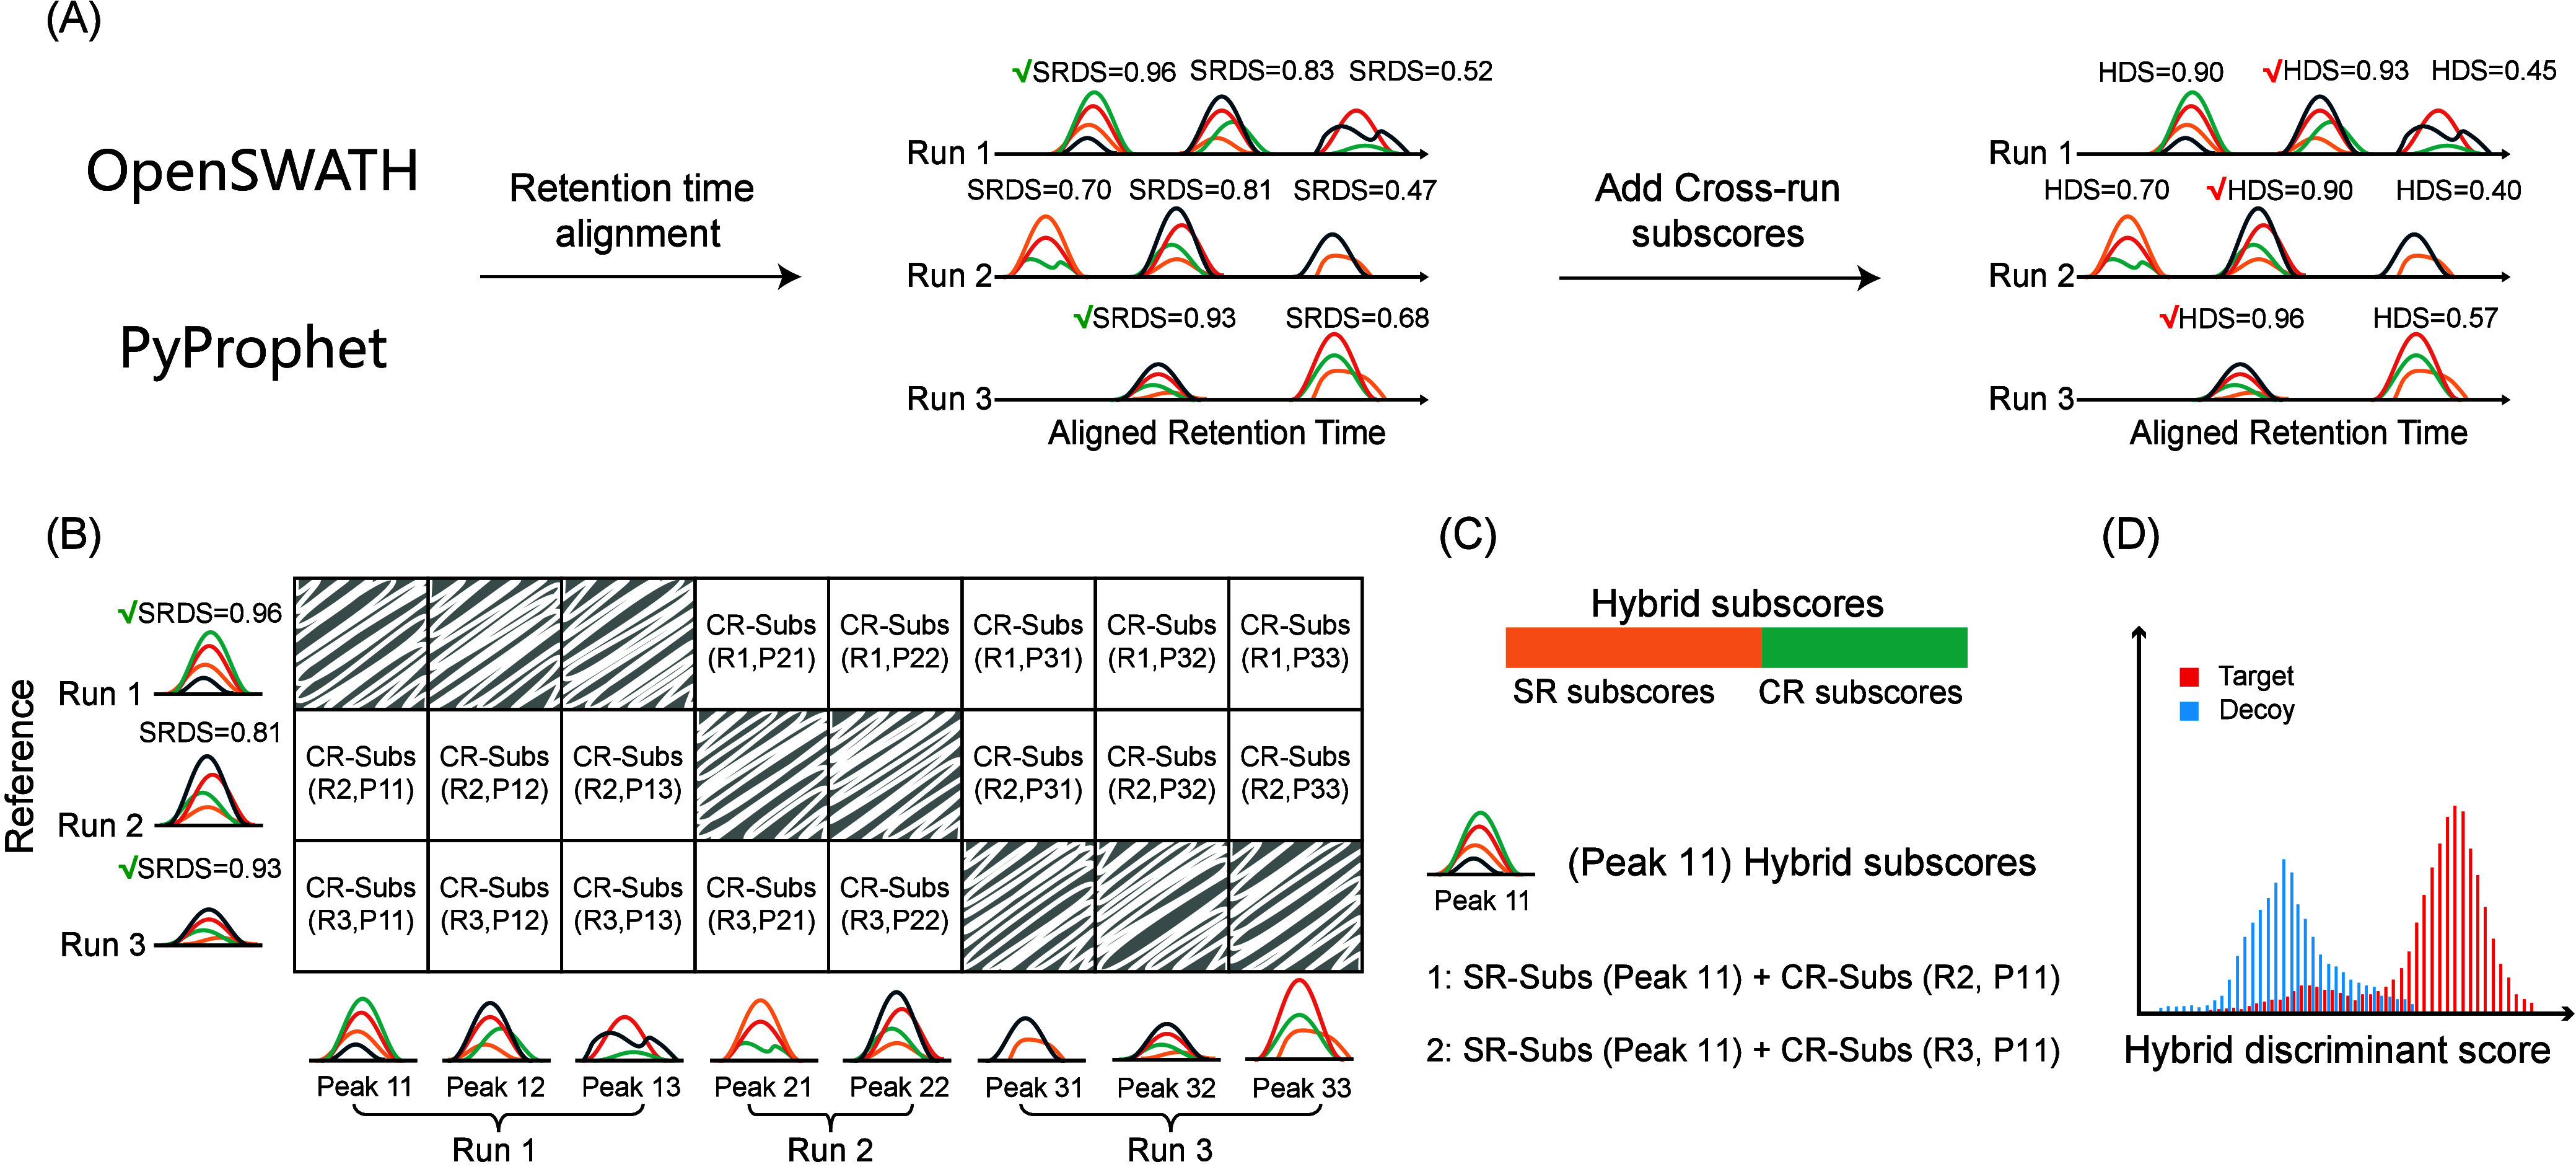
HFDiscrim: identification of candidate peak group using hybrid features. (A) Following the analysis of DIA mass spectrometry data by OpenSWATH and PyProphet, candidate peak group and their single-run subscores (SR subscores, SR-Subs) and single-run discriminant score (SRDS) are obtained. To mitigate intersample variability, the retention times across different runs are aligned. Subsequently, cross-run subscores are calculated based on the chromatographic peak signals from multiple samples. Finally, the identification results are discriminated based on the hybrid features. (B) The chromatographic peak with the highest SRDS in each sample is selected as the reference peak group. All candidate peak groups are then compared to the reference peak group to derive cross-run subscores (CR-Subs). (C) Hybrid features are composed of single-run features and cross-run features. For instance, two types of hybrid subscores were created for peak 11. (D) These hybrid subscores are then processed through a semisupervised model to yield a hybrid discriminant score (HDS). For peak 11, only the hybrid features corresponding to the highest HDS were retained.
Obtained Single-Run Discriminant Score
The raw data were initially converted to the mzML format20 using MSConvert (Version: 3.0.23143-e597efd) with default parameters. DDA mass spectrometry data were processed using MSFragger21 to generate a DDA-based spectral library, while DIA mass spectrometry data were processed using MSFragger-DIA22 to create a DIA-based spectral library. Furthermore, an endogenous peptide list was randomly generated for retention time calibration. OpenSWATH (version: 3.1.0-prenightly-2024–02–03) was utilized with default parameters. In PyProphet (version: 2.2.5), the context parameter was set to ’global’ for both the Peptide and Protein functions, with all other settings maintained as default. The results output by PyProphet included candidate peak groups and the corresponding single-run discriminant scores (SRDSs).
Retention Time Alignment
Single-run identification results from all samples were filtered with a false discovery rate (FDR) of less than 1% to retain high-confidence peptides for multirun retention time alignment. A peptide set comprising peptides identified in all individual runs was selected to align the retention times across multiple runs to a normalized retention time. Previous studies have demonstrated that retention times across different samples are not merely linear transformations.23 Consequently, a nonlinear mapping was applied between the sample retention times and the normalized retention time to accurately align the data.
Cross-Run Subscores Extraction
The single-center comparison strategy, frequently employed in multirun analyses, compares chromatographic peak signals by selecting the chromatographic peak signal with the highest single-run discriminant score across all runs as the sole reference chromatographic signal.14,15 It assumes that the single-run discriminant score can adequately characterize the chromatographic peak signal. However, this assumption may not hold in complex samples, which often contain high variability and multiple interfering substances.24 To address this, we extended the single-center comparison strategy to consider peak signals from multiple runs. This approach, which we referred to as multiple-center strategy, assumes that the chromatographic peak signal corresponding to the peptide is most prominent in at least one run, corresponding to the highest single-run discriminant score. Consequently, the chromatographic peak with the highest single-run discriminant score in each run was selected to form a reference peak group. All candidate chromatographic peaks are then compared with those in other runs within the reference peak group to obtain the corresponding cross-run subscores (Figure 1B). For the comparison of chromatographic peaks, only the peptide precursor ion and the first six fragment ions are considered. In total, 17 cross-run subscores are generated for subsequent analysis, which are further categorized into five types as follows:
-
1.
The maximum Pearson correlation coefficient between each chromatographic signal of the candidate chromatographic peak and all chromatographic signals in the reference chromatographic peak. Specifically, for each of the 7 chromatographic signals in the candidate chromatographic peak, we calculate the Pearson correlation coefficients with the 7 chromatographic signals in the reference chromatographic peak and select the highest correlation coefficient as one subscore, resulting in 7 subscores;
-
2.
The average Pearson correlation coefficient between each chromatographic signal of the candidate chromatographic peak and all chromatographic signals in the reference chromatographic peak. For each of the 7 chromatographic signals in the candidate chromatographic peak, we calculate the Pearson correlation coefficients with the 7 chromatographic signals in the reference chromatographic peak and take the average of these coefficients as one subscore, resulting in 7 subscores;
-
3.
The cosine similarity between the vectors composed of signal intensities of all chromatographic signals in the candidate chromatographic peak and those in the reference chromatographic peak (1 subscore);
-
4.
The absolute value of the difference in normalized retention times between the candidate chromatographic peak and the reference chromatographic peak (1 subscore);
-
5.
The single-run discriminant score of the reference chromatographic peak (1 subscore).
Nonlinear Discriminative Based on Hybrid Subscores
In HFDiscrim, a single chromatographic peak signal’s single-run subscore and cross-run subscore would combine to form multiple different hybrid subscores (Figure 1C). The initial hybrid discriminant score (HS) for each precursor, computed using a binary classifier that integrates a random hybrid subscore, is then used to refine the selection of the best peaks and the best hybrid features, with the procedure repeated iteratively several times. The final discriminative model was trained using a positive-unlabeled learning framework based on labels provided by the spectral library to enhance identification accuracy (Figure 1D). In this framework, decoy precursors generated in silico were used as confirmed negative controls, while target precursors were treated as the unlabeled class, as they may also include negative precursors.
Publicly Available Data Sets
Six publicly available data sets were used in this study to evaluate and compare identification performance. The MCB data set,25 Prostate data set26 and ccRCC data set27 were utilized to compare identification depth and consistency. To obtain more accurate and comprehensive experimental results, the spectral library was regenerated using the FragPipe platform. The Arabidopsis-DDA data set28 was used to generate an Arabidopsis spectral library, which was then merged into a two-species library. The HYE124 and HYE110 data sets,19 employed to evaluate quantitative results, contain hybrid proteome samples with tryptic peptides combined in specific ratios. In HYE124 data set, sample A comprises 65% w/w human, 30% w/w yeast, and 5% w/w E. coli proteins, whereas sample B comprises 65% w/w human, 15% w/w yeast, and 20% w/w E. coli proteins. In HYE110 data set, sample A comprises 67% w/w human, 30% w/w yeast, and 3% w/w E. coli proteins, whereas sample B comprises 67% w/w human, 3% w/w yeast, and 30% w/w E. coli proteins.
Results of Other DIA Tools for Comparison
HFDiscrim was benchmarked against other tools based on OpenSWATH outputs, including PyProphet,13 TRIC,14 DIAlignR,15,16 DIA-NN11 and HFDiscrim with a single-center comparison strategy (HFDiscrim-SC). In TRIC (version: 0.11.0), the feature_alignment.py function was used with method = LocalMST, realign_method = lowess_cython, max_fdr_quality = −1 and mst:useRTCorrection set to True. In DIAlignR (version: 2.12.0), consistent with PyProphet, the context parameter was set to “global”, with all other settings maintained as default. In DIA-NN (version: 1.8.1), the Mass accuracy was set “0.0”, with all other settings maintained as default. Notably, PyProphet, TRIC, HFDiscrim-SC, and HFDiscrim were all based on single-run features within the OpenSWATH framework, whereas DIA-NN, an independent pipeline for processing DIA mass spectrometry data, was the most widely adopted tool for DIA data analysis. The FDR was estimated with the “internal” target-decoy method and with the “external” method using mixing Arabidopsis and target (human or mouse) samples for generating the library and using only target sample in the DIA runs.
Results and Discussion
FDR Comparison for Tool Selection
DIA mass spectrometry data analysis tools commonly use self-generated “internal” decoy to estimate the false discovery rate (FDR) of analysis results. However, this estimated FDR may be bias as the discriminant models are also trained based same set of decoys, which can lead to overfitting and underestimate the FDR. Therefore, we follow MaxDIA10 to report the FDR of different tools based on “external” method using Arabidopsis and human/mouse samples for generating the library and using only human/mouse sample in the DIA runs.
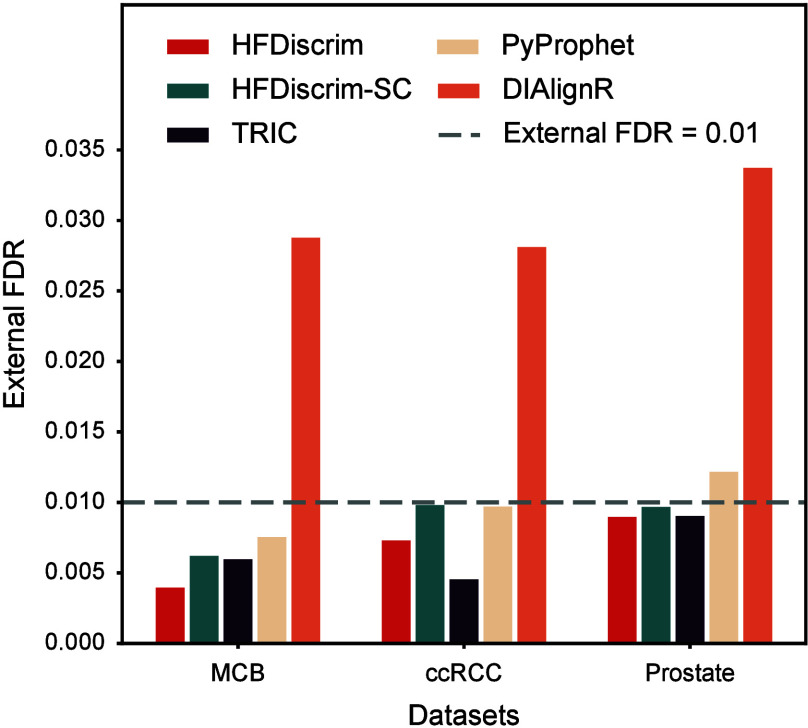
We obtained output results from different tools on the MCB, ccRCC, and Prostate data sets with an internal FDR of less than 0.01 estimated by the target-decoy method. We then compared the external FDR among these results (Figure 2). HFDiscrim, HFDiscrim-SC, and TRIC consistently exhibit external FDRs that are lower than or close to their internal FDRs, indicating robust and reliable performance. Although PyProphet’s external FDR (0.0122) for the Prostate data set is slightly higher than the internal FDR (0.01), the average external FDR across the three data sets is lower than the corresponding average internal FDR. This indicates that while PyProphet’s internal FDR estimates are sensitive to the data set, they still approximate the true FDR level. In contrast, DIAlignR demonstrates significantly higher external FDRs compared to internal FDRs across all three data sets. This substantial discrepancy highlights a critical issue in its performance, suggesting that DIAlignR greatly underestimates the proportion of false positives. As a result, DIAlignR’s results are unreliable and hence are not included in the subsequent analyses.
Figure 2.
Comparison of external and internal false discovery rates (FDR) across tools and data sets. External false discovery rates (FDR) corresponding to an internal FDR of 0.01 for different data sets (MCB, ccRCC, and Prostate) using various tools (HFDiscrim, HFDiscrim-SC, TRIC, PyProphet, and DIAlignR). The dashed line indicates an external FDR threshold of 0.01.
Improvement in Identification Coverage with HFDiscrim
We utilized the MCB data set to evaluate the identification performance of HFDiscrim, which incorporates hybrid subscores based on both single-run and cross-run features, with PyProphet, TRIC, DIA-NN, and HFDiscrim-SC. The spectral library was created using results from analyzing DDA data with MSFragger. Peptide precursors from Arabidopsis thaliana proteins, not present in the MCB data set, were included to generate a two-species spectral library for comparison. The ratio of peptide precursors from mouse to Arabidopsis thaliana in the library was 10:1.
Figure 3A shows that among all tools, PyProphet, which relies solely on single-run features, identified the fewest mouse precursors across various external FDR thresholds. Specifically, at an external FDR of 0.01, PyProphet identified a total of 645,791 mouse precursors across 10 mouse samples. TRIC, utilizing fragment-ion data for cross-run alignment, identified 5.5% more precursors than PyProphet. HFDiscrim and HFDiscrim-SC, which align chromatographic peak signals using single-sample discriminant scores to derive hybrid features, identified 788,154 and 750,321 mouse precursors, respectively, at an external FDR of 0.01. Compared to HFDiscrim-SC, HFDiscrim exhibits a stronger capacity to differentiate between true peptide chromatographic signals and interference signals, approaching the performance of DIA-NN.
Figure 3.
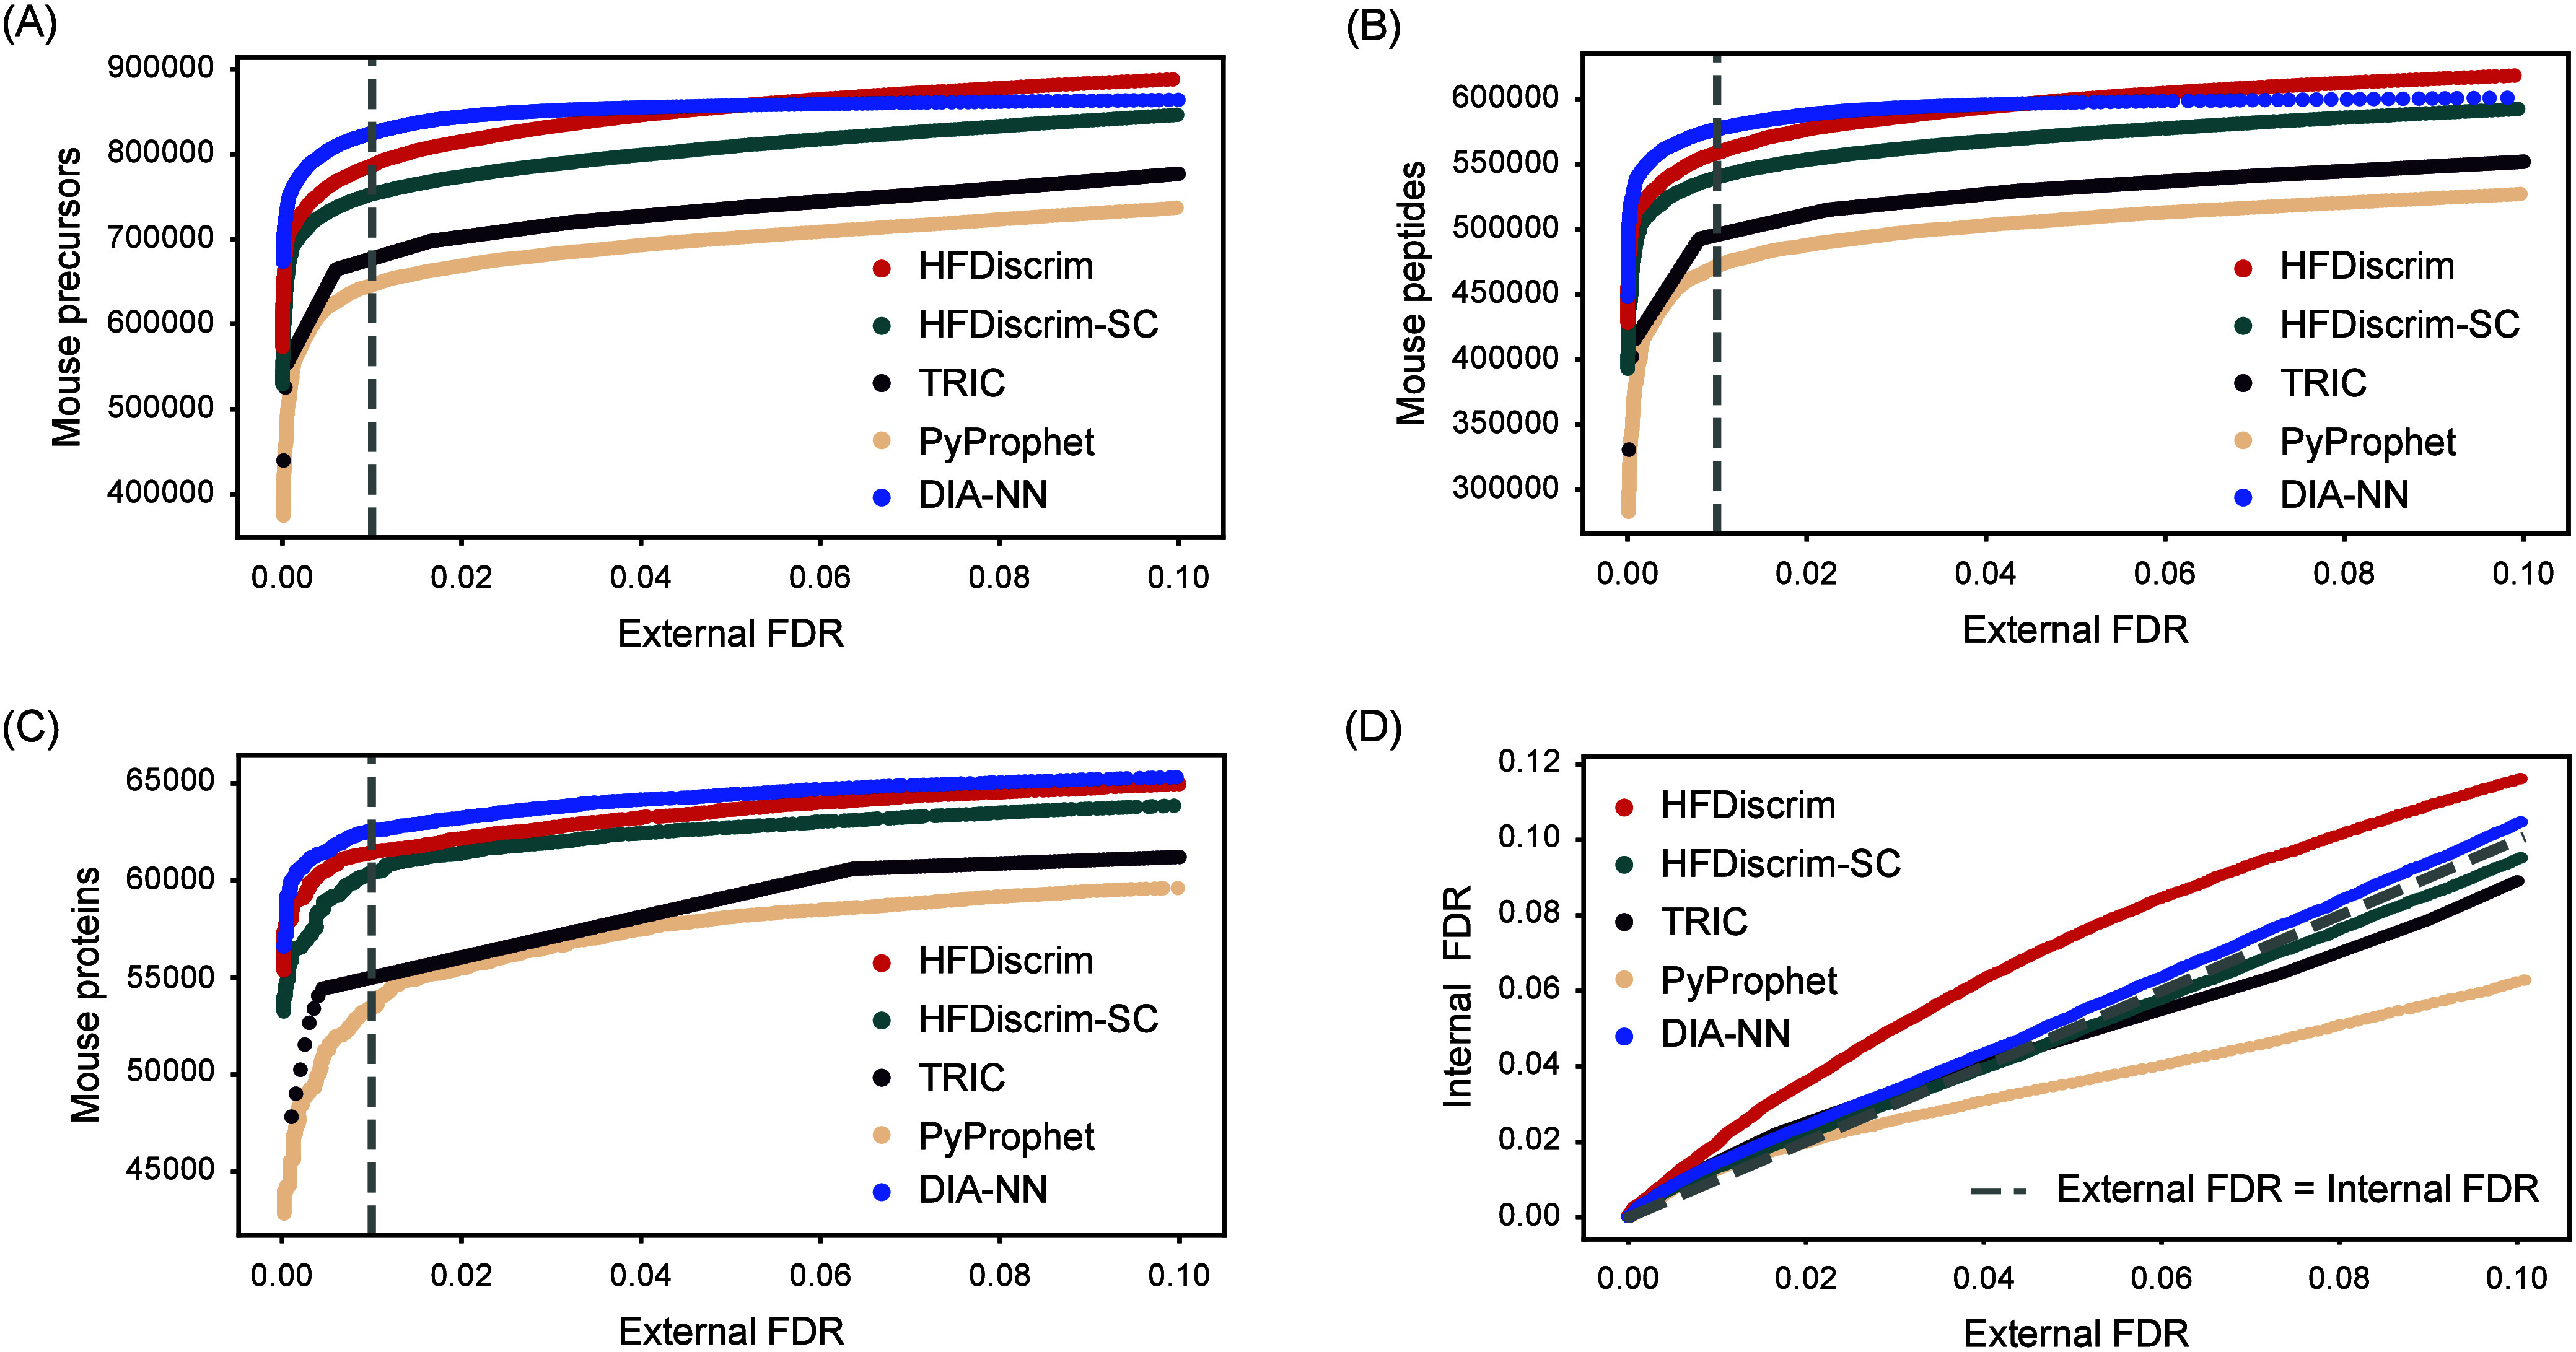
Identification performance on all 10 samples of the MCB data set (DDA-based spectral library). (A) The number of mouse precursors identified across all 10 samples of the MCB data set at different external FDRs was plotted. (B) Same as in (A) but reports the number of mouse peptides. (C) Same as in (A) but reports the number of mouse proteins. (D) False-discovery rate validation: Internal FDR values were plotted against external FDR values.
Additionally, HFDiscrim identified the highest number of peptides and proteins from 10 mouse samples, with 559,137 peptides and 61,078 proteins at an external FDR of 0.01, representing increases of 19.1% and 13.2%, respectively, compared to the 469,932 peptides and 53,971 proteins identified by PyProphet (Figure 3B and 3C). The multicenter cross-run chromatographic peak comparison strategy employed by HFDiscrim can identify a greater number of analytes compared to the single-center strategy. The single-center strategy may erroneously use background signals as the reference chromatographic peak, leading to the propagation of incorrect peaks. In contrast, the multicenter comparison strategy includes multiple reference spectrum peaks, increasing the likelihood of capturing the true peptide signal and significantly reducing the occurrence of error propagation.
Based on these results, we further investigated whether this reliable identification boost remains consistent when the spectral library is generated from DIA samples. A DIA-based spectral library was generated by processing DIA samples using the MSFragger-DIA and FragPipe analysis platforms. Using this library with the same DIA data set as shown in Figure S1, we observed the same improvement in identification across external FDRs as before (Figure 3A–C). This demonstrates that HFDiscrim does not require spectral libraries to be generated in a specific manner to maintain identification improvement. The observed improvement with HFDiscrim can be attributed to its ability to integrate both single-run and cross-run features, providing a more robust identification framework.
To further validate the reliability of FDR estimation by these tools on the MCB data set, we compared the relationship between external FDR and internal FDR across a broad range of external FDR values (Figure 3D). Within the external FDR range of 0 to 0.1, the internal FDR of HFDiscrim and DIA-NN consistently remained lower than the external FDR, indicating a conservative discriminant model. HFDiscrim-SC and TRIC exhibited slightly lower internal FDRs than external FDRs when the external FDR exceeded 0.05, with overall external FDR closely matching internal FDR. As the FDR increased, the PyProphet discriminant model demonstrated a higher risk of overfitting. This demonstrates that utilizing multisample features not only enhances the depth of peptide identification but also reduces the false positive rate.
To understand the effect of sample size on the performance of HFDiscrim, we analyzed the number of precursors, peptides, and proteins identified across different sample sizes. We used one of the samples from the MCB data sets, BGS_D_D180420_S416-newPrep-DIA-D-S1–1_MHRM_R01_T0, and evaluated the results at an external FDR of 0.01. Figure S2 illustrates the relationship between sample size and the number of identified mouse precursors, peptides, and proteins. As the sample size increases, so does the number of identified precursors, peptides, and proteins. This trend indicates that larger sample sizes enhance the detection capabilities of HFDiscrim, leading to more comprehensive identification. These findings highlight the importance of considering sample size in proteomic analyses using HFDiscrim. Larger sample sizes improve the overall performance of the analysis by enabling more thorough detection of precursors, peptides, and proteins. This underscores the need to account for sample size in experimental design to achieve more robust and reliable proteomic data. The ability of HFDiscrim to scale with sample size and effectively leverage additional data to enhance identification rates makes it a powerful tool for large-scale proteomics studies.
HFDiscrim Produces Reliable Identification Improvements
To evaluate the reliability of the identification improvements provided by HFDiscrim, we compared its identification consistency with that of other tools. We considered precursors, peptides, and proteins identified at a 1% precursor FDR using the external method across all 10 runs on the MCB data set. The results indicate that compared to TRIC, HFDiscrim-SC, and HFDiscrim, which use hybrid features, PyProphet, which relies solely on single-run features, identified the fewest precursors, peptides, and proteins across the ten mouse samples.
Notably, the number of precursors, peptides, and proteins identified by HFDiscrim across all 10 runs is significantly higher than those identified by PyProphet, with increases of 52.0%, 44.1%, and 24.8%, respectively (Figure 4A–C). This observation is consistent with the results from the previous section (Figure 3A–C). Additionally, the number of precursors, peptides, and proteins identified by PyProphet but not by HFDiscrim is negligible. This can be attributed to HFDiscrim and PyProphet sharing the same chromatographic peaks and single-run features, with HFDiscrim incorporating additional cross-run features. This demonstrates that the cross-run features in HFDiscrim substantially enhance identification capability without losing any target analytes already identified by the single-run method.
Figure 4.
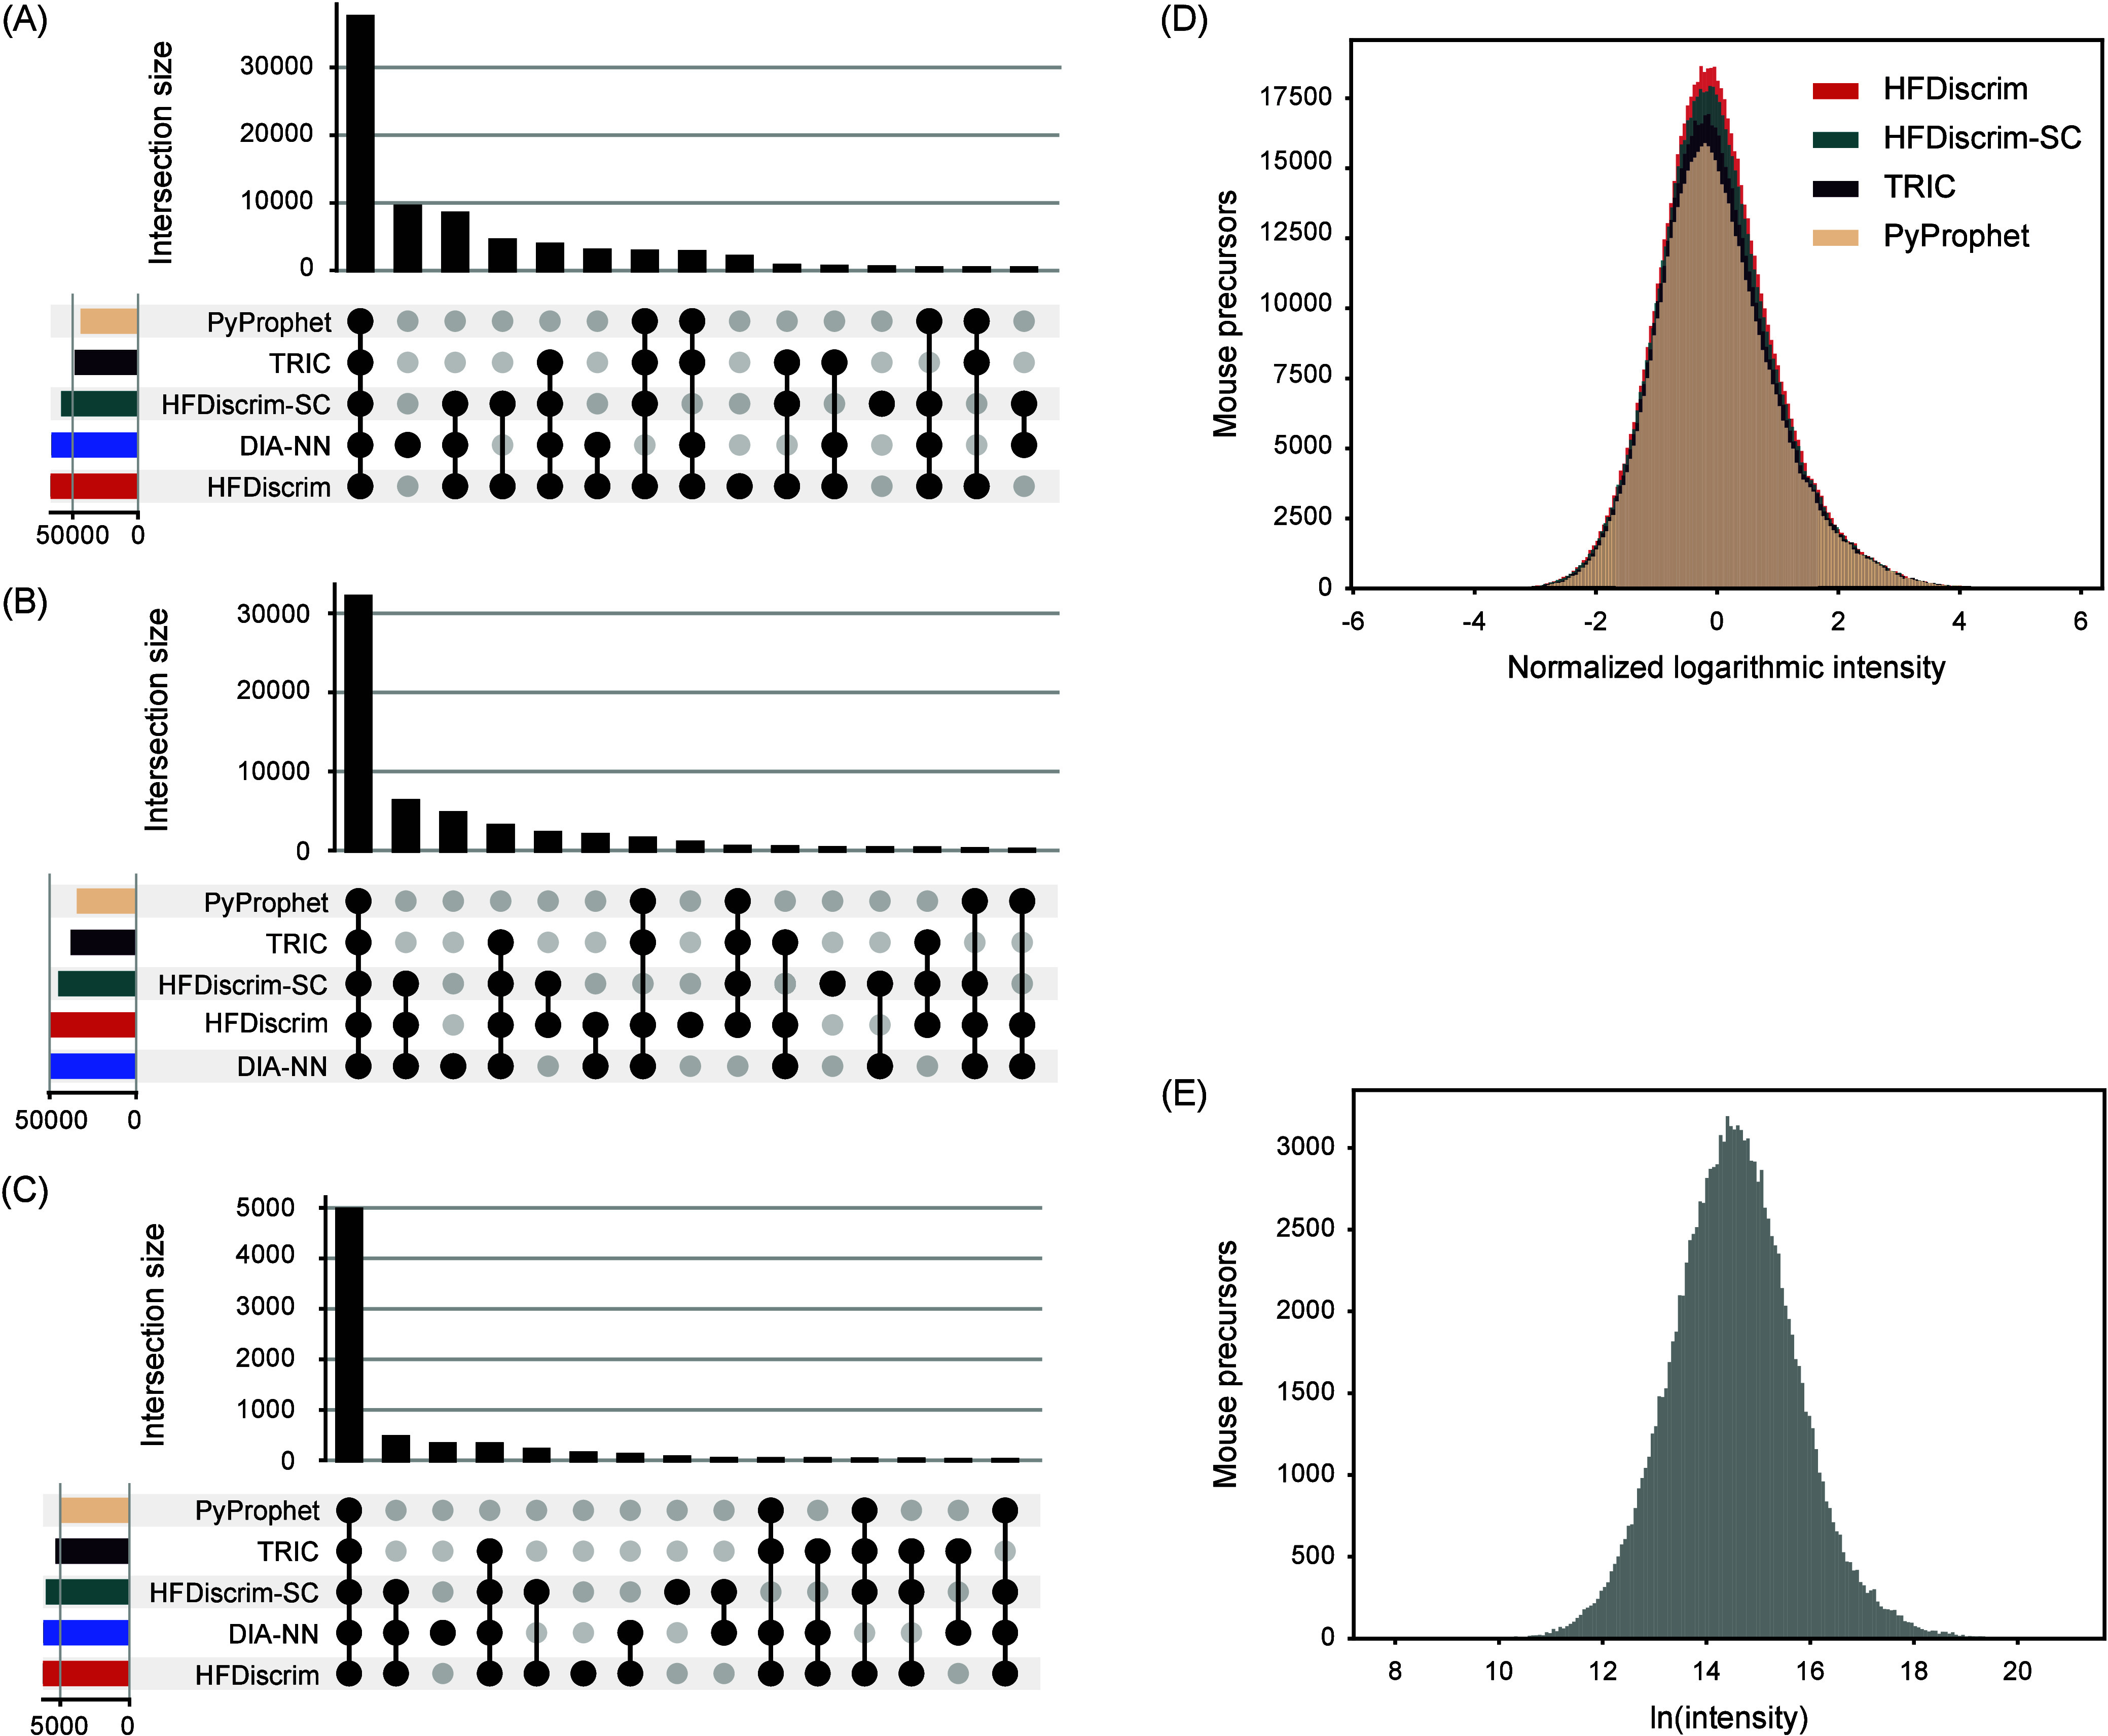
Evaluation of reliable identification results of HFDiscrim on the MCB data set. (A–C) Identification consistency of mouse precursors, peptides, and proteins at 1% precursor FDR using the external method. Only precursors identified in all 10 runs on the MCB data set were considered. (D) Logarithmic intensity distributions of the mouse precursors identified at 1% precursor FDR using the external method. All precursor identification records in all 10 runs were considered. Logarithmic intensities were z-normalized by subtracting the mean intensity and then dividing by the standard deviation to make the distributions comparable. (E) Natural logarithm (ln) intensities of the precursors uniquely identified by HFDiscrim but not by PyProphet, in all 10 biologically independent runs on the MCB data sets.
Furthermore, we evaluated the intensity distributions of the identified precursors to further validate the reliability of HFDiscrim’s identifications. Figure 4D shows the logarithmic intensity distributions of the mouse precursors identified at 1% precursor FDR using the external method. The distributions were z-normalized by subtracting the mean intensity and then dividing by the standard deviation to make them comparable. The similar distributions between HFDiscrim and PyProphet indicate that HFDiscrim’s peptide identification is unbiased with respect to signal intensity.
In addition, we examined the natural logarithm (ln) intensities of the precursors uniquely identified by HFDiscrim compared with PyProphet across all 10 biologically independent runs on the MCB data set. The Gaussian-like logarithmic intensity distribution (Figure 4E) of the identified precursors indicates that HFDiscrim has no abundance bias for peptide identification. This further underscores the advantage of incorporating cross-run features in HFDiscrim, enhancing its identification performance and reliability.
Benchmarking HFDiscrim on Clinical Samples
Clinical samples were collected from patients with diverse genetic backgrounds, disease conditions, and lifestyle habits, resulting in significant heterogeneity among the samples. To evaluate the reproducibility of HFDiscrim results, 20 samples from clear cell renal cell carcinoma (ccRCC) patients aged 30 to 90 years were selected for analysis. FragPipe software and eight Data-Dependent Acquisition (DDA) files, derived from fractionated peptide samples (eight fractions from a pooled confirmatory ccRCC sample), were used to construct a spectral library. This spectral library comprised 7,380 proteins and 66,265 peptides, retaining only the six most intense fragment ions for each precursor ion. Additionally, Arabidopsis thaliana-specific precursor ions were included to ensure equitable comparison across different workflows, maintaining a 10:1 ratio of human precursor ions to Arabidopsis thaliana precursor ions.
Our results indicate that although PyProphet identifies more precursors, the precursors identified by HFDiscrim are highly consistent across samples. Using the external method with a 1% precursor FDR, HFDiscrim identified 60,709 unique peptide precursors from 20 samples, whereas PyProphet identified 78,550. HFDiscrim consistently identified more peptide precursors across varying numbers of samples. Specifically, HFDiscrim identified 55,983 peptide precursors in at least half of the samples, compared to 41,921 identified by PyProphet, representing a 25.2% reduction. At the extreme, HFDiscrim identified 33,851 peptide precursors in all 20 samples, whereas PyProphet identified only 11,266 (Figure 5A). Relative quantities were also compared under different conditions. HFDiscrim identified 92.2% of its total peptide precursors in at least half of the samples and 55.8% in all samples. In contrast, PyProphet identified significantly lower proportions under the same conditions, at 65.0% and 17.5%, respectively (Figure 5B). Regardless of the sample count, TRIC, which uses fragment ion-based multirun alignment, identified fewer human precursors than PyProphet. Additionally, HFDiscrim-SC identified fewer human precursors than PyProphet when the sample count exceeded 15. This suggests that improper use of multirun features would hinder the separation of peptide chromatographic signals from interference signals, underscoring the advantage of HFDiscrim’s multicenter comparison strategy in analyzing multiple runs.
Figure 5.
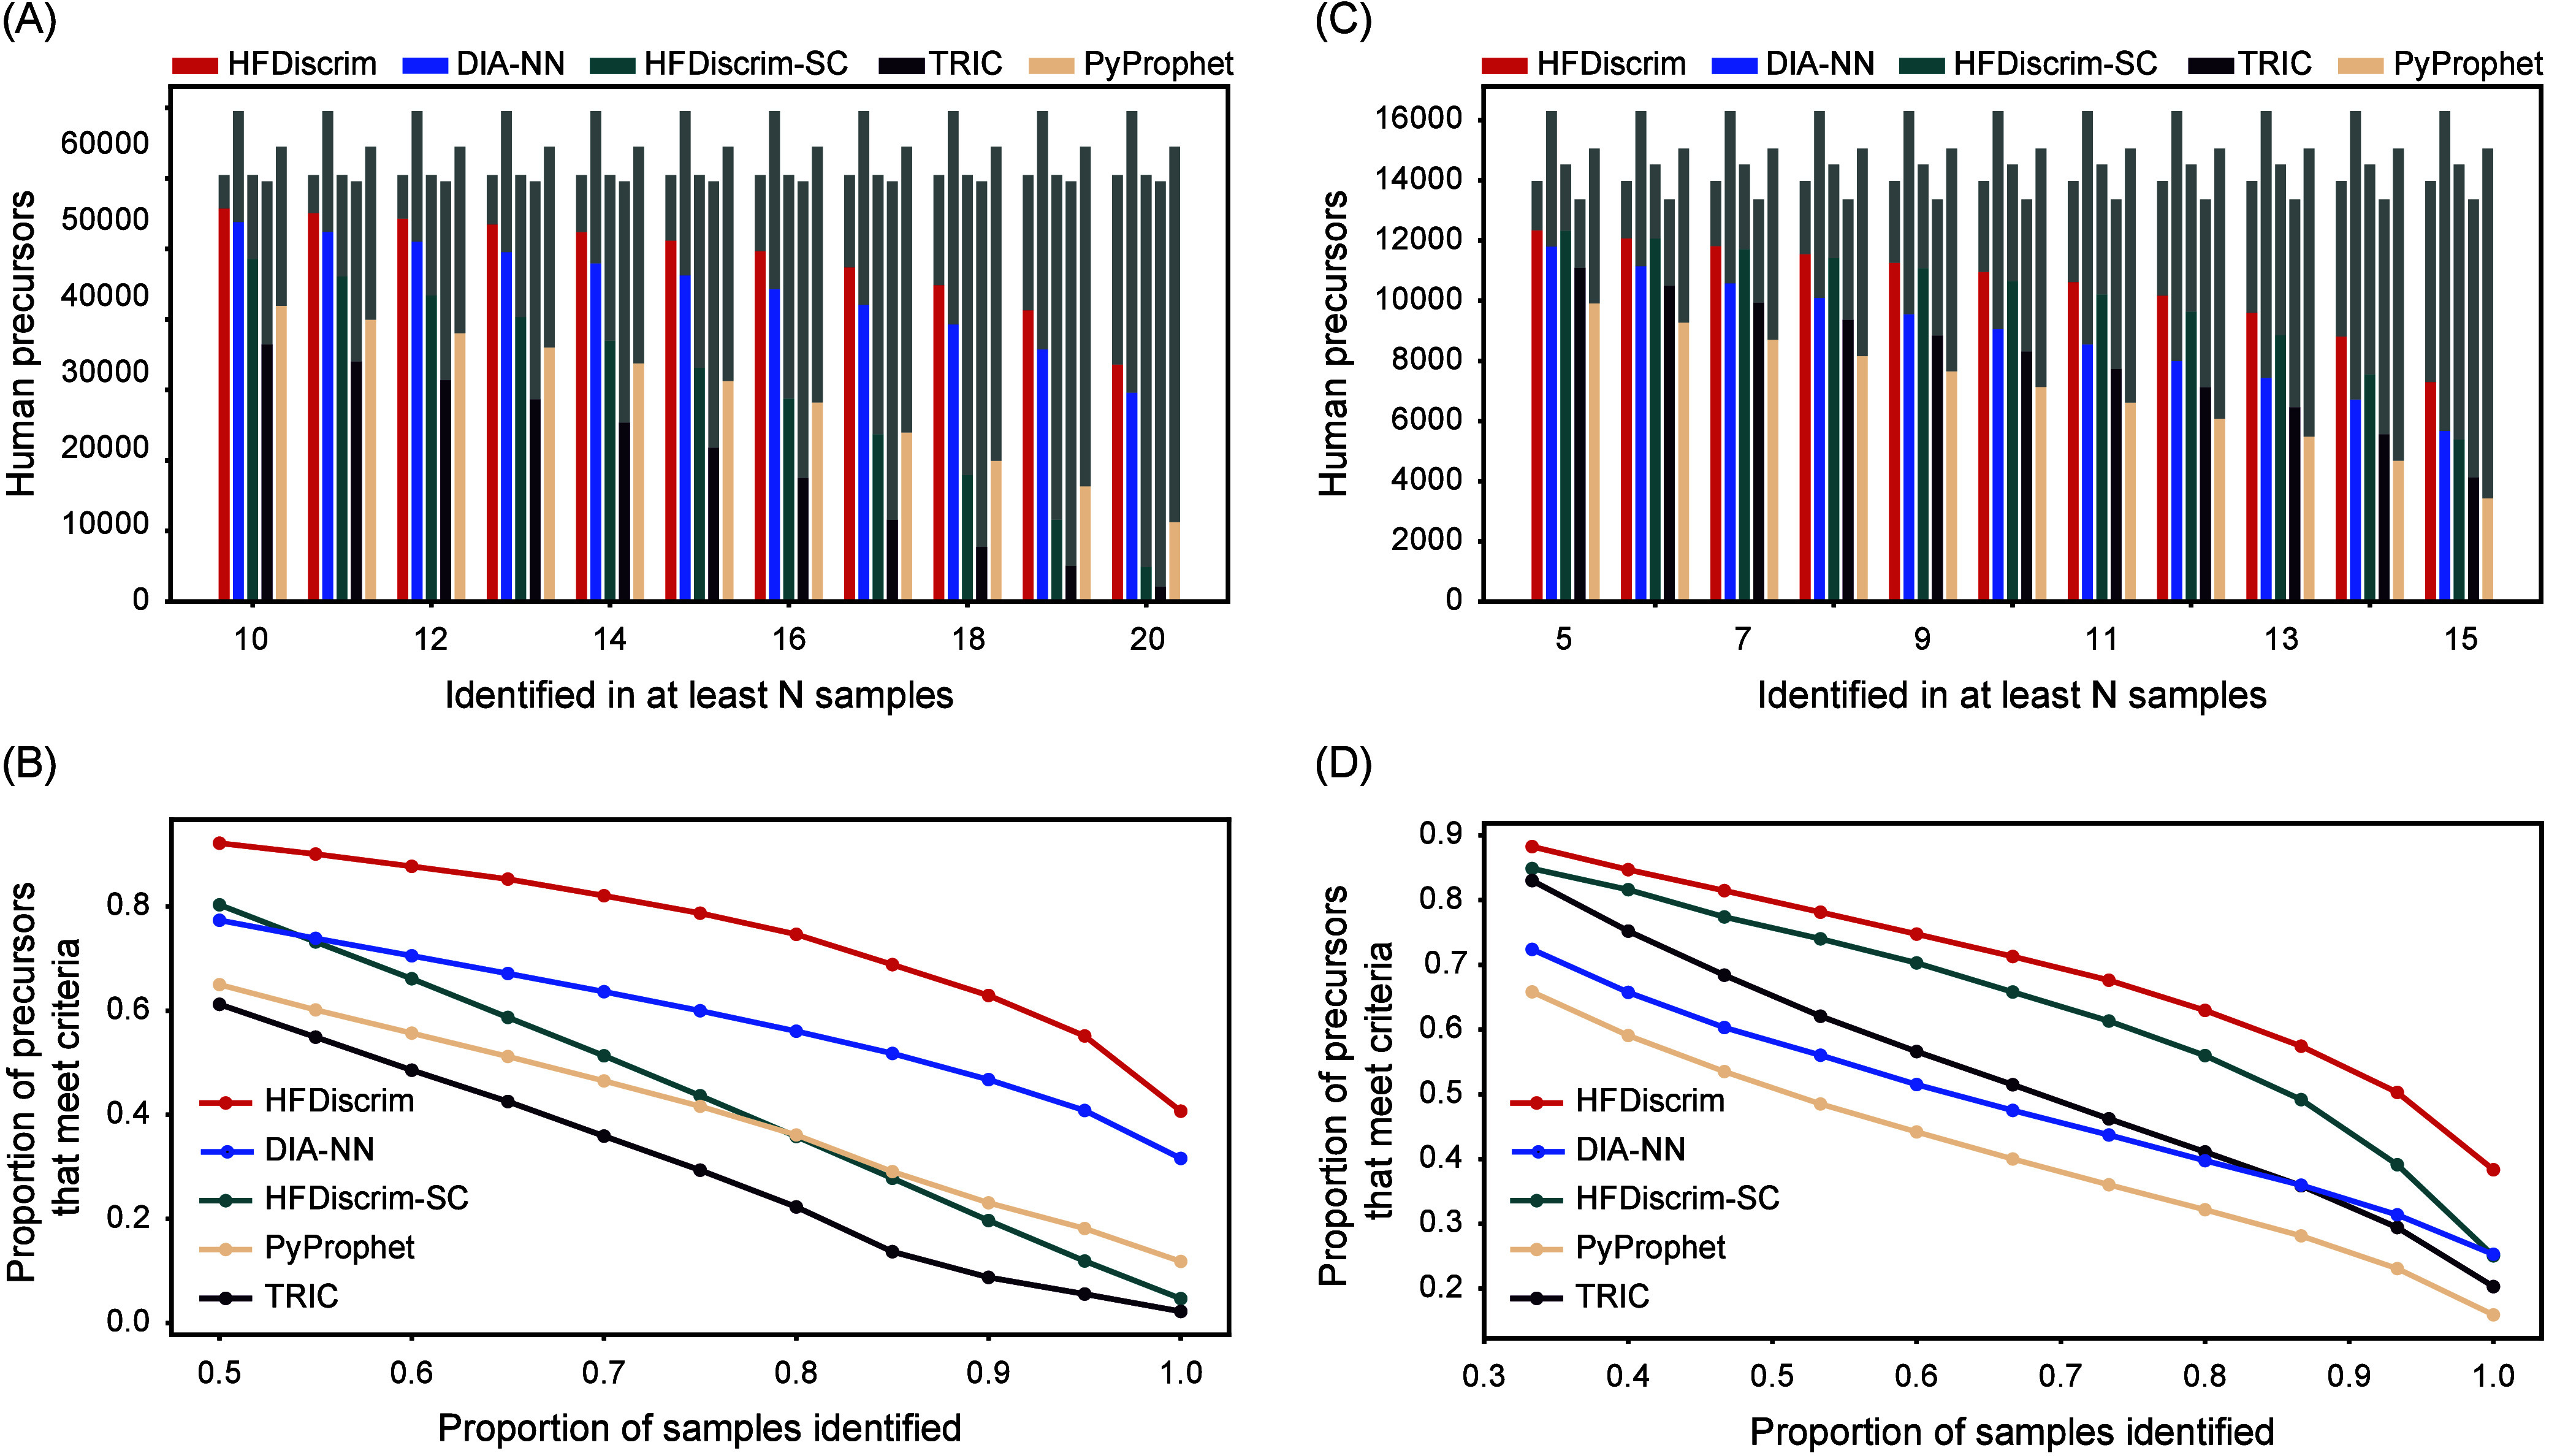
Evaluation of identification results of HFDiscrim on the ccRCC and Prostate data sets. (A) Number of human precursors identified by HFDiscrim and other tools in at least N samples out of 20 runs in the ccRCC data set. The x-axis represents the number of samples (N) in which a precursor was identified, and the y-axis shows the count of identified human precursors. Color bars represent the number of precursors identified by each tool, and gray bars indicate the number of precursors not identified in N samples by the corresponding tools. (B) Relationship between the proportion of human precursors and the sample identification rate in the ccRCC data set. (C) Same as in (A) but for the Prostate data set. (D) Same as in (B) but for the Prostate data set.
We employed a Prostate data set composed of multiple runs with varying background proteins for further testing (Figure 5C,D). The 15 samples included 50% prostate cancer tissue, with the remaining 50% comprising ovarian cancer tissue and yeast cell lysate in varying proportions, ranging from 1:0 to 0:1. Compared to PyProphet, HFDiscrim consistently showed significant improvement in identifying consistent proteins. In contrast to the results on the ccRCC data set, TRIC and HFDiscrim-SC outperformed PyProphet, suggesting that the robustness of TRIC and HFDiscrim-SC is inferior to that of HFDiscrim.
HFDiscrim, using OpenSWATH results, not only exhibited peptide identification performance comparable to that of DIA-NN, but also demonstrated significantly superior consistency in multirun identification compared to both DIA-NN and other OpenSWATH-based workflows.
HFDiscrim Shows Better Quantification Performance
HFDiscrim’s novel method for identifying candidate peaks requires a thorough evaluation of its impact on quantification. To achieve this, we applied quality metrics focusing on accuracy and precision, utilizing the external data set from Navarro et al. Specifically, we assessed (i) quantification precision, determined by the median deviation of log2 fold change distributions observed for each species, and (ii) quantification accuracy, determined by the standard deviation of observed log2 fold change distributions from the theoretical centers based on known mixing ratios.
From the previous experiments, it is evident that HFDiscrim demonstrates a stronger capability in identifying peptides and proteins. However, the additional analytes identified by HFDiscrim, compared to those identified by both HFDiscrim and the other tools, often correspond to chromatographic signals with lower signal-to-noise ratios. To fairly compare the quantification performance of HFDiscrim and the other tools, we evaluated the precision and accuracy of peptide quantification, as well as the precision and accuracy of protein quantification, under the same number of peptide precursors for those tools.
The quantification results of a three-species benchmark mixture, measured on a SCIEX TripleTOF 6600 instrument with proteomes from human, yeast, and E. coli mixed in defined ratios, were analyzed using HFDiscrim and other tools (Figure 6). Due to the high human protein content in the mixture, which results in higher accuracy and precision (lower values), the comparison focuses on yeast and E. coli. HFDiscrim and HFDiscrim-SC achieved similar accuracy, outperforming PyProphet and TRIC for E. coli peptides and proteins. However, for E. coli peptides, HFDiscrim-SC’s precision performance was significantly lower than that of the other tools. Similarly, for E. coli proteins, HFDiscrim-SC and TRIC exhibited comparable performance, both inferior to HFDiscrim. For yeast peptides and proteins, HFDiscrim and HFDiscrim-SC outperformed TRIC and PyProphet in accuracy, but HFDiscrim-SC displayed unstable precision, performing worse than HFDiscrim. Overall, tools incorporating cross-run features exhibited better accuracy than PyProphet. However, TRIC’s improvement was minimal, with only a slight enhancement in E. coli protein accuracy. HFDiscrim-SC’s improvement was inconsistent; despite significant accuracy gains over PyProphet, it had lower peptide precision than PyProphet. Only HFDiscrim outperformed the other three tools in both accuracy and precision, indicating that HFDiscrim’s quantification results are more consistent and less variable.
Figure 6.
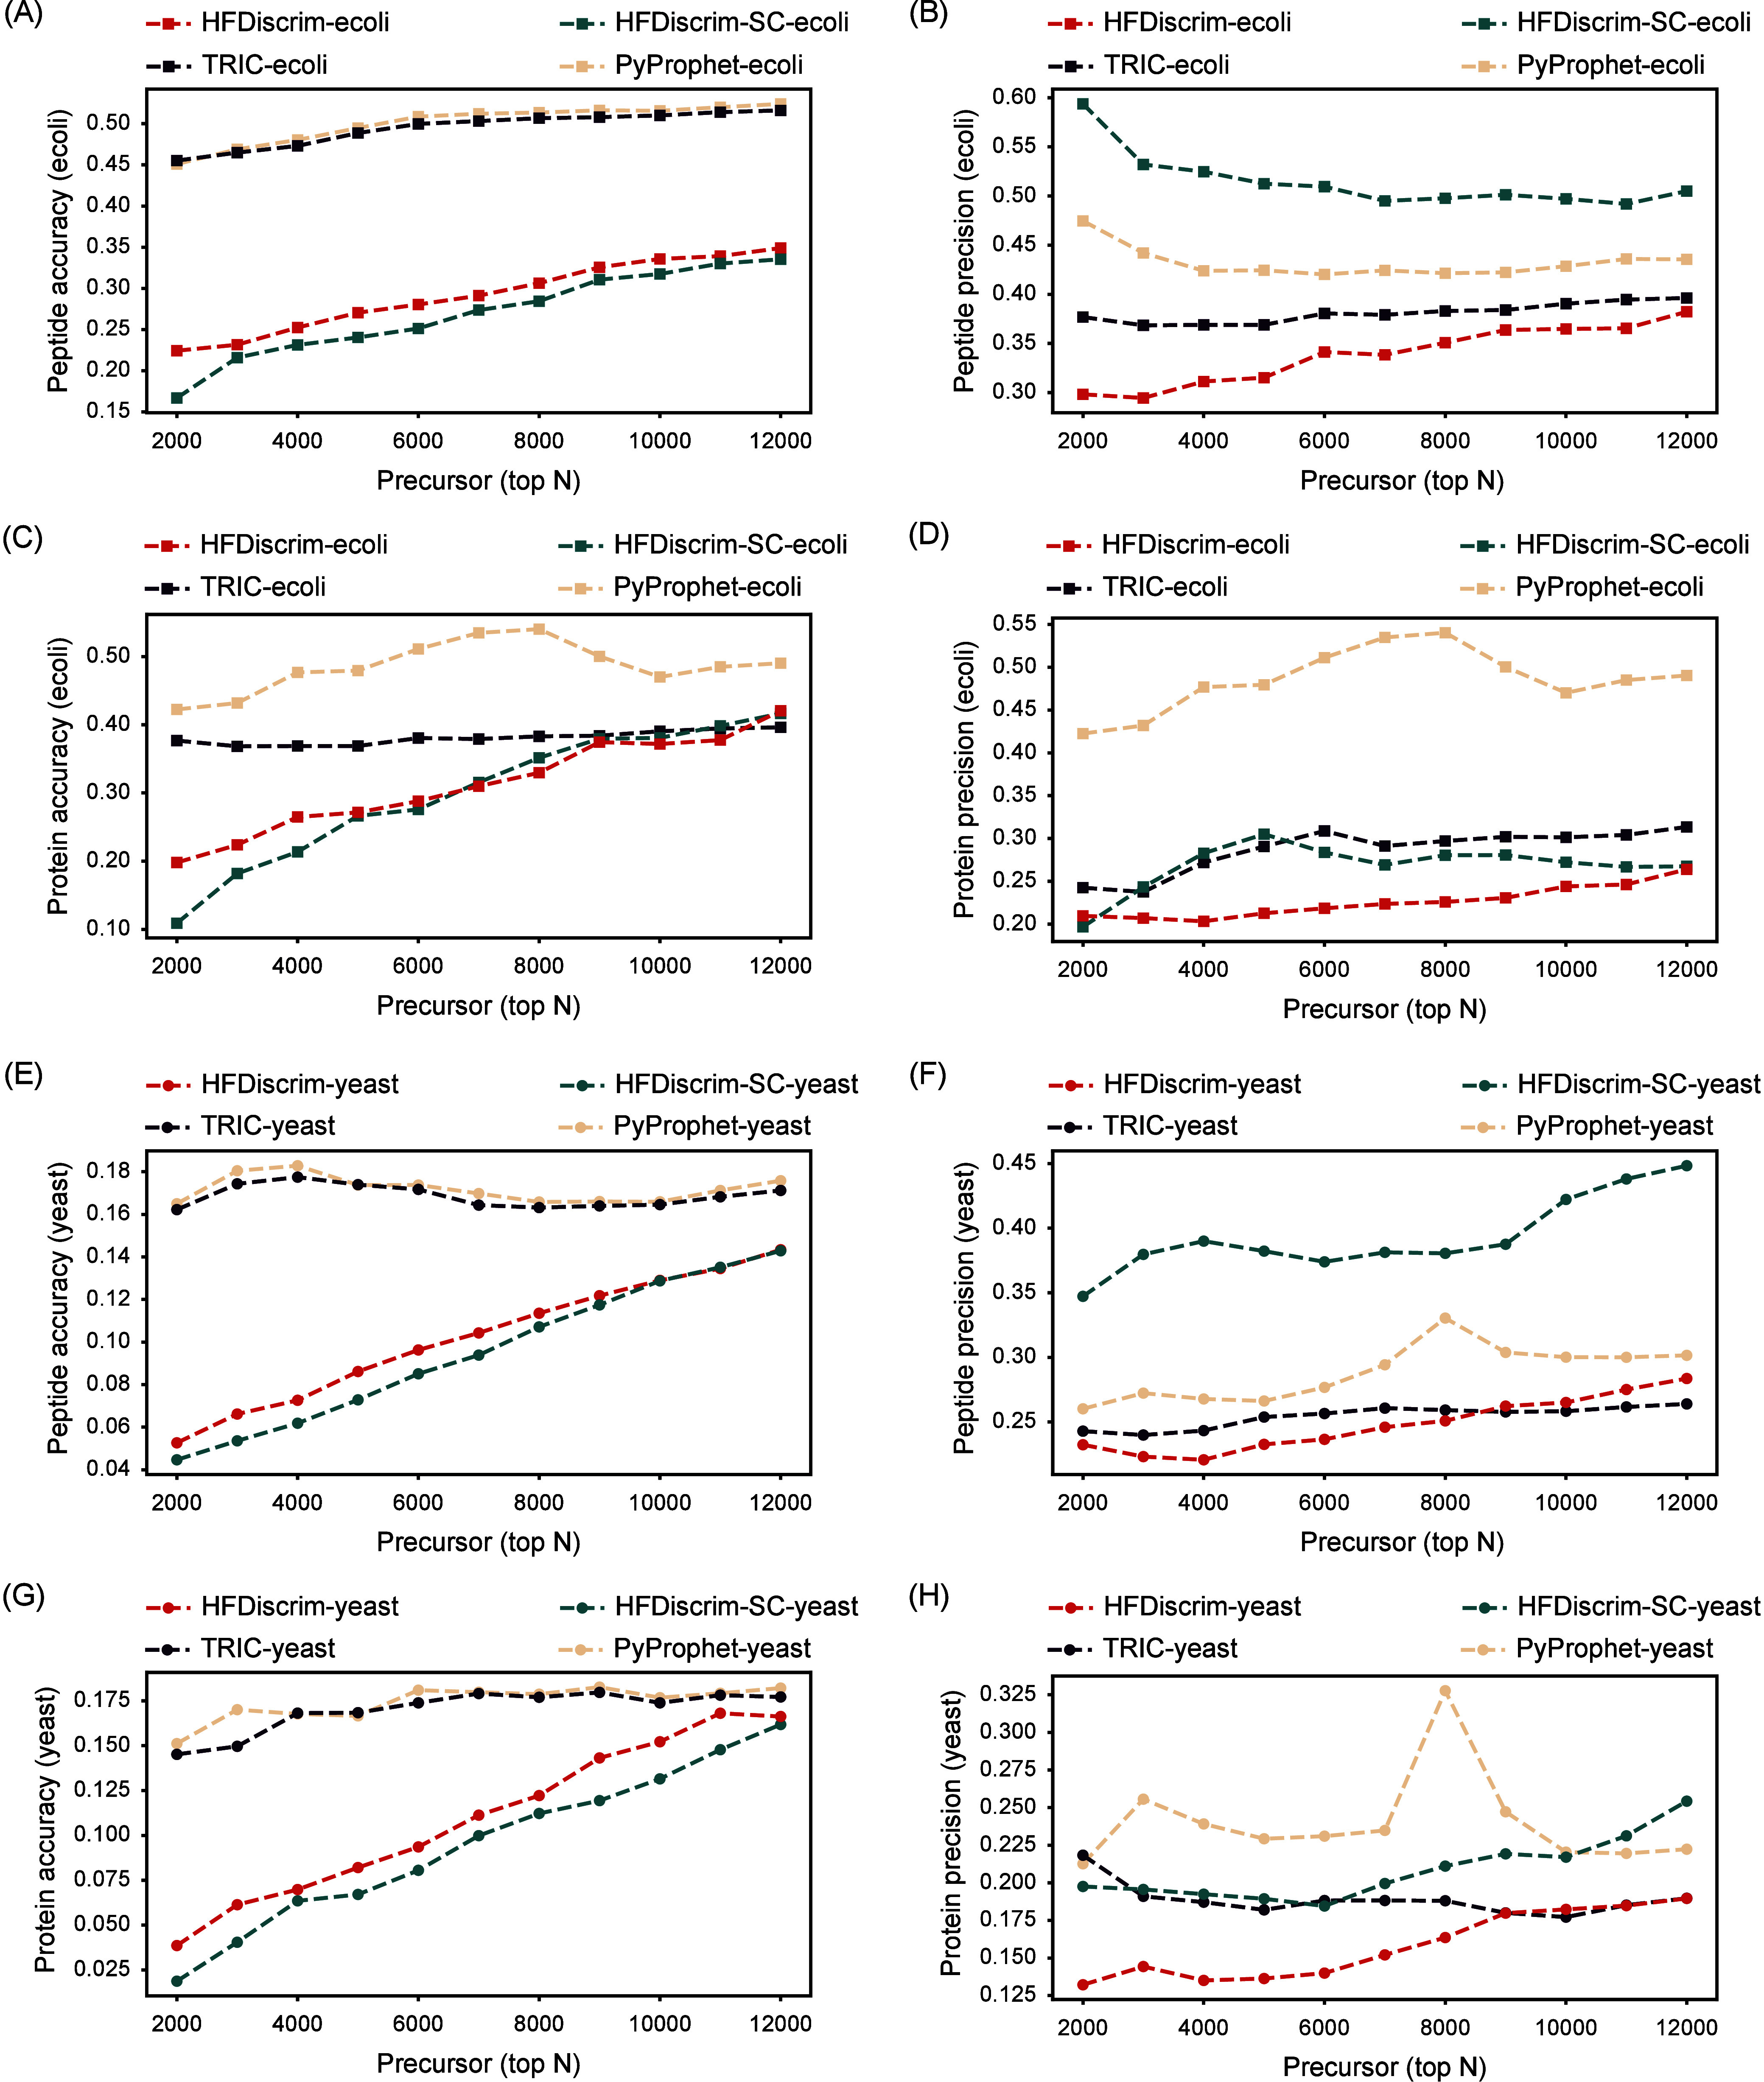
Quantification of the HYE124 data set, which mixes proteomes from three species in a defined ratio, using HFDiscrim and other tools for DIA. (A) E. coli peptide accuracy, (B) E. coli peptide precision, (C) E. coli protein accuracy, (D) E. coli protein precision, (E) yeast peptide accuracy, (F) yeast peptide precision, (G) yeast protein accuracy, (H) yeast protein precision, as functions of the top N precursors identified. The x-axis represents the top N precursors, while the y-axes show the corresponding accuracy or precision values.
Additionally, the HYE110 data set yielded consistent conclusions (Figure S3). These results indicate that HFDiscrim consistently offers enhanced quantification performance in terms of both accuracy and precision for peptides and proteins. HFDiscrim outperforms PyProphet in both accuracy and precision, making it a more reliable tool for protein quantification. The improvement in HFDiscrim’s performance can be attributed to the integration of single-run and cross-run features, which allows HFDiscrim to identify more accurate chromatographic signals, leading to better quantification results.
Impact of Cross-Run Feature Design on Identification Performance
HFDiscrim incorporates five types of cross-run features, designed based on the principle that peptides should exhibit similar chromatographic peak signals at similar retention times across different runs. These features include:
-
1.
Three types that measure the similarity of chromatographic peak signals.
-
2.
One type that assesses the proximity of chromatographic peak signals in normalized retention time.
-
3.
One type that evaluates the match between reference chromatographic peaks and the spectral library.
To evaluate the contribution of each cross-run feature to peptide identification, we conducted an ablation study. Seven different compositions of hybrid features were constructed and tested on ten samples of the mouse cerebellum data set using a DDA-based spectral library. These compositions included:
-
1.
One with all types of cross-run features.
-
2.
Five with each missing a specific type of feature.
-
3.
A control group without any cross-run features.
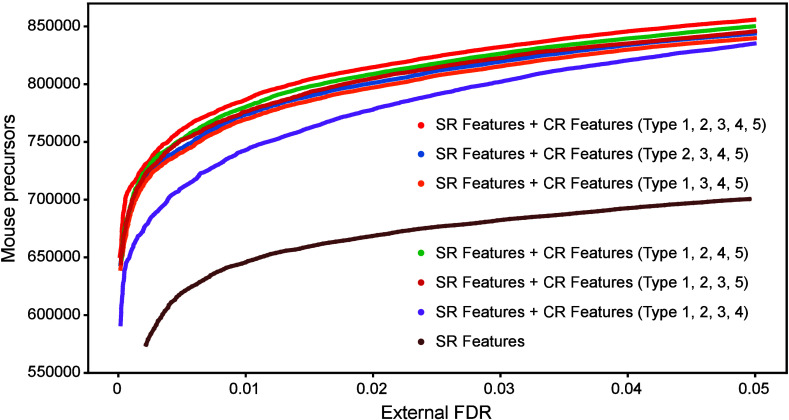
We used the curve of the total number of precursors identified in ten samples of the MCB data set as a function of external FDR (Figure 1A) to represent identification ability. The results showed that the number of precursors identified using cross-run features was significantly higher than those identified using only single-run features, indicating that cross-run features improve precursor identification. Furthermore, the number of precursors identified by each of the five compositions lacking one type cross-run feature was lower than those identified with the complete set, suggesting that each type of cross-run feature enhances HFDiscrim’s ability to characterize chromatographic peaks. Among these, the single-run discriminant score derived from the reference chromatographic peak showed the most significant improvement, reflecting the quality of the reference chromatographic peak. The combination of the four types of cross-run features (Types 1, 2, 3, and 4) was more beneficial than Type 5, highlighting the importance of consistency between the target and reference chromatographic peaks (Figure 7). Therefore, the study concludes that the integration of single-run features, the quality of the reference chromatographic peak, and the consistency between the target and reference chromatographic peaks are all essential for distinguishing between the elution patterns of real peptides and decoys.
Figure 7.
Optimization of the cross-run feature compositions in HFDiscrim was conducted. Six different compositions of cross-run features were tested on ten samples of the MCB data set using a DDA-based spectral library. The FDR was estimated using the “external” method. The numbers of mouse precursors identified at different FDRs were plotted to compare the performance.
Conclusions
In this study, we developed HFDiscrim, a multirun DIA analysis tool designed to enhance the depth and consistency of reliable peptide identification across multiple runs. HFDiscrim effectively aligns retention times, compares multirun chromatographic peak signals, and derives subscores representing the cross-run features of the chromatographic peaks. This multicenter comparison strategy, as opposed to a single-center comparison strategy, mitigates errors associated with insufficient single-run feature characterization and improves the accuracy and precision of peptide and protein quantification.
HFDiscrim is not limited to supporting only OpenSWATH output but can also incorporate chromatographic peak signals and corresponding single-run features from any DIA mass spectrometry analysis tool, enhancing peptide identification performance for DIA data.
Our benchmarking results on laboratory and clinical samples demonstrated that HFDiscrim outperformed existing single-run and multirun tools, such as PyProphet and TRIC. HFDiscrim provided more accurate quantification in the two-species library and LFQbench tests, highlighting the advantages of incorporating hybrid features across multiple runs for reliable identification. The tool’s ability to scale with sample size further enhances its utility in large-scale proteomics studies. Specifically, HFDiscrim identified a significantly higher number of mouse precursors, peptides, and proteins compared to single-run tool. The evaluation of HFDiscrim on clinical samples, such as the ccRCC and Prostate data sets, confirmed its superior performance in identifying consistent proteins across varying sample backgrounds. Additionally, HFDiscrim consistently achieved better accuracy and precision in quantification compared to other tools, as evidenced by its performance on the HYE124 and HYE110 data sets.
Overall, HFDiscrim represents a significant advancement in DIA-based proteomics, offering a reliable solution for consistent and comprehensive peptide and protein identification. Integration of cross-run features in DIA analysis and utilization of a multicenter comparison strategy are shown to enhance performance, leading to more accurate and reproducible protemomic data. The implementation in Python framework ensures ease of use and flexibility for the DIA proteomics community. HFDiscrim is available at https://github.com/yachliu/HFDiscrim.
Acknowledgments
The authors acknowledge the financial support from the National Natural Science Foundation of China (Grant No. 82002529).
Supporting Information Available
The Supporting Information is available free of charge at https://pubs.acs.org/doi/10.1021/acsomega.4c07398.
Figure S1 showing identification performance on all 10 samples of the MCB data set (DIA-based spectral library); Figure S2 showing impact of sample size on HFDiscrim performance; Figure S3 showing quantification of HYE110 data set for mixing proteomes from three species in defined ratio with HFDiscrim and the other tools for DIA (PDF)
The authors declare no competing financial interest.
Supplementary Material
References
- Hunter T. Protein kinases and phosphatases: the yin and yang of protein phosphorylation and signaling. Cell 1995, 80, 225–236. 10.1016/0092-8674(95)90405-0. [DOI] [PubMed] [Google Scholar]
- Pfanner N.; Warscheid B.; Wiedemann N. Mitochondrial proteins: from biogenesis to functional networks. Nat. Rev. Mol. Cell Biol. 2019, 20, 267–284. 10.1038/s41580-018-0092-0. [DOI] [PMC free article] [PubMed] [Google Scholar]
- Wright P. E.; Dyson H. J. Intrinsically disordered proteins in cellular signalling and regulation. Nat. Rev. Mol. Cell Biol. 2015, 16, 18–29. 10.1038/nrm3920. [DOI] [PMC free article] [PubMed] [Google Scholar]
- Rosenberger G.; Bludau I.; Schmitt U.; Heusel M.; Hunter C. L.; Liu Y.; MacCoss M. J.; MacLean B. X.; Nesvizhskii A. I.; Pedrioli P. G.; et al. Statistical control of peptide and protein error rates in large-scale targeted data-independent acquisition analyses. Nat. Methods 2017, 14, 921–927. 10.1038/nmeth.4398. [DOI] [PMC free article] [PubMed] [Google Scholar]
- Shen X.; Shen S.; Li J.; Hu Q.; Nie L.; Tu C.; Wang X.; Orsburn B.; Wang J.; Qu J. An IonStar experimental strategy for MS1 ion current-based quantification using ultrahigh-field orbitrap: reproducible, in-depth, and accurate protein measurement in large cohorts. J. Proteome Res. 2017, 16, 2445–2456. 10.1021/acs.jproteome.7b00061. [DOI] [PMC free article] [PubMed] [Google Scholar]
- Blackburn K.; Mbeunkui F.; Mitra S. K.; Mentzel T.; Goshe M. B. Improving protein and proteome coverage through data-independent multiplexed peptide fragmentation. J. Proteome Res. 2010, 9, 3621–3637. 10.1021/pr100144z. [DOI] [PubMed] [Google Scholar]
- Tsou C.-C.; Avtonomov D.; Larsen B.; Tucholska M.; Choi H.; Gingras A.-C.; Nesvizhskii A. I. DIA-Umpire: comprehensive computational framework for data-independent acquisition proteomics. Nat. Methods 2015, 12, 258–264. 10.1038/nmeth.3255. [DOI] [PMC free article] [PubMed] [Google Scholar]
- Bilbao A.; Varesio E.; Luban J.; Strambio-De-Castillia C.; Hopfgartner G.; Müller M.; Lisacek F. Processing strategies and software solutions for data-independent acquisition in mass spectrometry. Proteomics 2015, 15, 964–980. 10.1002/pmic.201400323. [DOI] [PubMed] [Google Scholar]
- Röst H. L.; Rosenberger G.; Navarro P.; Gillet L.; Miladinović S. M.; Schubert O. T.; Wolski W.; Collins B. C.; Malmström J.; Malmström L.; et al. OpenSWATH enables automated, targeted analysis of data-independent acquisition MS data. Nature biotechnology 2014, 32, 219–223. 10.1038/nbt.2841. [DOI] [PubMed] [Google Scholar]
- Sinitcyn P.; Hamzeiy H.; Salinas Soto F.; Itzhak D.; McCarthy F.; Wichmann C.; Steger M.; Ohmayer U.; Distler U.; Kaspar-Schoenefeld S.; et al. MaxDIA enables library-based and library-free data-independent acquisition proteomics. Nature biotechnology 2021, 39, 1563–1573. 10.1038/s41587-021-00968-7. [DOI] [PMC free article] [PubMed] [Google Scholar]
- Demichev V.; Messner C. B.; Vernardis S. I.; Lilley K. S.; Ralser M. DIA-NN: neural networks and interference correction enable deep proteome coverage in high throughput. Nat. Methods 2020, 17, 41–44. 10.1038/s41592-019-0638-x. [DOI] [PMC free article] [PubMed] [Google Scholar]
- Gao M.; Yang W.; Li C.; Chang Y.; Liu Y.; He Q.; Zhong C.-Q.; Shuai J.; Yu R.; Han J. Deep representation features from DreamDIAXMBD improve the analysis of data-independent acquisition proteomics. Commun. Biol. 2021, 4, 1190. 10.1038/s42003-021-02726-6. [DOI] [PMC free article] [PubMed] [Google Scholar]
- Reiter L.; Rinner O.; Picotti P.; Hüttenhain R.; Beck M.; Brusniak M.-Y.; Hengartner M. O.; Aebersold R. mProphet: automated data processing and statistical validation for large-scale SRM experiments. Nat. Methods 2011, 8, 430–435. 10.1038/nmeth.1584. [DOI] [PubMed] [Google Scholar]
- Röst H. L.; Liu Y.; D’Agostino G.; Zanella M.; Navarro P.; Rosenberger G.; Collins B. C.; Gillet L.; Testa G.; Malmström L.; et al. TRIC: an automated alignment strategy for reproducible protein quantification in targeted proteomics. Nat. Methods 2016, 13, 777–783. 10.1038/nmeth.3954. [DOI] [PMC free article] [PubMed] [Google Scholar]
- Gupta S.; Ahadi S.; Zhou W.; Röst H. DIAlignR Provides Precise Retention Time Alignment Across Distant Runs in DIA and Targeted Proteomics*[S]. Molecular & Cellular Proteomics 2019, 18, 806–817. 10.1074/mcp.TIR118.001132. [DOI] [PMC free article] [PubMed] [Google Scholar]
- Gupta S.; Sing J. C.; Röst H. L. Achieving quantitative reproducibility in label-free multisite DIA experiments through multirun alignment. Communi. Biol. 2023, 6, 1101. 10.1038/s42003-023-05437-2. [DOI] [PMC free article] [PubMed] [Google Scholar]
- Yan B.; Shi M.; Cai S.; Su Y.; Chen R.; Huang C.; Chen D. D. Y. Data-driven tool for cross-run ion selection and peak-picking in quantitative proteomics with data-independent acquisition LC–MS/MS. Anal. Chem. 2023, 95, 16558–16566. 10.1021/acs.analchem.3c02689. [DOI] [PubMed] [Google Scholar]
- Teo G.; Kim S.; Tsou C.-C.; Collins B.; Gingras A.-C.; Nesvizhskii A. I.; Choi H. mapDIA: Preprocessing and statistical analysis of quantitative proteomics data from data independent acquisition mass spectrometry. Journal of proteomics 2015, 129, 108–120. 10.1016/j.jprot.2015.09.013. [DOI] [PMC free article] [PubMed] [Google Scholar]
- Navarro P.; Kuharev J.; Gillet L. C.; Bernhardt O. M.; MacLean B.; Röst H. L.; Tate S. A.; Tsou C.-C.; Reiter L.; Distler U.; et al. A multicenter study benchmarks software tools for label-free proteome quantification. Nature biotechnology 2016, 34, 1130–1136. 10.1038/nbt.3685. [DOI] [PMC free article] [PubMed] [Google Scholar]
- Martens L.; Chambers M.; Sturm M.; Kessner D.; Levander F.; Shofstahl J.; Tang W. H.; Römpp A.; Neumann S.; Pizarro A. D.; et al. mzML—a community standard for mass spectrometry data. Mol. Cell. Proteomics 2011, 10, R110.000133. 10.1074/mcp.R110.000133. [DOI] [PMC free article] [PubMed] [Google Scholar]
- Kong A. T.; Leprevost F. V.; Avtonomov D. M.; Mellacheruvu D.; Nesvizhskii A. I. MSFragger: ultrafast and comprehensive peptide identification in mass spectrometry-based proteomics. Nat. Methods 2017, 14, 513–520. 10.1038/nmeth.4256. [DOI] [PMC free article] [PubMed] [Google Scholar]
- Yu F.; Teo G. C.; Kong A. T.; Fröhlich K.; Li G. X.; Demichev V.; Nesvizhskii A. I. Analysis of DIA proteomics data using MSFragger-DIA and FragPipe computational platform. Nat. Commun. 2023, 14, 4154. 10.1038/s41467-023-39869-5. [DOI] [PMC free article] [PubMed] [Google Scholar]
- Krmar J.; Vukićević M.; Kovačević A.; Protić A.; Zečević M.; Otašević B. Performance comparison of nonlinear and linear regression algorithms coupled with different attribute selection methods for quantitative structure-retention relationships modelling in micellar liquid chromatography. Journal of Chromatography A 2020, 1623, 461146. 10.1016/j.chroma.2020.461146. [DOI] [PubMed] [Google Scholar]
- Bruderer R.; Muntel J.; Müller S.; Bernhardt O. M.; Gandhi T.; Cominetti O.; Macron C.; Carayol J.; Rinner O.; Astrup A.; et al. Analysis of 1508 Plasma Samples by Capillary-Flow Data-Independent Acquisition Profiles Proteomics of Weight Loss and Maintenance’[S]. Molecular & Cellular Proteomics 2019, 18, 1242–1254. 10.1074/mcp.RA118.001288. [DOI] [PMC free article] [PubMed] [Google Scholar]
- Muntel J.; Kirkpatrick J.; Bruderer R.; Huang T.; Vitek O.; Ori A.; Reiter L. Comparison of protein quantification in a complex background by DIA and TMT workflows with fixed instrument time. J. Proteome Res. 2019, 18, 1340–1351. 10.1021/acs.jproteome.8b00898. [DOI] [PubMed] [Google Scholar]
- Poulos R. C.; Hains P. G.; Shah R.; Lucas N.; Xavier D.; Manda S. S.; Anees A.; Koh J. M.; Mahboob S.; Wittman M.; et al. Strategies to enable large-scale proteomics for reproducible research. Nat. Commun. 2020, 11, 3793. 10.1038/s41467-020-17641-3. [DOI] [PMC free article] [PubMed] [Google Scholar]
- Clark D. J.; Dhanasekaran S. M.; Petralia F.; Pan J.; Song X.; Hu Y.; da Veiga Leprevost F.; Reva B.; Lih T.-S. M.; Chang H.-Y.; et al. Integrated proteogenomic characterization of clear cell renal cell carcinoma. Cell 2019, 179, 964–983. 10.1016/j.cell.2019.10.007. [DOI] [PMC free article] [PubMed] [Google Scholar]
- Zhang H.; Liu P.; Guo T.; Zhao H.; Bensaddek D.; Aebersold R.; Xiong L. Arabidopsis proteome and the mass spectral assay library. Sci. Data 2019, 6, 278. 10.1038/s41597-019-0294-0. [DOI] [PMC free article] [PubMed] [Google Scholar]
Associated Data
This section collects any data citations, data availability statements, or supplementary materials included in this article.


