Abstract
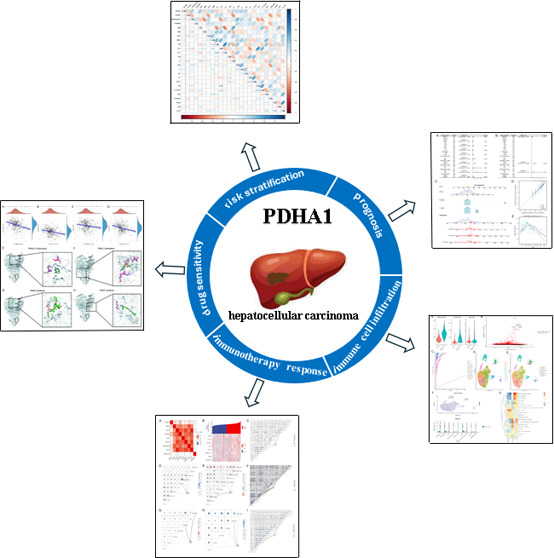
PDHA1 was associated with metabolic reprogramming in tumor progression. However, the clinical value of PDHA1, especially for prediction of drug sensitivity in hepatocellular carcinoma (HCC), has not been fully investigated. In this study, we found that PDHA1 expression was higher in HCC tissues compared to normal tissues and was correlated with poor prognosis in HCC patients. PDHA1 expression was mainly positively associated with immune cell infiltration using the TIMER, XCell, MCPCOUNTER, CIBERSORT, EPIC, and QUANTISEQ algorithms, which was validated by single-cell RNA-sequencing analysis. We also discovered that PDHA1 expression was correlated with six immune checkpoint-related genes. Univariate and multivariate Cox regression analyses revealed that PDHA1 expression was an independent prognostic indicator for HCC patients, and the nomogram incorporating PDHA1 expression exhibited excellent predictive capacity. Furthermore, PDHA1 expression was positively linked to the sensitivity of 5-fluorouracil, gemcitabine, paclitaxel, and sorafenib, and the molecular docking analysis demonstrated their excellent binding affinity.
1. Introduction
Primary liver cancer is one of the most prevalent malignant tumors with a significant mortality rate globally, which seriously threatens people’s lives and health.1,2 Primary liver cancer mainly consists of three pathological types: hepatocellular carcinoma (HCC), intrahepatic cholangiocarcinoma (ICC), and mixed hepatocellular carcinoma-cholangiocarcinoma (cHCC-CCA), with HCC accounting for about 90% of the cases.1,2 HCC is characterized by insidious onset, rapid growth, and high recurrence and metastasis rate, leading to poor overall treatment outcomes and extremely poor prognosis.3 Hence, finding a reliable biomarker for the early diagnosis and prognostic assessment of HCC is significant.
The pathogenesis of HCC involves viral infection,4 oncogene activation and inactivation of oncogenes,5 alteration of tumor microenvironment,6 metabolic reprogramming,7 etc. Among them, metabolic reprogramming has received much attention in the proliferation and migration of HCC and its microenvironmental alterations.8 Previous studies have confirmed that HCC cell metabolism is significantly reprogrammed, which is mainly manifested by the abnormal activity of glycolysis,9 fatty acid synthesis,10 and glutamine metabolism.11 Several studies have shown that targeting the abnormal metabolic enzymes and pathways in HCC can significantly inhibit tumor growth and metastasis, thus presenting a good prospect for clinical application.12−14 However, the diagnosis and treatment of HCC marked by metabolic enzymes or pathways were less than optimal, and the biological features of HCC have not been fully elucidated due to the complexity of cellular metabolic networks.
Pyruvate dehydrogenase E1 component subunit α (PDHA1) is a rate-limiting enzyme that initiates the tricarboxylic acid (TCA) cycle by transforming pyruvate into acetyl coenzyme A in mitochondria. The TCA cycle is the last metabolic pathway for glucose, lipids, and amino acids and the hub of the metabolic link between these three components. In recent years, some bioinformatic analyses and experimental evidence have demonstrated that PDHA1 participated in the regulation of metabolic reprogramming in tumor progression, such as in melanoma,15 prostate cancer,16 and cervical cancer,17 and correlated with the prognosis of tumor patients. Moreover, it was reported that PDHA1 overexpression inhibited the Warburg effect and induced cell apoptosis via mitochondria-mediated pathways in HCC.18 Another study found that insulin stimulated the growth of HCC cells by increasing PDHA1 phosphorylation.19 However, the clinical value of PDHA1 especially for prediction of drug sensitivity has not yet been thoroughly clarified.
In the current study, we validated PDHA1 overexpression in our HCC tissue samples by using immunohistochemistry (IHC). We also explored the association between PDHA1 expression and immune cell infiltration, immune checkpoint expression, prognosis, and clinicopathological features in HCC patients. Moreover, we predicted the relationship between PDHA1 expression and sensitivity of four chemotherapy agents in HCC and measured their binding energy by using molecular simulation. Our study revealed the clinical value of PDHA1 expression, especially for prediction of chemotherapy drug sensitivity in HCC patients.
2. Materials and Methods
2.1. Data Acquisition and Processing
The clinical data and RNA-sequencing expression profiles of 50 normal samples and 374 HCC patients were provided by the TCGA database. The raw counts were converted into TPM format. Table S1 illustrates the baseline characteristics of patients from the TCGA cohort.
Digestive system pan-cancer refers to digestive system cancers, including esophageal carcinoma (ESCA), stomach adenocarcinoma (STAD), colon adenocarcinoma (COAD), rectum adenocarcinoma (READ), liver hepatocellular carcinoma (LIHC), cholangiocarcinoma (COAD), and pancreatic adenocarcinoma (PAAD). For digestive system pan-cancer analysis of PDHA1, RNA-sequencing expression profiles and the corresponding clinical information on ESCA, STAD, COAD, READ, COAD, and PAAD were also downloaded from the TCGA database.
2.2. HCC Tissue Samples Collection
Wax blocks of tumor tissue from 30 HCC patients who underwent surgical resection at Wenzhou Medical University Affiliated Zhoushan Hospital from September 2021 to June 2023 were collected. Wax blocks are produced by the Department of Pathology in the hospital and are requested in accordance with the requirements and procedures. Besides, clinical information and laboratory data of the patients were acquired from hospital electronic medical records. All specimens were collected with the informed consent of the patients and Ethics Committee approval of the hospital, and the following inclusion and exclusion criteria were applied:
Inclusion criteria: (1) the postoperative pathological diagnosis was HCC; (2) the case information was intact.
Exclusion criteria: (1) age <18 years; (2) combined with other malignancies or significant diseases.
2.3. Differential Expression and Survival Analysis
The differential expression analysis was carried out between digestive system tumor tissues and normal tissues. The overall survival (OS) analysis was performed using the Cox regression and log-rank test by the “survival” R package. The hazard ratio (HR) was calculated by using the Cox proportional hazards model. Besides, the Kaplan–Meier curve was drawn by the “survminer” package, using the median as the cutoff value.
2.4. Immune Infiltration Score and Immune Checkpoint Correlation Analysis
To measure the immune infiltration level reliably, we used the “immuneeconv” R package, which integrated the six latest algorithms, including TIMER, XCell, MCPCOUNTER, CIBERSORT, EPIC, and QUANTISEQ. Each of these methods had a distinct advantage and had been benchmarked. The visualizations were performed with the “ggClusterNet” R package.
CD274, CTLA4, HAVCR2, LAG3, PDCD1, PDCD1LG2, TIGIT, and SIGLEC15 were immune checkpoint (ICK)-related genes, which could influence the immunotherapy effect of immune checkpoint blockades.20 The relationships between PDHA1 expression and ICK-related gene expression in HCC were explored by using Spearman correlation analysis.
2.5. Gene Set Enrichment Analysis (GSEA) and Relevance Network Visualization
After the ID conversion of genes in the input data, GSEA analysis21 was performed using the “clusterProfiler” R package.22 Predefined gene sets were obtained from the MSigDB database23 and gene sequencing was based on log|FC| value. The outcome of the GSEA analysis was visualized by the “ggplot2” R package. Spearman correlation analysis was applied to find the genes associated with PDHA1 expression with the limits of adjusted P value <0.05 (adjusted by the Benjamini–Hochberg method). The outcome was visualized in different ways using the “ggplot2″, “circlize”, and “linkET” R package.
2.6. Single-Cell RNA-Sequencing (scRNA-seq) Analysis
The scRNA-seq data set (accession number: GSE11227124) was obtained from the Gene Expression Omnibus (GEO) database. A total of 17856 cells from the tumor sample of one HCC patient were included in the study. The “seurat” R package was used to preprocess before dimensionality reduction. For each cell, three quality control measures were applied. Cells meeting any of the following criteria were excluded: (1) RNA counts <200, (2) RNA counts >2500, and (3) mitochondrial RNA >10%. The harmony method was utilized to eliminate the batch effects based on characteristic subsets of highly variable genes (HVGs). Then, the top 20 principal components (PCs) were screened based on the top 2000 HVGs using principal component analysis (PCA). Cluster visualization was implemented by uniform manifold approximation and projection (UMAP) reduction, and the marker genes were selected by the FindAllMarkers function with the adjusted P value <0.01 and log2|FC|>1. At last, each cluster was annotated based on the corresponding canonical marker genes.
For metabolism analysis, the mean expression levels of the cells contained in various clusters were initially determined by the AverageExpression function. For every cluster, the scores of the relevant pathways were determined using the “GSVA” R package,25 which were finally visualized by “pheatmap” R package.
2.7. Immunohistochemistry (IHC)
The procedure was carried out according to the manual of the automatic immunohistochemical stainer (BOND-MAX platform): All specimens were paraffin-embedded tissues, and the thickness of the tissue sections was 4 μm, which were baked at 120 °C in a 70 °C thermostat and put into the automatic immunohistochemical stainer for pretreatment of the tissue samples. After deparaffinization, the tissue was fixed at 100 °C for 20 min using a repair solution with pH = 9.0. The slices were immersed in 3% H2O2 for 20 min and rinsed with PBS three times, each for 5 min. Then, the primary antibody and horseradish peroxidase-labeled secondary antibody were incubated at room temperature for 25 and 8 min, respectively. DAB color development was done for 10 min and hematoxylin restaining for 8 min. Finally, the slices were dehydrated, sealed with neutral gum after reversing blue, and observed under the microscope.
2.8. Immunohistochemical Score
Each tissue section was shot under the same shooting environment and software parameters. The following criteria were used.
Staining intensity: brown was defined as strong positive with a score of 3; yellowish-brown was defined as medium positive with a score of 2; faint yellow was defined as weakly positive with a score of 1; colorless was defined as negative and scored as 0.
Percentage of stained cells: The proportion of stained cells to the total number of cells in the field of view ≥61% was scored as 3; the proportion of 31–60% was scored as 2; the proportion of 11–30% was scored as 1; the proportion of ≤10% was scored as 0.
Immunohistochemical score = staining intensity score+ percentage of stained cells score; 4–6 was considered high expression, 1–3 was considered low expression, and 0 was considered negative expression.
2.9. Drug Sensitivity and Molecular Docking Analysis
Since few biomarkers could reliably predict the susceptibility to chemotherapy drugs of HCC patients, we used the GDSC database26 to predict the chemotherapeutic response for every sample in the TCGA-LIHC cohort. The “pRRophetic” R package27 was utilized to perform the prediction process. Ridge regression was used to calculate the sample’s half-maximal inhibitory concentration (IC50).
We further performed molecular docking analysis to validate the efficacy of targeting relationships between chemotherapeutic agents and the PDHA1 protein. We obtained the protein crystal structure of PDHA1 (PDB: 2OZL) from the RCSB PDB database, dehydrated, and eliminated the ligands from the active center using PyMOL 2.5.4 software. The 3D structures of four chemotherapeutic drugs (5-fluorouracil, gemcitabine, paclitaxel, and sorafenib) were downloaded from the PubChem database. AutoDockTools 1.5.7 was used to carry out processes such as inserting polar hydrogens and charge calculations. The active pocket was included after the parameters of the receptor protein docking site. The grid box was centered at (8.958, 2.096, 74.21) Å; the grid lengths in XYZ directions were 100, 100, and 100 Å, respectively. Ultimately, Autodock Vina 1.1.228 was used to dock the receptor protein with the small molecule ligand and PyMOL 2.5.4 presented the docking data.
2.10. Statistical Analysis
All statistical analyses and visualization were implemented by R software (version 4.0.3). Student’s t test or Mann–Whitney U test was used to identify the significant differences between two independent groups with numerical variables. χ2 test or Fisher exact test was used to analyze the significant differences between two independent groups with categorical variables. P or adjusted P < 0.05 was considered as statistical significance (*P < 0.05; **P < 0.01; ***P < 0.001).
3. Results
3.1. Digestive System Pan-Cancer Analysis of PDHA1
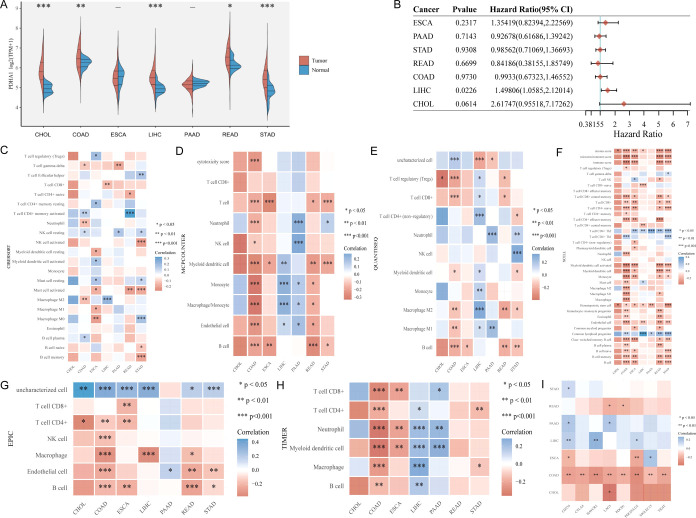
Given that the anatomical location, function, and metabolism are tightly associated, there may be commonalities in the growth and evolution of digestive system malignancies. To understand the circumstance of PDHA1 generally, we first explored the role of PDHA1 in the digestive system pan-cancer. As shown in Figure 1A, PDHA1 had a significant differential expression only in CHOL, COAD, LIHC, READ, and STAD. Moreover, univariate Cox regression analysis (Figure 1B) suggested that PDHA1 overexpression was significantly linked to poor prognosis in LIHC (P = 0.02, HR = 1.50), while PDHA1 expression had no correlation with prognosis in other digestive system malignancies (ESCA: P = 0.23, HR = 1.35; PAAD: P = 0.71, HR = 0.93; STAD: P = 0.93, HR = 0.99; READ: P = 0.67, HR = 0.84; COAD: P = 0.97, HR = 0.99; CHOL: P = 0.06, HR = 2.62). Using the six latest algorithms (Figure 1C–H), immune cell infiltration analysis showed that PDHA1 expression almost had no correlation with the immune cells in CHOL and was mainly correlated with T cells, B cells, macrophages, neutrophils, and dendritic cells in COAD, T cells in ESCA, T cells, macrophages, and dendritic cells in LIHC, neutrophils in PAAD, and T cells, B cells, macrophages in READ. Besides, PDHA1 expression was associated with at least one ICK-related gene expression in all digestive system malignancies (Figure 1I). Interestingly, PDHA1 expression was associated with the expression of all eight ICK-related genes in COAD.
Figure 1.
Digestive system pan-cancer analysis of PDHA1. (A) Differential expression analysis. (B) Univariate Cox regression analysis. Immune cell infiltration analysis using (C) CIBERSORT algorithm, (D) MCPcounter algorithm, (E) QUANTISEQ algorithm, (F) XCELL algorithm, (G) EPIC algorithm, and (H) TIMER algorithm. (I) Association between PDHA1 expression and the expression of eight ICK-related genes in digestive system tumors (CHOL: cholangiocarcinoma; COAD: colon adenocarcinoma; ESCA: esophageal carcinoma; LIHC: liver hepatocellular carcinoma; PAAD: pancreatic adenocarcinoma; STAD: stomach adenocarcinoma).
3.2. Difference Expression, Survival, GSEA Analysis, and Relevance Network of PDHA1 in HCC
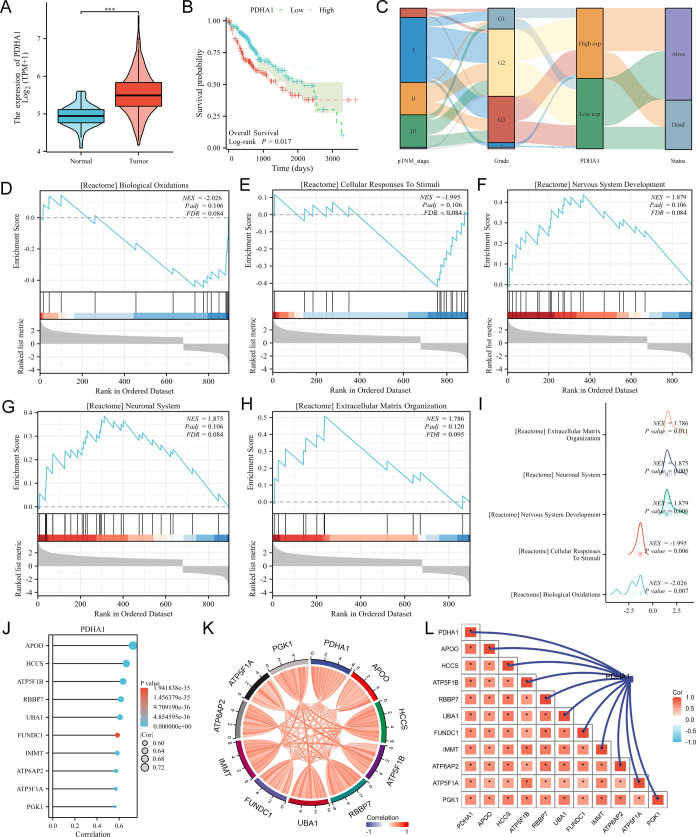
Since PDHA1 expression was significantly correlated with survival prognosis only in HCC, we further performed bioinformatic analysis of PDHA1 in HCC. The violin plot (Figure 2A) showed that PDHA1 expression was higher in HCC tissues than in normal tissues, and the Kaplan–Meier curve (Figure 2B) suggested that PHDA1’s high expression had a poor prognosis in HCC patients (log-rank P = 0.017). The Sankey diagram (Figure 2C) suggested that PDHA1’s high expression was linked to more advanced TNM stage and grade classification. We then identified all differentially expressed genes (DEGs) (P < 0.05, log2|FC|>1) between PDHA1 expression high and low groups and incorporated them for GSEA. The top 5 enriched terms were “biological oxidation”, “cellular response to stimuli”, “nervous system development”, “neuronal system”, and “extracellular matrix organization” (Figure 2D–H and Table S2), and the mountains map (Figure 2I) summarized all outcomes. Besides, we screened the top 10 genes that were most associated with PDHA1 expression in HCC, namely, APOO, HCCS, ATP5F1B, RBBP7, UBA1, FUNDC1, IMMT, ATP6AP2, ATP5F1A, and PGK1 (Figure 2J and Table S3). The chord diagram (Figure 2K) and the relevance network (Figure 2L) display their relationship.
Figure 2.
Bioinformatic analysis of PDHA1 in HCC. (A) Differential expression of PDHA1 in HCC visualized by the violin plot. (B) Survival analysis displayed by the Kaplan–Meier curves. (C) Association between PDHA1 expression and clinical stage in HCC exhibited by the Sanky diagram. (D–H) Top 5 terms enriched in the GSEA analysis for all DEGs between the PDHA1 high expression group and low expression group in HCC. (I) GSEA analysis outcome summarized by the mountains map. (J) Top 10 genes that were most associated with PDHA1 expression in HCC. Relationships between the 10 genes visualized by the chord diagram (K) and the relevance network (L).
3.3. Immune Cell Infiltration Score and Immune Checkpoint Correlation Analysis of PDHA in HCC
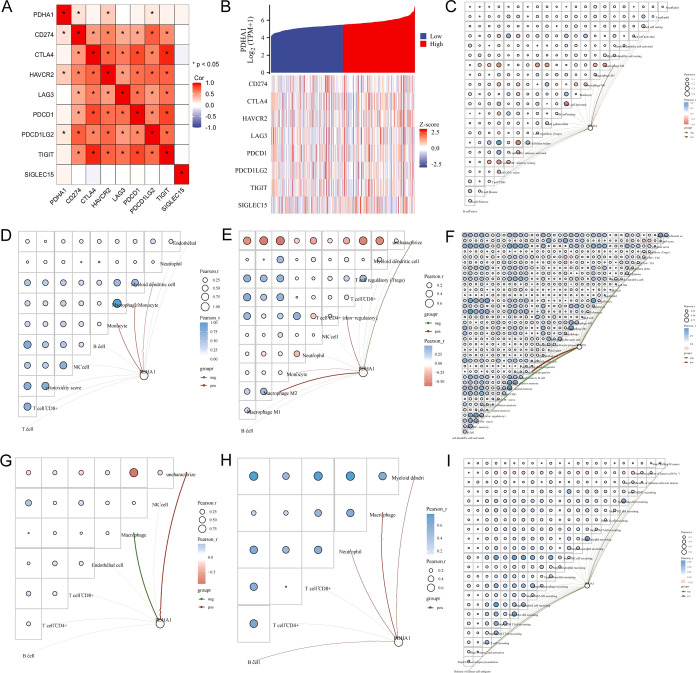
We next analyzed the relationship between PDHA1 expression and the expression of ICK-related genes and immune cell infiltration in HCC in detail. As shown in Figure 3A, PDHA1 expression was positively linked to the expression of CD274, HAVCR2, and PDCD1LG2. Figure 3B exhibits the trends in the expression levels of eight ICK-related genes in response to changes in PDHA1 expression levels. Furthermore, we utilized relevance networks to present the correlation of PDHA1 expression with immune cell infiltration levels and between different immune cell infiltrations in HCC. The CIBERSORT algorithm (Figure 3C) showed that PDHA1 expression was positively associated with M2 macrophage and negatively linked to CD8+ T cells. The MCPcounter algorithm (Figure 3D) revealed that PDHA1 expression was positively related to monocytes, macrophages, and dendrite cells. The QUANTISEQ algorithm (Figure 3E) exhibited that PDHA1 expression had a positive correlation with T cells, monocytes, and macrophages. The XCELL algorithm (Figure 3F) reflected that PDHA1 expression was positively linked to mast cells and lymphoid progenitors and negatively associated with naive CD8+ T cells and central memory CD4+ T cells. The EPIC algorithm (Figure 3G) manifested that PDHA1 expression was negatively connected with the macrophage. The TIMER algorithm (Figure 3H) indicated that PDHA1 expression was positively associated with CD4+ T cells, B cells, neutrophils, dendrite cells, and macrophages.
Figure 3.
Immune infiltration score and immune checkpoint correlation results. (A) Association between PDHA1 expression and the expression of important ICK-related genes. (B) Coexpression heatmap of PDHA1 and eight ICK-related genes. The association between PDHA1 expression and immune cell infiltration in HCC using the (C) CIBERSORT algorithm, (D) MCPcounter algorithm, (E) QUANTISEQ algorithm, (F) XCELL algorithm, (G) EPIC algorithm, and (H) TIMER algorithm. (I) Correlation between PDHA1 expression and immune cell infiltration in the cancer immune cycle using the TIP method.
The anticancer immune responses refer to a run of gradual events called the cancer immune cycle. Tumor immunophenotype (TIP) systematically integrates two existing methods, ssGSEA and CIBERSORT, for tracking and analyzing the proportion of tumor-infiltrating immune cells in the cancer immune cycle. As shown in Figure 3I, PDHA1 expression was negatively correlated with step2, step3, step 4, step5, and step7, and positively associated with step 1 and step 6. This suggested that PDHA1’s high expression mainly hindered the anticancer immune responses, which led to poor prognosis in patients with HCC.
3.4. Single-Cell RNA-Sequencing Analysis Reconfirmed that PDHA1 Was Connected with Immune Cell Infiltration in HCC
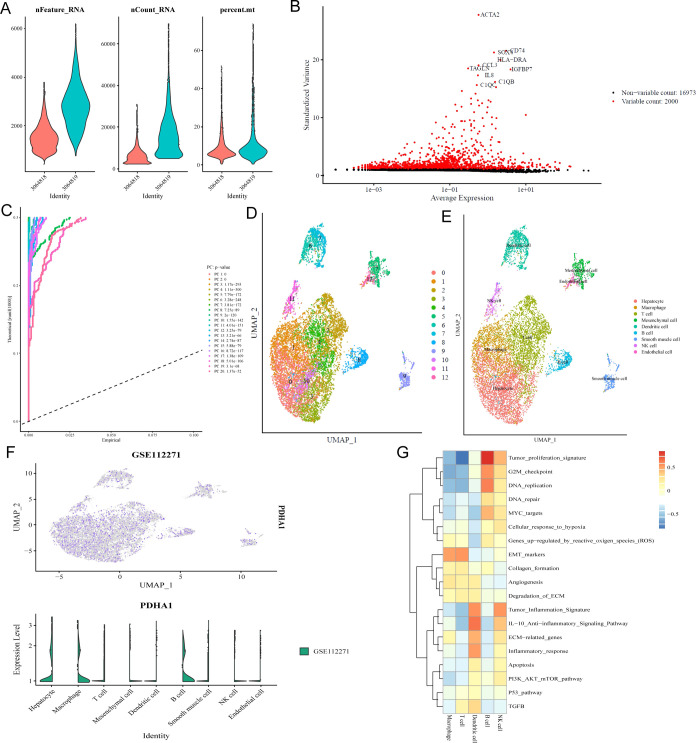
One scRNA-seq data set (GSE112271) was collected to further detect PDHA1 expression in the cells from HCC tissue samples. As shown in Figure 4A, we first filter away poor-quality cells according to the number of genes detected in each cell (nFeature_RNA), the total amount of mRNA found in the cell (nCount_RNA), and the percentage of mitochondrial gene expression in the cell (percent_mt). After the top 2000 HVGs were screened for cell clustering (Figure 4B), we utilized PCA to identify 20 PCs with significant differences (Figure 4C). Thirteen clusters (each cluster having similar gene expression patterns) were identified (Figure 4D). We then annotated the 13 clusters into hepatocytes (clusters 0, 3, and 10), macrophages (cluster 1), T cells (clusters 2, 4), mesenchymal cells (cluster 5), dendrite cells (clusters 6, 7), B cells (cluster 8), smooth muscle cells (cluster 9), NK cells (cluster 11), and endothelial cells (cluster 12), according to the expression of the corresponding canonical marker genes (Figure 4E). Notably, almost only hepatocytes, macrophages, and B cells expressed PDHA1 (Figure 4F), which agreed with the positive correlation between PDHA1 expression and the infiltration levels of macrophages and B cells. Interestingly, we found that the top 3 enriched pathways were “tumor proliferation signature”, “DNA repair”, and “G2M checkpoint” in macrophages and “EMT markers”, “G2M checkpoint”, and “tumor proliferation signature” (Figure 4G), which were all associated with tumor proliferation and metastasis.
Figure 4.
Single-cell analysis for PDHA1 in GSE112271. (A) Quality control of cells. (B) HVGs for cell clustering. (C) Top 20 PCs identified based on P value <0.05. (D) Different cell clusters visualized by UMAP reduction. (E) Corresponding annotation of the cell clusters. (F) PDHA1 expression in different cell clusters. (G) Pathways highly enriched in different immune cell clusters.
3.5. IHC Validation for Differential Expression of PDHA1 between HCC Tissues and Normal Tissues
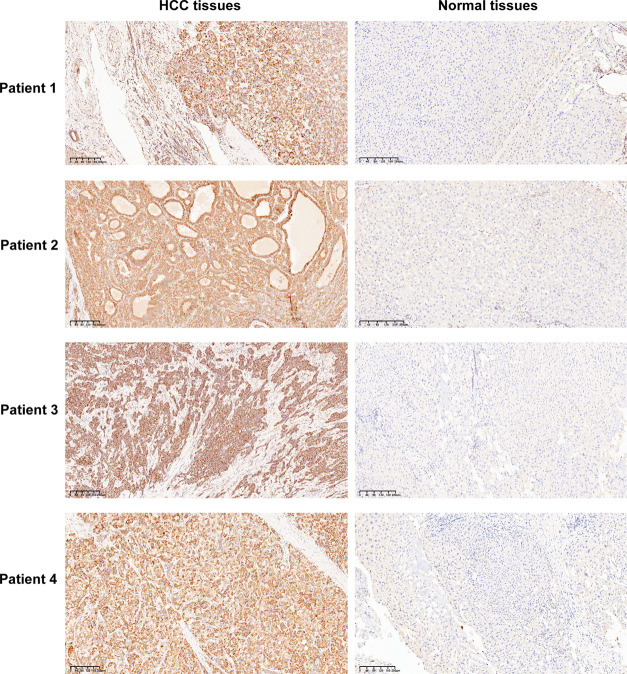
To verify PDHA1 overexpression in HCC tissues from the protein level, we used the ICH technique to stain the pathological sections of clinical HCC patients. The IHC results indicated that the PDHA1 protein was mainly present in the cytoplasm and cell membrane. In 30 normal tissue samples, 18 cases showed negative PDHA1 expression and 12 cases had low PDHA1 expression. In 30 HCC tissue samples, 22 cases displayed high PDHA1 expression and 8 cases had low PDHA1 expression. Figure 5 presents four representative HCC tissue samples with high PDHA1 expression and the corresponding normal tissue samples.
Figure 5.
Four representative HCC tissue samples with high PDHA1 expression and the corresponding normal tissue samples.
3.6. Prognostic and Risk Stratification Value of PDHA1 in HCC
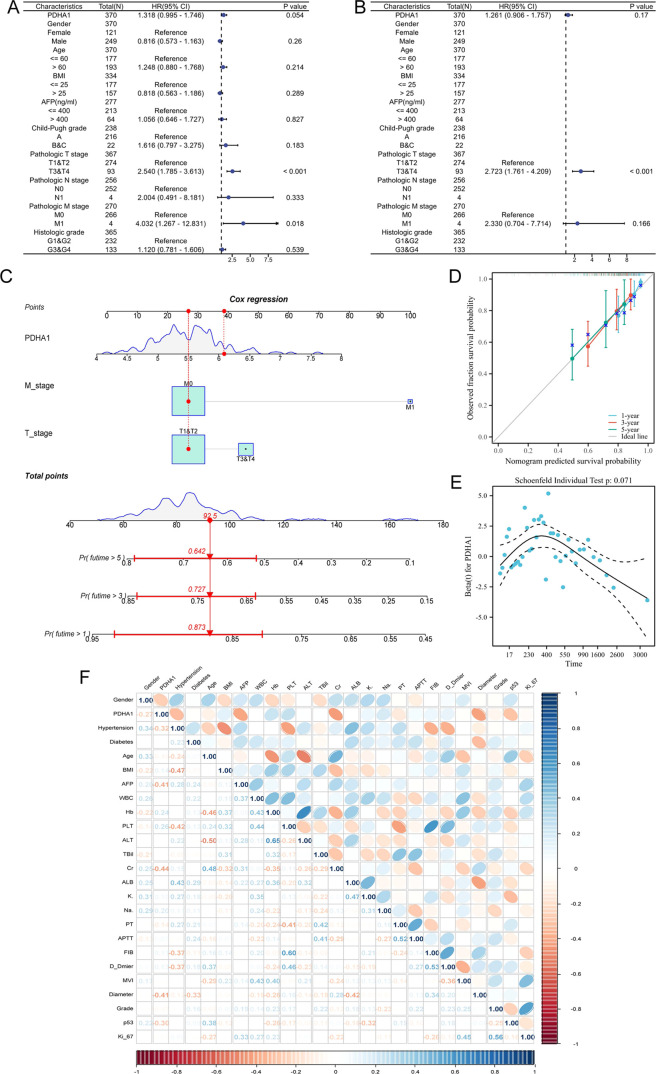
To determine the independent risk indicators affecting the prognosis of HCC patients, PDHA1 expression and clinical features were incorporated in univariate and multivariate Cox regression analyses. The univariate Cox regression analysis (Figure 6A) revealed that PDHA1 expression, tumor diameter, and distant metastasis were significantly associated with the prognosis of HCC patients. The multivariate Cox regression analysis (Figure 6B) indicated that only tumor diameter remained significantly correlated to the prognosis of HCC patients. To enhance the clinical application value of the model, all indicators in the multivariate Cox regression model were incorporated to create the nomogram (Figure 6C). The calibration curve (Figure 6D) demonstrated that the nomogram displayed an excellent predictive capacity at 1 year, 3 years, and 5 years. In addition, Figure 6E shows the Cox regression coefficients of PDHA1 at different survival times, and the coefficient values are clustered. They did not change remarkably over time, indicating that the variable satisfied the proportional risk assumption.
Figure 6.
Prognostic and risk stratification values of PDHA1 in HCC. Screening of independent prognostic factors using univariate Cox regression analysis (A) and multivariate Cox regression analysis (B). (C) Nomogram construction based on the multivariate Cox regression model. (D) Calibration curve of the nomogram. (E) Hazard proportion curve of PDHA1. (F) Correlation heatmap exhibiting the relevance of prognostic variables in Table 1.
Furthermore, we explored the association between the PDHA1 expression detected by IHC and clinicopathological features in HCC patients from our hospital. When it comes to prognostic factors in patients with HCC (Table 1), high PDHA1 expression was significantly associated with a higher AFP level (20.25 [5.35,99.73] ng/mL, P = 0.0270), higher creatinine level (89.60 [77.03, 108.85] μmol/L, P = 0.0160), bigger tumor diameter (3.51 ± 1.57 cm, P = 0.0401), and higher p53 mutant rate (28.57%, P = 0.0288). Besides, high PDHA1 expression was linked to a lower Hb level (7133.96 ± 15.24 g/L, P = 0.1040) and higher Ki-67 positive incidence (P = 0.1650), even though these correlations did not achieve statistical significance. In addition, the correlation heatmap (Figure 6F) showed the relevance of the prognostic variables mentioned above (including PDHA1 expression). Taken together, high PDHA1 expression was strongly associated with poor prognostic factors in HCC patients, which can be used for risk stratification.
Table 1. Associations between PDHA1 Expression and Clinicopathological Characteristics in HCC Patientsa.
| variables | PDHA1 low | PDHA1 high | P value |
|---|---|---|---|
| gender, n (%) | 0.2868 | ||
| female | 0 (0%) | 5 (22.73%) | |
| male | 8 (100%) | 17 (77.27%) | |
| age (years) | 64.50 ± 10.39 | 65.68 ± 8.47 | 0.7525 |
| BMI (kg/m2) | 24.95 ± 1.96 | 23.93 ± 3.18 | 0.4056 |
| hypertension, n (%) | 0.1040 | ||
| yes | 5 (62.50%) | 6 (27.27%) | |
| no | 3 (37.50%) | 16 (72.73%) | |
| diabetes, n (%) | >0.9999 | ||
| yes | 2 (33.33%) | 5 (22.73%) | |
| no | 6 (66.67%) | 17 (77.27%) | |
| AFP (ng/mL) | 3.20 (1.53, 23.83) | 20.25 (5.35, 99.73) | 0.0270 |
| WBC (×109/L) | 4.78 ± 1.20 | 4.82 ± 1.63 | 0.9460 |
| Hb (g/L) | 145.63 ± 17.60 | 133.96 ± 15.24 | 0.0856 |
| PLT (×109/L) | 166.75 ± 58.08 | 148.23 ± 57.31 | 0.4418 |
| ALT (U/L) | 29.63 ± 24.37 | 30.55 ± 28.08 | 0.9353 |
| TBil (μmol/L) | 13.16 ± 5.11 | 13.16 ± 5.91 | 0.9989 |
| creatinine (μmol/L) | 74.70 (67.68, 87.20) | 89.60 (77.03, 108.85) | 0.0160 |
| albumin (g/L) | 40.59 ± 4.03 | 40.65 ± 2.90 | 0.9629 |
| K+ (mmol/L) | 3.91 ± 0.32 | 3.84 ± 0.45 | 0.6848 |
| Na+ (mmol/L) | 142.00 (140.45, 143.70) | 141.10 (139.85, 142.13) | 0.3032 |
| PT (s) | 12.05 ± 0.91 | 12.28 ± 0.89 | 0.5434 |
| APTT (s) | 26.75 (25.68, 32.23) | 26.80 (25.88, 28.25) | 0.7042 |
| FIB (g/L) | 2.81 ± 0.67 | 2.60 ± 0.92 | 0.5622 |
| D-dmier (mg/L) | 0.38 (0.17, 2.20) | 0.30 (0.19, 0.41) | 0.5111 |
| tumor diameter (cm) | 2.24 ± 0.94 | 3.51 ± 1.57 | 0.0401 |
| grade, n (%) | >0.9999 | ||
| 1 and 2 | 5 (62.50%) | 12 (54.55%) | |
| 3 and 4 | 3 (37.50%) | 10 (45.45%) | |
| MVI, n (%) | 0.8266 | ||
| M0 | 6 (75%) | 16 (72.73%) | |
| M1 | 2 (25%) | 5 (22.72%) | |
| M2 | 0 (0%) | 1 (0.05%) | |
| p53, n (%) | 0.0288 | ||
| wild-type | 8 (100%) | 12 (54.55%) | |
| mutant | 0 (0%) | 10 (45.45%) | |
| Ki-67(+), n (%) | 0.1650 | ||
| <15% | 4 (50%) | 4 (18.18%) | |
| 15–30% | 2 (25%) | 13 (59.09%) | |
| >30% | 2 (25%) | 5 (22.73%) |
BMI, body mass index; AFP, α-fetoprotein;WBC, white blood cell; Hb, hemoglobin; PLT, platelet; ALT, alanine aminotransferase; TBil, total bilirubin; PT, prothrombin time; APTT, activated partial thromboplastin time; FIB, fibrinogen; MVI, microvascular invasion.
3.7. Drug Sensitivity and Molecular Docking Analysis of PDHA1
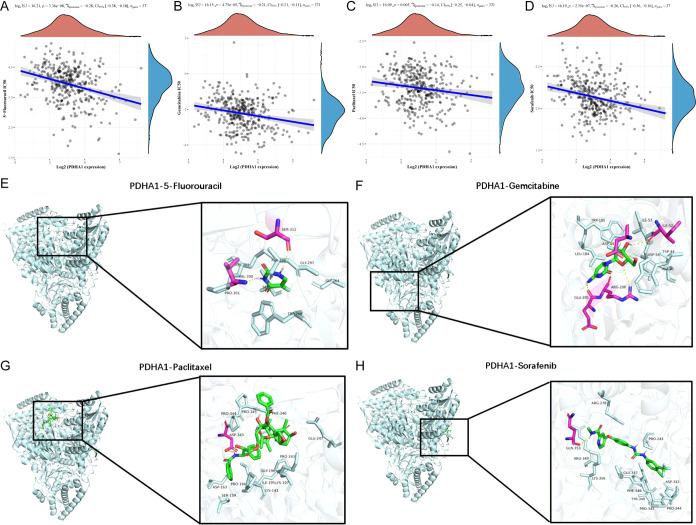
To investigate the potential function of PDHA1 in the chemotherapy of HCC patients, we evaluated the IC50 of four chemotherapeutic agents using drug sensitivity and gene expression profiling data. The Spearman correlation analysis indicated that PDHA1 expression had a negative correlation with IC50 values of 5-fluorouracil (P = 3.36 × 10⁻⁸, ρSpearman = −0.28; Figure 7A), gemcitabine (P = 4.75 × 10⁻⁵, ρSpearman = −0.21; Figure 7B), paclitaxel (P = 0.005, ρSpearman = −0.14; Figure 7C), sorafenib (P = 2.35 × 10⁻⁷, ρSpearman = −0.26; Figure 7D).
Figure 7.
Drug sensitivity and molecular simulation results. Association between PDHA1 expression and IC50 values of 5-fluorouracil (A), gemcitabine (B), paclitaxel (C), and sorafenib (D), respectively. Molecular docking simulation outcomes of PDHA1-5-fluorouracil complex (E), PDHA1-gemcitabine complex (F), PDHA1-paclitaxel complex (G), and PDHA1-sorafenib complex (H).
Given the strong link observed between PDHA1 expression and drug sensitivity of the four agents, we further performed molecular docking analysis to measure the binding energy and binding favorability. The outcomes manifested that the binding free energy of PDHA1-5-fluorouracil complex (Figure 7E), PDHA1-gemcitabine complex (Figure 7F), PDHA1-paclitaxel complex (Figure 7G), and PDHA1-sorafenib complex (Figure 7H) were −5.8, −6.4, −7.4, and −8.7 kcal/mol, respectively.
4. Discussion
HCC is a high-grade malignant tumor exhibiting metabolic heterogeneity.3 Despite the joint multidisciplinary diagnosis and treatment methods, including surgery, radical hepatectomy, targeted therapy, and immunotherapy, the OS of advanced HCC remains relatively low.29,30 Hence, an innovative biomarker for prognosis prediction, risk stratification, and therapeutic targets for HCC patients is urgently needed. PDHA1 is a nuclear-encoded mitochondrial enzyme that primarily links glycolysis and the TCA cycle. Previous evidence demonstrated that PDHA1 was involved in diverse metabolism-related signaling pathways in human diseases including cancer.31−33 However, the clinical significance and specific roles of PDHA1 in tumorigenesis and progression in HCC have yet to be fully illuminated. Therefore, our research evaluated PDHA1’s value in prognosis prediction, immune infiltration, and drug sensitivity in HCC using independent multiple clinical cohorts.
We first performed digestive system pan-cancer analysis of PDHA1. PDHA1 had a significant differential expression in most digestive system cancers, including CHOL, COAD, LIHC, READ, and STAD, but was only correlated with prognosis in LIHC. Indeed, many prognostic gene signatures containing PDHA1 for HCC have been constructed. For example, Zhou et al.34 established a cuproptosis-related genes signature consisting of CDKN2A, DLAT, DLST, GLS, and PDHA1 that forecasted the OS of HCC patients with moderate to high accuracy. Furthermore, we investigated the immune landscape of PDHA1 in the digestive system pan-cancer. We found that PDHA1 expression was mainly associated with B cells and T cells in most digestive system cancers and was correlated with at least one ICK-related gene expression in all digestive system malignancies. These findings suggested that PDHA1 might take part in the regulation of the tumor’s immunological microenvironment and had the potential as a biomarker for predicting response to immunotherapy in digestive pan-cancer.
Next, we carried out a bioinformatic analysis of PDHA1 in HCC in detail. DEGs between PDHA1 high and low expression groups were mainly enriched in “biological oxidation”, “cellular response to stimuli”, “nervous system development”, “neuronal system”, and ″extracellular matrix organization” according to GSEA analysis. We found that PDHA1 expression was positively linked to the expression of CD274, CTLA4, LAG3, PDCD1, PDCD1LG2, and SIGLEC15 and might be associated with diverse immune cell infiltration including CD4+ T cells, CD8+ T cells, B cells, neutrophils, monocytes, macrophages, and dendrite cells according to six latest algorithms. In addition, PDHA1 expression was negatively linked to steps 2, 3, 4, 5, and 7 in anticancer immune responses based on TIP analysis, suggesting that PDHA1’s high expression mainly hindered the anticancer immune responses, which led to HCC patients’ poor prognosis. Prior research has also demonstrated that PDHA1 expression negatively correlated with cancer-associated fibroblasts, dendritic cells, B cells, and T cells in diverse cancers.35 Furthermore, single-cell analysis reconfirmed that PDHA1 expression was associated with the infiltration levels of macrophages and B cells. The highly enriched pathways in macrophages and B cells were “tumor proliferation signature”, “DNA repair”, “G2M checkpoint”, and “EMT markers”, which were all correlated with cell proliferation. These findings were consistent with the results of previous experiments. For instance, Tian et al.36 discovered that PDHA1 silencing remarkably inhibited the proliferation, migration, and invasion, which in turn enhanced cell cycle arrest at the S phase and apoptosis of neuroblastoma cells. Another study also demonstrated that the circRBM33-FMR1 complex could stimulate mitochondrial metabolism by stabilizing PDHA1 mRNA, facilitating the growth and invasion of prostate cancer.16 Taken together, these data suggest that PDHA1 could be an immune-associated biomarker in many human cancers. However, the underlying mechanism of PDHA1 in shaping the tumor microenvironment needs further research.
To further explore the clinical value of PDHA1 in HCC, we collected 30 HCC tissue samples from our hospital. PDHA1 overexpression in HCC tissues was validated by IHC. We discovered that PDHA1 was an independent prognostic indicator in HCC based on TCGA cohort data. We also constructed a nomogram with a relatively excellent predictive efficacy for clinical application. In addition, we ascertained that PDHA1’s high expression was significantly linked to many poor prognostic indicators, including higher AFP level, higher creatinine level, bigger tumor diameter, and higher p53 mutant rate in HCC. It is worth noting that p53 is a tumor suppressor gene that controls cell cycle initiation, and its mutation indicates that cancer cells are highly proliferative and malignant.37 We also discovered that PDHA1 expression was negatively associated with the IC50 of four chemotherapeutic agents, namely, 5-fluorouracil, gemcitabine, paclitaxel, and sorafenib. The molecular docking outcomes suggested that the four drugs probably bound tightly to PDHA1 protein. These data indicated that PDHA1 was a promising therapeutic target for HCC.
PDHA1 may play different roles in different types of cancers. Several studies revealed that PDHA1 promoted the tumorigenesis and progression of cholangiocarcinoma,38 lymphoma,39 and renal cell carcinoma,40 whereas it presented an opposite function in esophageal squamous cancer,41 cervical cancer,16 and nonsmall cell lung cancer.42 Recent research has indicated that cell metabolism regulated by PDHA1 is crucial for cancer advancement and metastasis.43 PDHA1 was recognized as a regulator of the reactive oxygen species (ROS)-driven adipogenic program in pancreatic cancer.44 Islam et al.45 proposed that insulin-mediated phosphorylation of PDHA1 controlled the growth of HepG2 cells. PDHA1 was also the crucial gene of cuproptosis (copper-induced cell death),46 a novel cell death involved in the progression of tumors by regulating copper metabolism. However, the detailed role of PDHA1 in HCC metabolism and the corresponding mechanisms are still largely dismal. The pathway enrichment outcomes in our research may provide some hints for future research on the role and mechanism of PDHA1 in HCC metabolism.
Nevertheless, this study still has some limitations. Data from the TCGA database and our hospital were collected retrospectively and the number of clinical samples from our hospital was insufficient. Furthermore, complementary in vivo and in vitro experiments are necessary to illuminate the molecular mechanisms behind PDHA1’s function in the development of HCC.
5. Conclusions
Our study detected the RNA and protein levels of PDHA1 in HCC patients, revealed its associations with the clinicopathological characteristics of HCC patients, and identified PDHA1 as an independent prognostic indicator for HCC patients. The bulk and single-cell RNA sequencing manifested that PDHA1 expression was mainly positively linked to the expression of ICK-related genes and immune cell infiltrations in HCC using the six latest algorithms. We also evaluated the potential of PDHA1 as a chemotherapeutic target. Our multi-omics analyses integrating genomics, bulk RNA sequencing, and single-cell RNA sequencing revealed the value of PDHA1 for predicting prognosis, immune cell infiltration, immunotherapy efficacy, and drug sensitivity in HCC, which facilitated clinical decision-making and a therapeutic strategy of HCC.
Acknowledgments
The authors thank the investigators and patients in the TCGA and GEO databases for providing the data.
Data Availability Statement
The public data sets used in this study are available in the TCGA database (http://portal.gdc.cancer.com/) and GEO database (https://www.ncbi.nlm.nih.gov/geo/).
Supporting Information Available
The Supporting Information is available free of charge at https://pubs.acs.org/doi/10.1021/acsomega.4c08010.
Baseline characteristics of the patients in TCGA cohort; detailed information of enriched terms by GSEA; P value and correlation coefficient of the top 10 genes most associated with PDHA1 expression in HCC. (PDF)
Author Contributions
Y.P. and Y.Z. initiated the study and organized it; Y.P., D.M., Z.F., and Y.M. designed and carried out bioinformatics analyses, and statistical analyses, and drew figures; Y.P. drafted the manuscript; D.J. completed the immunohistochemical experiment. S.L. contributed to the review and editing. All authors have read and agreed to the published version of the manuscript.
This study was supported by the Zhejiang Provincial Administration of Traditional Chinese Medicine Science and Technology Project (GZY-ZJ-KJ-24100) and Zhejiang Province Major Science and Technology Project for Medicine and Health (WKJ-ZJ-2329).
The authors declare no competing financial interest.
Notes
The work involving the tissue specimens was reviewed and approved by the Ethics Committee of Wenzhou Medical University Affiliated Zhoushan Hospital.
Supplementary Material
References
- Bray F.; Ferlay J.; Soerjomataram I.; Siegel R. L.; Torre L. A.; Jemal A. Global cancer statistics 2018: GLOBOCAN estimates of incidence and mortality worldwide for 36 cancers in 185 countries. CA, Cancer J. Clin. 2018, 68 (6), 394–424. 10.3322/caac.21492. [DOI] [PubMed] [Google Scholar]
- Sung H.; Ferlay J.; Siegel R. L.; Laversanne M.; Soerjomataram I.; Jemal A.; Bray F. Global Cancer Statistics 2020: GLOBOCAN Estimates of Incidence and Mortality Worldwide for 36 Cancers in 185 Countries. CA, Cancer J. Clin. 2021, 71 (3), 209–249. 10.3322/caac.21660. [DOI] [PubMed] [Google Scholar]
- Llovet J. M.; Kelley R. K.; Villanueva A.; Singal A. G.; Pikarsky E.; Roayaie S.; Lencioni R.; Koike K.; Zucman-Rossi J.; Finn R. S. Hepatocellular carcinoma. Nat. Rev. Dis. Primers 2021, 7 (1), 6. 10.1038/s41572-020-00240-3. [DOI] [PubMed] [Google Scholar]
- Pisano M. B.; Giadans C. G.; Flichman D. M.; Ré V. E.; Preciado M. V.; Valva P. Viral hepatitis update: Progress and perspectives. World J. Gastroenterol. 2021, 27 (26), 4018–4044. 10.3748/wjg.v27.i26.4018. [DOI] [PMC free article] [PubMed] [Google Scholar]
- Takeda H.; Takai A.; Eso Y.; Takahashi K.; Marusawa H.; Seno H. Genetic Landscape of Multistep Hepatocarcinogenesis. Cancers 2022, 14 (3), 568. 10.3390/cancers14030568. [DOI] [PMC free article] [PubMed] [Google Scholar]
- Taki M.; Abiko K.; Ukita M.; Murakami R.; Yamanoi K.; Yamaguchi K.; Hamanishi J.; Baba T.; Matsumura N.; Mandai M. Tumor Immune Microenvironment during Epithelial-Mesenchymal Transition. Clin. Cancer Res. 2021, 27 (17), 4669–4679. 10.1158/1078-0432.CCR-20-4459. [DOI] [PubMed] [Google Scholar]
- Bao M.-R.; Wong C. C. Hypoxia, Metabolic Reprogramming, and Drug Resistance in Liver Cancer. Cells 2021, 10 (7), 1715. 10.3390/cells10071715. [DOI] [PMC free article] [PubMed] [Google Scholar]
- Li X.; Ramadori P.; Pfister D.; Seehawer M.; Zender L.; Heikenwalder M. The immunological and metabolic landscape in primary and metastatic liver cancer. Nat. Rev. Cancer 2021, 21 (9), 541–557. 10.1038/s41568-021-00383-9. [DOI] [PubMed] [Google Scholar]
- Feng J.; Li J.; Wu L.; Yu Q.; Ji J.; Wu J.; Dai W.; Guo C. Emerging roles and the regulation of aerobic glycolysis in hepatocellular carcinoma. J. Exp. Clin. Cancer Res. 2020, 39 (1), 126. 10.1186/s13046-020-01629-4. [DOI] [PMC free article] [PubMed] [Google Scholar]
- Hu B.; Lin J. Z.; Yang X. B.; Sang X. T. Aberrant lipid metabolism in hepatocellular carcinoma cells as well as immune microenvironment: A review. Cell Prolif. 2020, 53 (3), e12772 10.1111/cpr.12772. [DOI] [PMC free article] [PubMed] [Google Scholar]
- Chiu M.; Tardito S.; Pillozzi S.; Arcangeli A.; Armento A.; Uggeri J.; Missale G.; Bianchi M. G.; Barilli A.; Dall’Asta V.; Campanini N.; Silini E. M.; Fuchs J.; Armeanu-Ebinger S.; Bussolati O. Glutamine depletion by crisantaspase hinders the growth of human hepatocellular carcinoma xenografts. Br. J. Cancer 2014, 111 (6), 1159–1167. 10.1038/bjc.2014.425. [DOI] [PMC free article] [PubMed] [Google Scholar]
- Liu Y. X.; Feng J. Y.; Sun M. M.; Liu B. W.; Yang G.; Bu Y. N.; Zhao M.; Wang T. J.; Zhang W. Y.; Yuan H. F.; Zhang X. D. Aspirin inhibits the proliferation of hepatoma cells through controlling GLUT1-mediated glucose metabolism. Acta Pharmacol. Sin. 2019, 40 (1), 122–132. 10.1038/s41401-018-0014-x. [DOI] [PMC free article] [PubMed] [Google Scholar]
- Ma M. K. F.; Lau E. Y. T.; Leung D. H. W.; Lo J.; Ho N. P. Y.; Cheng L. K. W.; Ma S.; Lin C. H.; Copland J. A.; Ding J.; Lo R. C. L.; Ng I. O. L.; Lee T. K. W. Stearoyl-CoA desaturase regulates sorafenib resistance via modulation of ER stress-induced differentiation. J. Hepatol. 2017, 67 (5), 979–990. 10.1016/j.jhep.2017.06.015. [DOI] [PubMed] [Google Scholar]
- Abdelmonsif D. A.; Sultan A. S.; El-Hadidy W. F.; Abdallah D. M. Targeting AMPK, mTOR and β-Catenin by Combined Metformin and Aspirin Therapy in HCC: An Appraisal in Egyptian HCC Patients. Mol. Diagn. Ther. 2018, 22 (1), 115–127. 10.1007/s40291-017-0307-7. [DOI] [PubMed] [Google Scholar]
- Liu N.; Yan M.; Tao Q.; Wu J.; Chen J.; Chen X.; Peng C. Inhibition of TCA cycle improves the anti-PD-1 immunotherapy efficacy in melanoma cells via ATF3-mediated PD-L1 expression and glycolysis. J. Immunother. Cancer 2023, 11 (9), e007146 10.1136/jitc-2023-007146. [DOI] [PMC free article] [PubMed] [Google Scholar]
- Zhong C.; Long Z.; Yang T.; Wang S.; Zhong W.; Hu F.; Teoh J. Y.; Lu J.; Mao X. M6A-modified circRBM33 promotes prostate cancer progression via PDHA1-mediated mitochondrial respiration regulation and presents a potential target for ARSI therapy. Int. J. Biol. Sci. 2023, 19 (5), 1543–1563. 10.7150/ijbs.77133. [DOI] [PMC free article] [PubMed] [Google Scholar]
- Zhao L.; Geng R.; Huang Y.; Zhang J.; Cheng H.; Zhou C.; Wang Y. AP2α negatively regulates PDHA1 in cervical cancer cells to promote aggressive features and aerobic glycolysis in vitro and in vivo. J. Gynecol. Oncol. 2023, 34 (5), e59 10.3802/jgo.2023.34.e59. [DOI] [PMC free article] [PubMed] [Google Scholar]
- Sun J.; Li J.; Guo Z.; Sun L.; Juan C.; Zhou Y.; Gu H.; Yu Y.; Hu Q.; Kan Q.; Yu Z. Overexpression of Pyruvate Dehydrogenase E1α Subunit Inhibits Warburg Effect and Induces Cell Apoptosis Through Mitochondria-Mediated Pathway in Hepatocellular Carcinoma. Oncol. Res. 2019, 27 (4), 407–414. 10.3727/096504018X15180451872087. [DOI] [PMC free article] [PubMed] [Google Scholar]
- Hossain A. J.; Islam R.; Seo J. B.; Park H. S.; Kim J. I.; Kumar V.; Lee K. W.; Park J. B. Association of Phosphorylated Pyruvate Dehydrogenase with Pyruvate Kinase M2 Promotes PKM2 Stability in Response to Insulin. Int. J. Mol. Sci. 2023, 24 (18), 13697. 10.3390/ijms241813697. [DOI] [PMC free article] [PubMed] [Google Scholar]
- He X.; Xu C. Immune checkpoint signaling and cancer immunotherapy. Cell Res. 2020, 30 (8), 660–669. 10.1038/s41422-020-0343-4. [DOI] [PMC free article] [PubMed] [Google Scholar]
- Subramanian A.; Tamayo P.; Mootha V. K.; Mukherjee S.; Ebert B. L.; Gillette M. A.; Paulovich A.; Pomeroy S. L.; Golub T. R.; Lander E. S.; Mesirov J. P. Gene set enrichment analysis: a knowledge-based approach for interpreting genome-wide expression profiles. Proc. Natl. Acad. Sci. U.S.A. 2005, 102 (43), 15545–15550. 10.1073/pnas.0506580102. [DOI] [PMC free article] [PubMed] [Google Scholar]
- Yu G.; Wang L.; Han Y.; He Q. clusterProfiler: An R package for comparing biological themes among gene clusters. Omics 2012, 16, 284–287. 10.1089/omi.2011.0118. [DOI] [PMC free article] [PubMed] [Google Scholar]
- Liberzon A.; Subramanian A.; Pinchback R.; Thorvaldsdóttir H.; Tamayo P.; Mesirov J. P. Molecular signatures database (MSigDB) 3.0. Bioinformatics 2011, 27 (12), 1739–1740. 10.1093/bioinformatics/btr260. [DOI] [PMC free article] [PubMed] [Google Scholar]
- Losic B.; Craig A. J.; Villacorta-Martin C.; Martins-Filho S. N.; Akers N.; Chen X.; Ahsen M. E.; von Felden J.; Labgaa I.; D′Avola D.; Allette K.; Lira S. A.; Furtado G. C.; Garcia-Lezana T.; Restrepo P.; Stueck A.; Ward S. C.; Fiel M. I.; Hiotis S. P.; Gunasekaran G.; Sia D.; Schadt E. E.; Sebra R.; Schwartz M.; Llovet J. M.; Thung S.; Stolovitzky G.; Villanueva A. Intratumoral heterogeneity and clonal evolution in liver cancer. Nat. Commun. 2020, 11 (1), 291 10.1038/s41467-019-14050-z. [DOI] [PMC free article] [PubMed] [Google Scholar]
- Hänzelmann S.; Castelo R.; Guinney J. GSVA: gene set variation analysis for microarray and RNA-seq data. BMC Bioinf. 2013, 14, 7. 10.1186/1471-2105-14-7. [DOI] [PMC free article] [PubMed] [Google Scholar]
- Yang W.; Soares J.; Greninger P.; Edelman E. J.; Lightfoot H.; Forbes S.; Bindal N.; Beare D.; Smith J. A.; Thompson I. R.; Ramaswamy S.; Futreal P. A.; Haber D. A.; Stratton M. R.; Benes C.; McDermott U.; Garnett M. J. Genomics of Drug Sensitivity in Cancer (GDSC): a resource for therapeutic biomarker discovery in cancer cells. Nucleic Acids Res. 2012, 41, D955–D961. 10.1093/nar/gks1111. [DOI] [PMC free article] [PubMed] [Google Scholar]
- Geeleher P.; Cox N.; Huang R. S. pRRophetic: an R package for prediction of clinical chemotherapeutic response from tumor gene expression levels. PLoS One 2014, 9, e107468 10.1371/journal.pone.0107468. [DOI] [PMC free article] [PubMed] [Google Scholar]
- Trott O.; Olson A. J. AutoDock Vina: improving the speed and accuracy of docking with a new scoring function, efficient optimization, and multithreading. J. Comput. Chem. 2010, 31, 455–461. 10.1002/jcc.21334. [DOI] [PMC free article] [PubMed] [Google Scholar]
- Reig M.; Forner A.; Rimola J.; Ferrer-Fàbrega J.; Burrel M.; Garcia-Criado Á.; Kelley R. K.; Galle P. R.; Mazzaferro V.; Salem R.; Sangro B.; Singal A. G.; Vogel A.; Fuster J.; Ayuso C.; Bruix J. BCLC strategy for prognosis prediction and treatment recommendation: The 2022 update. J. Hepatol. 2022, 76 (3), 681–693. 10.1016/j.jhep.2021.11.018. [DOI] [PMC free article] [PubMed] [Google Scholar]
- Vogel A.; Meyer T.; Sapisochin G.; Salem R.; Saborowski A. Hepatocellular carcinoma. Lancet 2022, 400 (10360), 1345–1362. 10.1016/S0140-6736(22)01200-4. [DOI] [PubMed] [Google Scholar]
- An S.; Yao Y.; Hu H.; Wu J.; Li J.; Li L.; Wu J.; Sun M.; Deng Z.; Zhang Y.; Gong S.; Huang Q.; Chen Z.; Zeng Z. PDHA1 hyperacetylation-mediated lactate overproduction promotes sepsis-induced acute kidney injury via Fis1 lactylation. Cell Death Dis. 2023, 14 (7), 457. 10.1038/s41419-023-05952-4. [DOI] [PMC free article] [PubMed] [Google Scholar]
- Wang C. H.; Lu W. L.; Chiang S. L.; Tsai T. H.; Liu S. C.; Hsieh C. H.; Su P. H.; Huang C. Y.; Tsai F. J.; Lin Y. J.; Huang Y. N. T Cells Mediate Kidney Tubular Injury via Impaired PDHA1 and Autophagy in Type 1 Diabetes. J. Clin. Endocrinol. Metab. 2022, 107 (9), 2556–2570. 10.1210/clinem/dgac378. [DOI] [PubMed] [Google Scholar]
- Mouton A. J.; Aitken N. M.; Moak S. P.; do Carmo J. M.; da Silva A. A.; Omoto A. C. M.; Li X.; Wang Z.; Schrimpe-Rutledge A. C.; Codreanu S. G.; Sherrod S. D.; McLean J. A.; Hall J. E. Temporal changes in glucose metabolism reflect polarization in resident and monocyte-derived macrophages after myocardial infarction. Front. Cardiovasc. Med. 2023, 10, 1136252 10.3389/fcvm.2023.1136252. [DOI] [PMC free article] [PubMed] [Google Scholar]
- Zhou Z.; Zhou Y.; Liu D.; Yang Q.; Tang M.; Liu W. Prognostic and immune correlation evaluation of a novel cuproptosis-related genes signature in hepatocellular carcinoma. Front. Pharmacol. 2022, 13, 1074123 10.3389/fphar.2022.1074123. [DOI] [PMC free article] [PubMed] [Google Scholar]
- Deng L.; Jiang A.; Zeng H.; Peng X.; Song L. Comprehensive analyses of PDHA1 that serves as a predictive biomarker for immunotherapy response in cancer. Front. Pharmacol. 2022, 13, 947372 10.3389/fphar.2022.947372. [DOI] [PMC free article] [PubMed] [Google Scholar]
- Tian X. M.; Xiang B.; Yu Y. H.; Li Q.; Zhang Z. X.; Zhanghuang C.; Jin L. M.; Wang J. K.; Mi T.; Chen M. L.; Liu F.; Wei G. H. A novel cuproptosis-related subtypes and gene signature associates with immunophenotype and predicts prognosis accurately in neuroblastoma. Front. Immunol. 2022, 13, 999849 10.3389/fimmu.2022.999849. [DOI] [PMC free article] [PubMed] [Google Scholar]
- Kastenhuber E. R.; Lowe S. W. Putting p53 in Context. Cell 2017, 170 (6), 1062–1078. 10.1016/j.cell.2017.08.028. [DOI] [PMC free article] [PubMed] [Google Scholar]
- Dan Li; Wang C.; Ma P.; Yu Q.; Gu M.; Dong L.; Jiang W.; Pan S.; Xie C.; Han J.; Lan Y.; Sun J.; Sheng P.; Liu K.; Wu Y.; Liu L.; Ma Y.; Jiang H. PGC1α promotes cholangiocarcinoma metastasis by upregulating PDHA1 and MPC1 expression to reverse the Warburg effect. Cell Death Dis. 2018, 9 (5), 466. 10.1038/s41419-018-0494-0. [DOI] [PMC free article] [PubMed] [Google Scholar]
- Yeh L. C.; Shyu H. W.; Jin Y. R.; Chiou Y. H.; Lin K. H.; Chou M. C.; Huang M. H.; Wang Y. F. Epigallocatechin-3-gallate downregulates PDHA1 interfering the metabolic pathways in human herpesvirus 8 harboring primary effusion lymphoma cells. Toxicol. In Vitro 2020, 65, 104753 10.1016/j.tiv.2019.104753. [DOI] [PubMed] [Google Scholar]
- Yihan L.; Xiaojing W.; Ao L.; Chuanjie Z.; Haofei W.; Yan S.; Hongchao H. SIRT5 functions as a tumor suppressor in renal cell carcinoma by reversing the Warburg effect. J. Transl. Med. 2021, 19 (1), 521. 10.1186/s12967-021-03178-6. [DOI] [PMC free article] [PubMed] [Google Scholar]
- Liu L.; Cao J.; Zhao J.; Li X.; Suo Z.; Li H. PDHA1 Gene Knockout In Human Esophageal Squamous Cancer Cells Resulted In Greater Warburg Effect And Aggressive Features In Vitro And In Vivo. Onco Targets Ther. 2019, 12, 9899–9913. 10.2147/OTT.S226851. [DOI] [PMC free article] [PubMed] [Google Scholar]
- Ma W.; Zhao X.; Wang K.; Liu J.; Huang G. Dichloroacetic acid (DCA) synergizes with the SIRT2 inhibitor Sirtinol and AGK2 to enhance anti-tumor efficacy in non-small cell lung cancer. Cancer Biol. Ther. 2018, 19 (9), 835–846. 10.1080/15384047.2018.1480281. [DOI] [PMC free article] [PubMed] [Google Scholar]
- Yetkin-Arik B.; Vogels I. M. C.; Nowak-Sliwinska P.; Weiss A.; Houtkooper R. H.; Van Noorden C. J. F.; Klaassen I.; Schlingemann R. O. The role of glycolysis and mitochondrial respiration in the formation and functioning of endothelial tip cells during angiogenesis. Sci. Rep. 2019, 9 (1), 12608 10.1038/s41598-019-48676-2. [DOI] [PMC free article] [PubMed] [Google Scholar]
- Olou A. A.; Ambrose J.; Jack J. L.; Walsh M.; Ruckert M. T.; Eades A. E.; Bye B. A.; Dandawate P.; VanSaun M. N. SHP2 regulates adipose maintenance and adipocyte-pancreatic cancer cell crosstalk via PDHA1. J. Cell Commun. Signal. 2023, 17 (3), 575–590. 10.1007/s12079-022-00691-1. [DOI] [PMC free article] [PubMed] [Google Scholar]
- Islam R.; Kim J. G.; Park Y.; Cho J. Y.; Cap K. C.; Kho A. R.; Chung W. S.; Suh S. W.; Park J. B. Insulin induces phosphorylation of pyruvate dehydrogenase through RhoA activation pathway in HepG2 cells. FASEB J. 2019, 33 (2), 2072–2083. 10.1096/fj.201800917R. [DOI] [PubMed] [Google Scholar]
- Tsvetkov P.; Coy S.; Petrova B.; Dreishpoon M.; Verma A.; Abdusamad M.; Rossen J.; Joesch-Cohen L.; Humeidi R.; Spangler R. D.; Eaton J. K.; Frenkel E.; Kocak M.; Corsello S. M.; Lutsenko S.; Kanarek N.; Santagata S.; Golub T. R. Copper induces cell death by targeting lipoylated TCA cycle proteins. Science 2022, 375 (6586), 1254–1261. 10.1126/science.abf0529. [DOI] [PMC free article] [PubMed] [Google Scholar]
Associated Data
This section collects any data citations, data availability statements, or supplementary materials included in this article.
Supplementary Materials
Data Availability Statement
The public data sets used in this study are available in the TCGA database (http://portal.gdc.cancer.com/) and GEO database (https://www.ncbi.nlm.nih.gov/geo/).


