Abstract
A series of development technologies of “horizontal well plus volume fracturing” have been established to achieve an annual output of one million tons of crude oil in 7 the Mahu tight conglomerate reservoir. However, such oil fields generally face problems such as rapid pressure drop, rapid production decline, difficulty in water injection, and gas channeling, seriously affecting the beneficial development of tight conglomerate reservoirs. To solve these problems, in this study, we carried out the feasibility experiment of different gas injection developments and the potential evaluation of enhanced oil recovery based on the combination of laboratory experiments and numerical simulation. The results show that CO2, rich gas, and dry gas can be miscible with crude oil in X oilfield under the original formation conditions. Both CO2 and hydrocarbon gas have expansion and viscosity reduction abilities. Under the same mole fraction of injected gas, the volume expansion ability and viscosity reduction ability of CO2 to crude oil are 2.14 and 2.25 times that of hydrocarbon gas, respectively. Numerical simulation results show that the well pattern suitable for gas injection and energy supplement is a vertical well injection and horizontal well production, and the angle between the horizontal well direction and the horizontal maximum principal stress direction is between 0° and 30°. Both laboratory experiments and numerical simulations show that the CO2 injection medium has the best recovery effect, which can increase the recovery rate by 13.8% compared with the depletion development. This research provides insights into the effective development of tight conglomerate reservoirs.
1. Introduction
Tight oil refers to oil stored in reservoirs such as tight sandstone, tight carbonate rock, etc., where the permeability of the overburden matrix is not greater than 0.1 mD, or nonthick oil type oil with a flow rate not greater than 0.1 mD. With the successive discoveries of tight oil reservoirs and the continuous breakthroughs in horizontal well volume fracturing, the reserves and production of tight oil reservoirs have demonstrated a huge resource potential, which has become an important source of conventional oil production.1−5 Today in China, tight oil and gas are considered to be the most realistic unconventional replacement energy sources, which further make up for the shortage of conventional oil and gas sources in China.6 The US Energy Information Administration (EIA) estimates that tight oil technology has the potential to recover 44.8 × 10⁸ t of resources in China.7 Currently, the main development method of tight oil reservoirs is based on the “horizontal well plus volume fracturing” of North America, which mainly relies on natural energy depletion exploitation.8,9 The development of volume fracturing technology has accelerated the rapid growth of tight oil production, but it has brought about problems such as rapid production decline and difficulties in replenishing energy, which are becoming more and more significant.10 At the same time, it is important to consider the many differences between China’s land facies tight oil and North America’s marine facies tight oil. North America’s geological structure is stable, and abnormal high-pressure reservoirs are usually developed, while the domestic land facies’ tight oil pressure coefficient is of wide variation. For the conventional pressure system and low-pressure system strata, after a rapid decline of natural energy, the loss of diminishing production seriously affects the effect of the development of tight oil.11 For example, in the Mahu area of Xinjiang, the annual decline rate of horizontal well production is close to 30%, and the recovery rate is only 5–10%, which urgently needs a specific response to achieve efficient use of resources.
Gas injection is one of the important techniques for enhanced oil recovery and has received strong attention in recent years. The gases injected during the gas injection process are mainly hydrocarbon gases, carbon dioxide, and nitrogen. Several scholars have studied the mechanism of gas injection about the interaction between injected gas and reservoir, including lowering the viscosity of the crude oil, lowering the interfacial tension between the oil and water, improving the energy of the oil reservoir, and increasing the production differential pressure.12−16 The gas injection effect of the field gas injection experiments implemented in major oil fields in China and abroad varies greatly due to the effect of gas injection is mainly affected by reservoir geological conditions, crude oil quality, well pattern spacing, gas injection technology policy, and other factors.17−21 Although the mechanism of gas injection to increase production and the main influencing factors have been clarified, the object of previous research is mainly conventional reservoirs without large-scale volume fracturing or low-permeability reservoirs. To pursue a higher primary oil recovery rate when developing tight reservoirs, large-scale volume fracturing is commonly used; meanwhile, to obtain a larger fracture reforming volume, the horizontal well direction is usually perpendicular to the direction of the maximum principal stress. However, this well pattern-fracture network matching relationship is prone to gas channeling during gas injection, which can affect the gas injection effect. Therefore, it is necessary to further study the well pattern parameters and the well pattern-fracture network matching relationship to explore a suitable development well pattern for gas injection.
This paper focuses on the X oilfield in the Mahu area and explores the feasibility and potential of gas injection in tight conglomerate reservoirs through laboratory experiments and numerical simulations. The feasibility experiments of injecting different gases and evaluating the potential for improving oil recovery are carried out in the article. The feasibility of injecting gas to supplement formation energy in the tight conglomerate reservoir and the potential of the Mahu X oilfield are clarified. The well pattern parameters under gas injection conditions and the coupling mode of the fracture network-well pattern are explored. The research results can provide a reference for the development of similar oil reservoirs.
2. Field Background
X oilfield is located in the north slope area of Mahu Depression in the central depression of Junggar Basin, which belongs to typical tight conglomerate reservoirs. The porosity covers the range of 4.5–15.9% with the average value of 9.23%. Meanwhile, the permeability has a range of 0.03–92.8 mD with a mean value of 0.47 mD. The average surface crude oil density is 0.8311 g/cm3, crude oil viscosity is 4.45 mPa·s at 50 °C, and original dissolved gas-oil ratio is 282–331 m3/m3. Under the average reservoir depth of 3508 m, the formation pressure and temperature are 49.33 MPa and 84.35 °C, the saturation pressure is 38.18 MPa, and the pressure coefficient is 1.433, which belongs to a high saturated oil reservoir with abnormally high pressure.
The reservoir drive type is formation elasticity plus dissolved gas. Due to the high reservoir saturation pressure, the pressure difference between formation pressure and saturation pressure is only 11 MPa, which means it is very easy to degas due to the pressure drop during reservoir production. This situation affects the development effect and reduces the cumulative production. To improve the single well production and achieve the goal of development efficiently, it is necessary to replenish the formation energy in time to delay reservoir degassing in the development of the reservoir.
3. Experimental Design
To evaluate the potential of gas injection, three laboratory experiments with different types of gas injected (dry gas, rich gas, and CO2) will be conducted, which can discover the mechanism and evaluate the potential of oil recovery enhancement with different injected gases. The temperature of the injected gas is set to 10 °C. The development effect under different gas injection is analyzed to provide a basis and theoretical foundation for the selection of reasonable injection medium for oil fields, and further to guide the design of gas injection programs in oil fields.
3.1. Experimental Fluids
The oil used for the experiment is compounded according to the standard based on the sample from the field. The test demonstrates that the formulated formation crude oil with bubble point pressure of 37.97 MPa, dissolved gas-oil ratio of 233.33 m3/m3, volume coefficient of formation oil of 1.5366, and viscosity of formation oil of 0.31 mPa·s can satisfy the requirements of the experiment. The components of hydrocarbo1q gas used for the experiment are shown in Table 1.
Table 1. Components of Hydrocarbon Gas.
| |
dry gas/poor gas |
||
|---|---|---|---|
| component | volume fraction (%) | component | volume fraction (%) |
| methane | 87.77509 | 95.50286 | |
| ethane | 8.354668 | ethane | 3.344984 |
| propane | 2.737692 | propane | 0.799182 |
| isobutane | 0.489383 | isobutane | 0.15769 |
| N-butane | 0.528705 | N-butane | 0.188423 |
| isopentane | 0.081379 | isopentane | 0.005599 |
| N-pentane | 0.033085 | N-pentane | 0.001262 |
3.2. Slim Tube Experiment
The slim tube experiment is an important technical method to determine the minimum miscible pressure of gases, which is currently recognized as a more accurate method to determine the minimum miscible pressure. The experiment uses a filled long thin tube with a length of 14.5 m and a diameter of 7 mm. The experimental setup and flow are shown in Figure 1.
Figure 1.
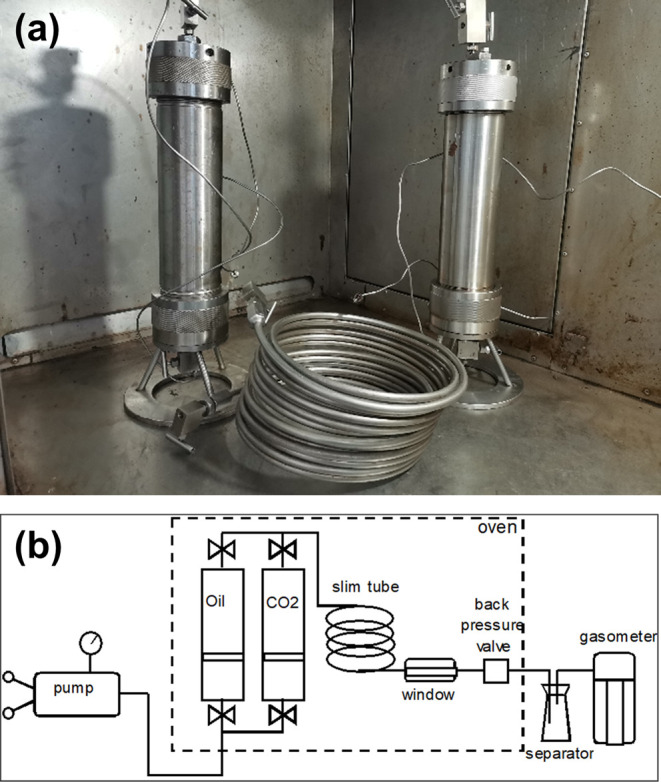
Slim tube experiment device and schematic. (a) View of the slim tube experiment device. (b) Experimental schematic.
3.3. PVT Experiment
The experimental equipment used for the PVT test is an ultrahigh-pressure fully visible PVT test system, as shown in Figure 2. The manufacturer is ST, France, with a maximum temperature of 200 °C and a maximum pressure of 150 MPa. Constant-mass expansion experiments, single-degassing experiments, and multiple-degassing experiments are carried out. Physical parameters of the crude oils such as the relative volume, crude oil density, compression coefficient, dissolved gas-oil ratio at different pressures, and crude oil volume coefficient are obtained.
Figure 2.
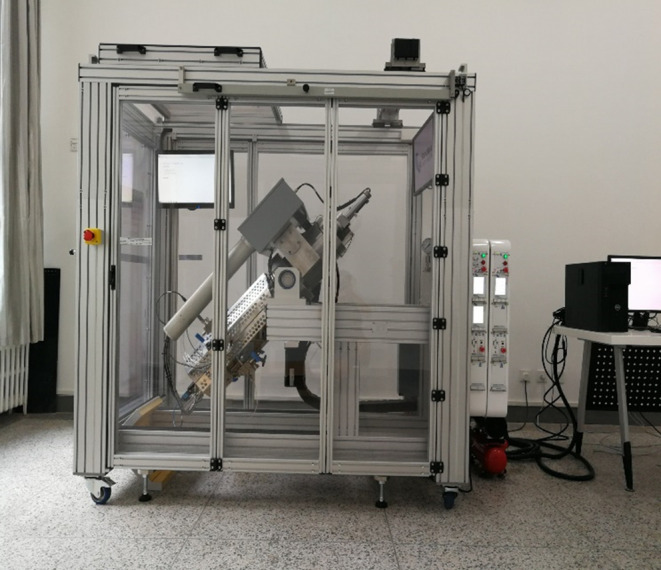
Ultrahigh-voltage full visual PVT testing system
3.4. Gas Injection Expansion Test
The study of the phase state between the injected gas and formation crude oil system is indispensable for gas injection miscible phase drive design and dynamic analysis. The main mechanism of the gas injection mixed-phase drive to improve recovery is to expand the volume of crude oil, reduce the viscosity of crude oil, and lower the interfacial tension through the dissolution of gas in crude oil. To quantitatively characterize the magnitude of changes in crude oil properties under different gas injection gases, CO2 injection expansion experiments and hydrocarbon gas injection expansion experiments are carried out respectively.
4. Results
4.1. Slim Tube Experiment Results
Five slim tube experiments are carried out between the types of gas (rich gas, dry gas, and CO2) and crude oil at formation temperature. The relationship curve between the driving pressure and the oil driving efficiency is shown in Figure 3. When the driving pressure is low, it is the immiscible phase stage, and oil driving efficiency is relatively low. Then with the increase in the driving pressure, the oil driving efficiency increases to more than 90%. When the driving pressure continues to increase, although the oil driving efficiency increases, the increase is relatively small. At this point, it is considered that it enters into the miscible stage, and the curve intersection of the immiscible phase and miscible stage corresponds to the minimum miscible pressure under certain gas conditions. The minimum miscible pressures of CO2, rich gas, and dry gas with crude oil in X well area are 19.0, 45.0, and 48.5 MPa, respectively, and the three gases can realize miscible or near-miscible under the original reservoir pressure (49.3 MPa).
Figure 3.
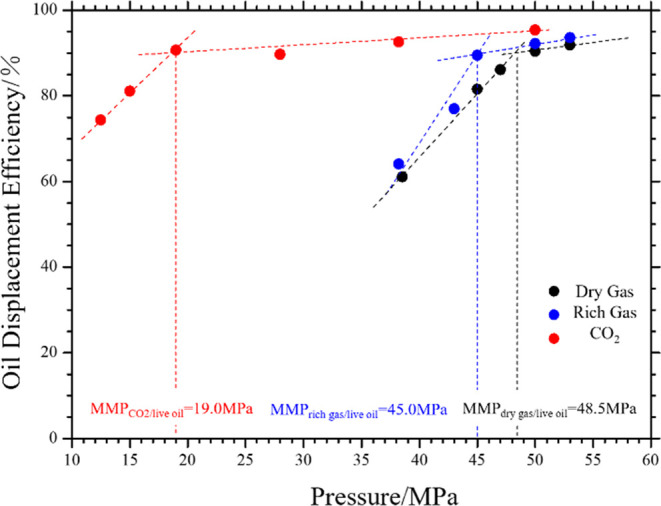
Summary of minimum miscible pressure for live oil/dry gas, rich gas, and CO2.
To more intuitively determine the miscible phase of gas and target crude oil, the contact characteristics between gas and crude oil are observed in the ultrahigh-pressure full visual PVT testing system, as shown in Figure 4. CO2 can be observed to be in a miscible phase of oil and gas at a pressure of 38.2 MPa near the bubble point. In the ultrahigh-pressure fully visible PVT testing system, the disappearance of the two-phase interface and the miscible phase of oil and gas can be observed. Meanwhile dry gas and rich gas cannot achieve miscible under near bubble point pressure, and the separation state of oil and gas can be observed in the ultrahigh-pressure fully visible PVT testing system. However, three types of gases can be observed to be in a miscible phase of oil and gas at a formation pressure of 49.3 MPa. In the ultrahigh-pressure fully visible PVT testing system, the two-phase interface between the gas and crude oil can be seen to disappear, forming a uniform and continuous phase. Based on the above experimental results, it can be seen that the target reservoir has the greatest potential for miscibility when using a CO2 gas drive. When the target reservoir is elastically developed, the miscibility ability of dry gas and rich gas will decrease with the decrease of reservoir pressure, making it difficult to achieve miscibility in the reservoir. The miscibility pressure of CO2 is low, which has great potential for improving oil recovery.
Figure 4.
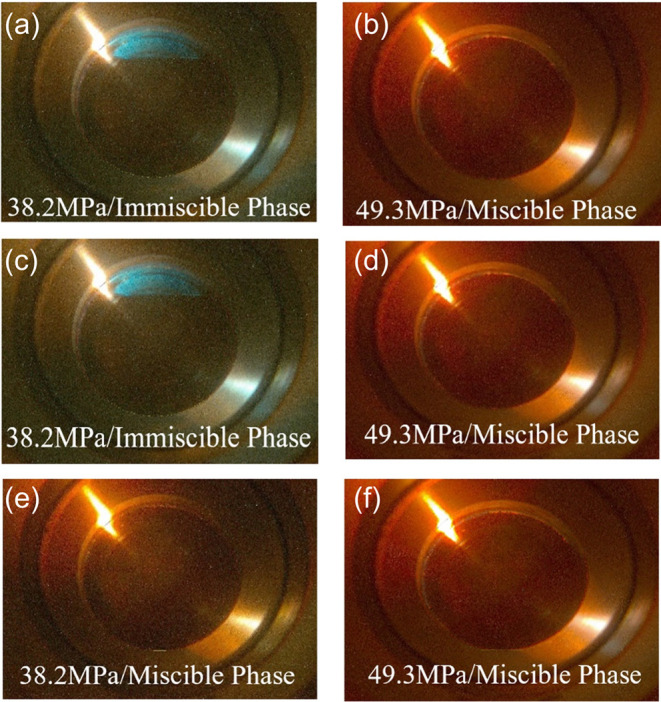
Contact status between injected gas and crude oil under near bubble point pressure and reservoir pressure: (a) Live oil/dry gas contact status with immiscible phase under 38.2 MPa. (b) Live oil/dry gas contact status with miscible phase under 49.3 MPa. (c) Live oil/rich gas contact status with immiscible phase under 38.2 MPa. (d) Live oil/rich gas contact status with miscible phase under 49.3 MPa. (e) Live oil/CO2 contact status with miscible phase under 38.2 MPa. (f) Live oil/CO2 contact status with miscible phase under 49.3 MPa.
4.2. PVT Experiment Results
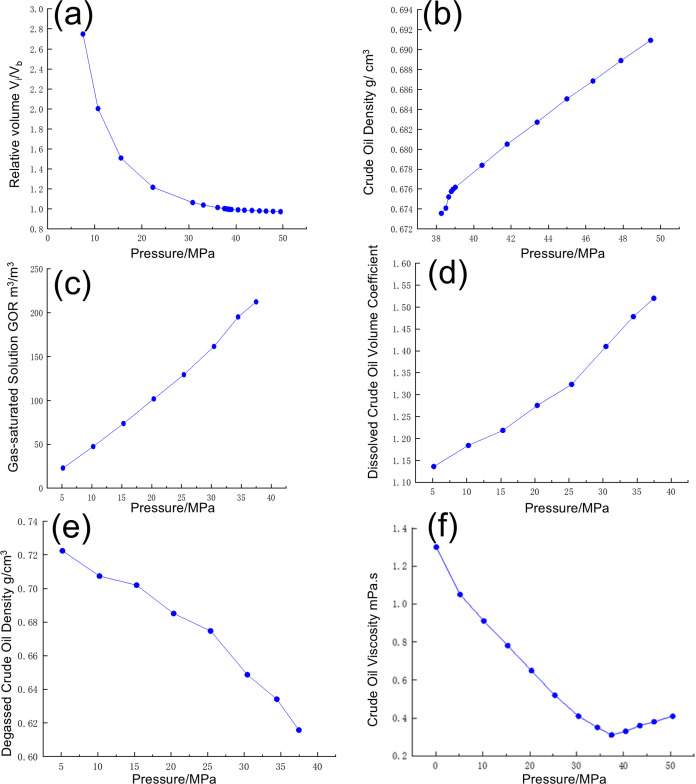
To obtain crude oil physical parameters such as relative volume, density, compression coefficient, dissolved gas-oil ratio at different pressures, crude oil volume coefficient, and its trend with changes in pressure and then provide basic parameters for numerical simulation work, PVT experiments are carried out, including single-degassing experiments, constant-mass expansion experiments, and multiple-degassing experiments, and the composition of the fluid in wells is analyzed by gas chromatography. The experimental results are shown in Figure 5a–f, from which it can be seen that the relative volume decreases with the increase of pressure, the formation oil density, dissolved gas-oil ratio, and formation oil volume coefficient increase with the increase of pressure, and the viscosity of the crude oil decreases first and then increases with the increase of pressure. The change of viscosity has been attributed to the fact that the experimental pressure was decreased from 50 MPa, and before it was decreased to the bubble pressure, the oil sample was not degassed. Therefore, along with the decrease of the pressure, the volume of crude oil was expanded, and the viscosity was decreased. However, after it was decreased to the bubble pressure (38 MPa), the oil sample was degassed, and the viscosity of the crude oil began to increase. The above experimental data can be used to fit the components in a numerical simulation.
Figure 5.
Results of the PVT Experiment. (a) Relationship between relative volume and pressure. (b) Relationship between crude oil density and pressure. (c) Relationship between gas-saturated solution GOR and pressure. (d) Relationship between degassed oil volume coefficient and pressure. (e) Relationship between multiple degassed oil densities and pressure. (f) Relationship between crude oil viscosity and pressure (84.4 °C).
4.3. Gas Injection Expansion Test Results
4.3.1. Volume Expansion Coefficient
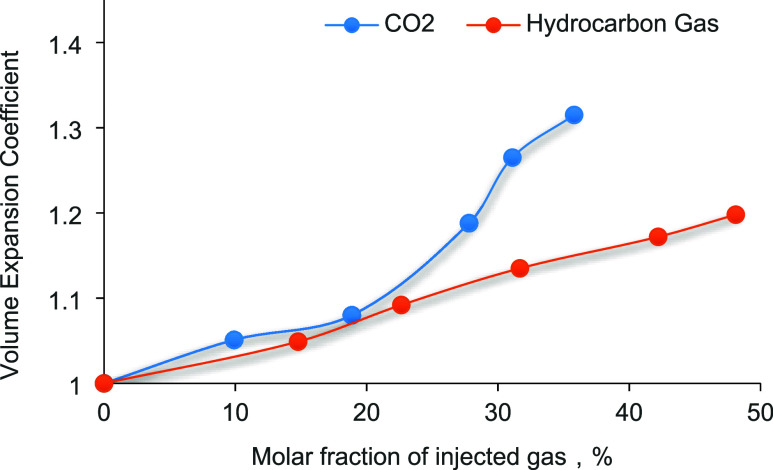
The volume expansion coefficient under the formation pressure is the ratio of the volume of formation crude oil under the formation pressure after gas addition to the volume of formation crude oil under the formation pressure without gas addition. The volume expansion coefficient reflects the expansion capacity of the gas to the crude oil after gas injection. The relationship between injected gas and volume expansion coefficient is shown in Figure 6. The experimental results show that the volume of formation crude oil expands obviously after injecting CO2 and hydrocarbon gas, and the volume expansion coefficient increases with the more CO2 and hydrocarbon gas added to the crude oil. The volume expansion coefficient of formation crude oil is 1.315 when the injection amount of CO2 is 35.8 mol %, and the volume of the crude oil expands by 31.5%. When the injection amount of hydrocarbon gas is 48.11 mol %, the expansion coefficient of formation crude oil is 1.98, and the volume of crude oil expands by 19.8%. Under the same molar fraction of injected gas, the volume expansion capacity of CO2 to crude oil is 2.14 times stronger than that of hydrocarbon gas. It indicates that CO2 has a strong swelling capacity for crude oil in the formation in the test area, which is very favorable for improving the production capacity, and the swelling effect is obvious. Since the solubility of CO2 in crude oil increases with the increase of pressure, the ability of CO2 to swell the volume of crude oil is enhanced by increasing the injection pressure, which is conducive to the improvement of the oil driving efficiency.
Figure 6.
Relationship curve between volume expansion coefficient and gas injection rate
4.3.2. Viscosity
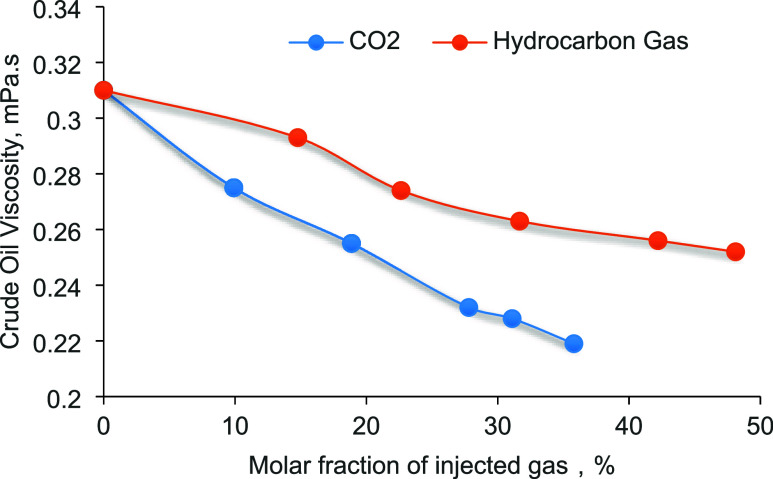
The change curves of the viscosity of the injected gas and formation crude oil system with the injection amount are shown in Figure 7. The experimental results show that the viscosity of the formation crude oil decreases substantially once CO2 or hydrocarbon gas is injected, and the viscosity of the system decreases with the increase in the gas injected into the crude oil. When the CO2 injection amount is 35.8 mol %, the viscosity of formation crude oil decreased from the original 0.31 to 0.219 mPa·s, which is 29.35% lower. When the hydrocarbon gas injection amount is 48.11 mol %, the viscosity of formation crude oil decreases from the original 0.31 to 0.252 mPa·s, which is 18.71% lower. The viscosity reduction effect of the CO2 injection is better than that of the hydrocarbon gas injection, and the viscosity reduction capacity of the CO2 injection is 2.25 times that of hydrocarbon gas under the same molar fraction of the injection gas. The above experimental results show that the injected gas has a good viscosity reduction effect on the crude oil of the formation in the test area, which can effectively improve mobility and is conducive to improving the oil driving efficiency.
Figure 7.
Relationship curve between viscosity and gas injection rate.
4.3.3. Saturation Pressure
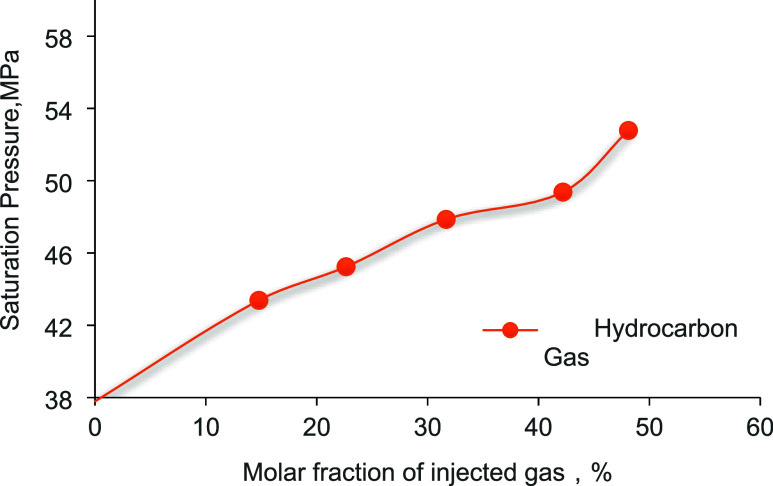
The trend of crude oil saturation pressure with the injection volume during hydrocarbon gas injection is shown in Figure 8. It can be seen from the figure that the saturation pressure of the formation crude oil rises continuously with the increase of hydrocarbon gas injection volume, and when the hydrocarbon gas injection volume is 48.11 mol %, the saturation pressure rises 14.99 MPa, which is 1.4 times higher than no gas injection.
Figure 8.
Relationship curve between saturation pressure and hydrocarbon gas injection rate.
The above experimental results show that both CO2 and hydrocarbon gases have strong solubility, swelling, and viscosity reduction ability in crude oil, which is very favorable to increase the production capacity and can improve the crude oil fluidity.
5. Discussion
To explore the potential and feasibility of gas drive development in the study area, a numerical simulation study of the workover zone is carried out based on the experimental results to optimize the key parameters of gas injection. Based on the finite element method, a meticulous three-dimensional geological model of the study area is established. A fine simulation of the artificial fracture network of horizontal wells is carried out to establish an unstructured grid model of the artificial fracture network, based on which a numerical simulation study of gas injection development is carried out. The gas injected into the model is CO2. A single-factor analysis method was adopted to study the influence of gas injection well patterns, well type, horizontal well direction, fracturing scale, and other factors on the effect of gas injection development, and explore the coupling mode of fracture network-well pattern.
5.1. Optimization of Well Pattern and Well Type
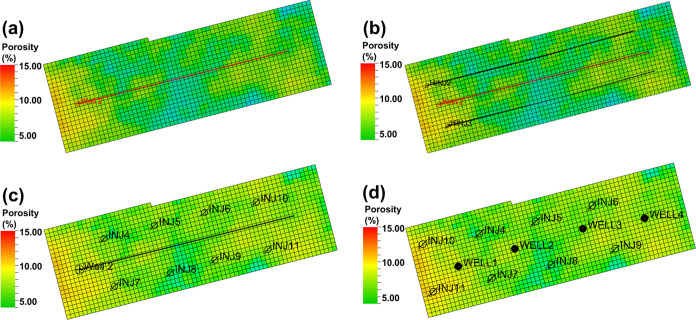
Horizontal well gas injection has the advantages of wide planar reach and uniform replacement but is not conducive to injection-production control and poor vertical reserve utilization, while vertical wells are convenient for gas injection control but have a small planar reach, so it is necessary to optimize the injection-production well types. Based on the results of the research,22−24 three gas injection well patterns are designed: horizontal well injection and horizontal well production (production wells are fractured, gas injection wells are not fractured), vertical well injection and horizontal well production (production wells are fractured, gas injection wells are not fractured), and vertical well injection and vertical well production (both are not fractured), and at the same time, a group of depletion exploitation after fracturing is designed as a comparison, and the forms of the well pattern are shown in Figure 9.
Figure 9.
Optimization of well pattern and well type. (a) Depletion exploitation after fracturing. (b) Horizontal well injection and horizontal well production. (c) Vertical well injection and horizontal well production. (d) Vertical well injection and vertical well production.
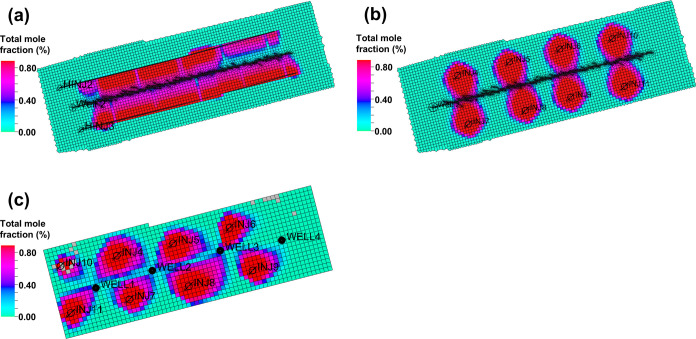
The numerical simulation results are shown in Table 2, and the gas wave ranges under different well patterns are shown in Figure 10. The results show that horizontal well injection and horizontal well production has the highest reserve recovery degree of 24.2%, mainly due to the fact that the injection wells are horizontal wells with a large perforation length and increase the plane swept efficiency of gas; vertical well injection and horizontal well production has the well control recovery degree of 23.3%, due to the fact that the injection wells are vertical wells has a limited plane swept efficiency with a point gas injection; traight well injection and vertical well production has a recovery degree of 21.9% with the gas breakthrough time lately, but the oil recovery rate slowly (0.8% on average, 1.5% on average after fracturing) and the production degree in the same time is lower than the other injection schemes; depletion exploitation after fracturing has well control production degree 8.5%, and the pressure and oil production of the wells under this kind of well pattern fall fast, meanwhile the time of gas breakthrough is early. Considering the production degree and later well pattern adjustment, the development well type of vertical well injection and horizontal well production is recommended.
Table 2. Simulation Results of Well Type and Well Pattern Optimization.
| well pattern | accumulated production after gas injection (104 m3) | accumulated gas injection volume (108 m3) | gas breakthrough time (Year) | well control recovery degree (%) |
|---|---|---|---|---|
| horizontal well injection and horizontal well production | 14 | 0.96 | 10.2 | 24.2 |
| vertical well injection and horizontal well production | 13.5 | 1.14 | 8.4 | 23.3 |
| vertical well injection and vertical well production | 12.7 | 1.03 | no gas | 21.9 |
| depletion exploitation after fracturing | 3.3 | 0 | 8.5 |
Figure 10.
Scope of gas propagation at different well patterns. (a) Horizontal well injection and horizontal well production. (b) Vertical well injection and horizontal well production. (c) Vertical well injection and vertical well production.
5.2. Optimization of Horizontal Well Direction
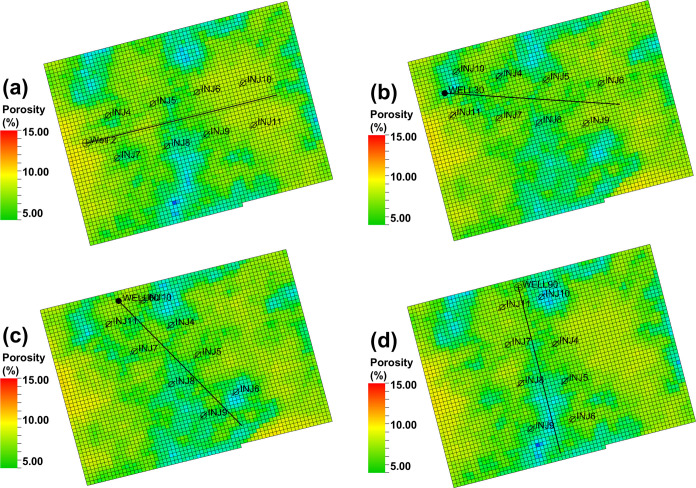
Field tests have shown that gas channeling caused by fracture communication is the main reason for the poor gas drive effect.21 To create a more complex fracture network during horizontal well depletion exploitation, horizontal wells are generally deployed perpendicular to the direction of the maximum principal stress. But when gas injection is selected for energy supplementation, the horizontal well direction needs to be justified to prevent gas channeling. Deploying horizontal wells nearly parallel to the direction of maximum principal stress is good for controlling the fracturing slit length, avoiding gas channeling, and expanding the sweep volume. The horizontal wells are designed at angles of 0, 30, 60, and 90° to the maximum principal stress direction, and the gas injection effects under the four scenarios are simulated to explore the influence of the horizontal well direction on the gas injection development and to optimize the matching relationship between the fracture network and the well pattern, and the horizontal well direction is shown in Figure 11.
Figure 11.
Optimization of horizontal well direction: (a) 0°, (b) 30°, (c) 60°, (d) 90°.
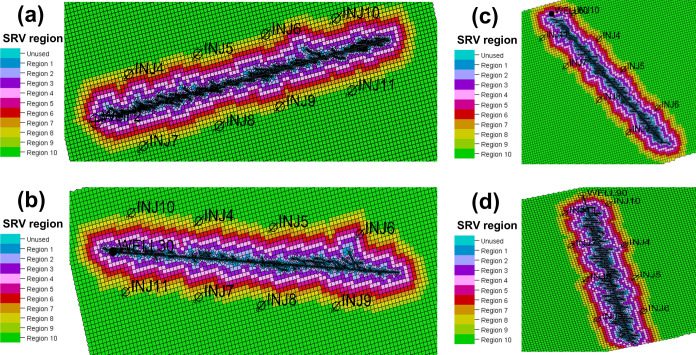
The simulation results of fracture morphology are shown in Figure 12, and the fracture parameters are shown in Table 3. The simulation results show that (1) when the fracturing scale of the horizontal well is 10,000 m3, the fracturing slit length at different angles is around 50 m and the fracture extension along the direction of the maximal principal stress; (2) as the angle of the fracture with the maximal principal stress increases, the fracturing volume increases slightly; (3) as the extension direction of the fracture under the angle of 90° is the same as the direction of injection and production, the risk of gas channeling in this direction increase.
Figure 12.
Simulation of fracture morphology after fracturing with different horizontal well directions: (a) 0°, (b) 30°, (c) 60°, (d) 90°.
Table 3. Fracture Simulation Results.
| horizontal well direction (deg) | fracture half-length (m) | fracture volume (m3) | SRV (km3) | fracture height (m) | fracture width (mm) | fracture conductivity (mD·m) |
|---|---|---|---|---|---|---|
| 0 | 51 | 987 | 0.0435 | 13 | 5 | 351 |
| 30 | 52 | 1169 | 0.0425 | 13 | 8 | 551 |
| 60 | 47 | 1117 | 0.0451 | 13.7 | 4.5 | 318 |
| 90 | 52 | 1270 | 0.0477 | 13.8 | 4.5 | 318 |
By predicting the recovery degree of horizontal wells under different clamping angles, it is also verified that the larger the clamping angle between horizontal wells and the maximum principal stress, the worse the gas injection development effect. The prediction results are shown in Table 4, when the horizontal well direction is parallel to the direction of the maximum principal stress, the well control production degree is the highest, which is 21.3%, and the larger the angle between the horizontal well direction and the maximum principal stress, the earlier the gas channeling occurs and the lower the reserve recovery degree is.
Table 4. Simulation Results of Horizontal Well Direction Optimization.
| horizontal well direction (deg) | accumulated production after gas injection (104 m3) | accumulated gas injection volume (108 m3) | gas breakthrough time (Year) | well control recovery degree (%) |
|---|---|---|---|---|
| 0 | 16.4 | 1.08 | 11.8 | 21.3 |
| 30 | 16.3 | 1.03 | 11.2 | 21.2 |
| 60 | 15 | 0.97 | 10.5 | 19.5 |
| 90 | 13.7 | 0.88 | 9.6 | 17.8 |
After comprehensively considering the actual fracturing conditions at the site, the recommended horizontal well direction is an angle between 0 and 30° from the direction of maximum principal stress.
5.3. Optimization of Fracturing Size at Different Well Spacing
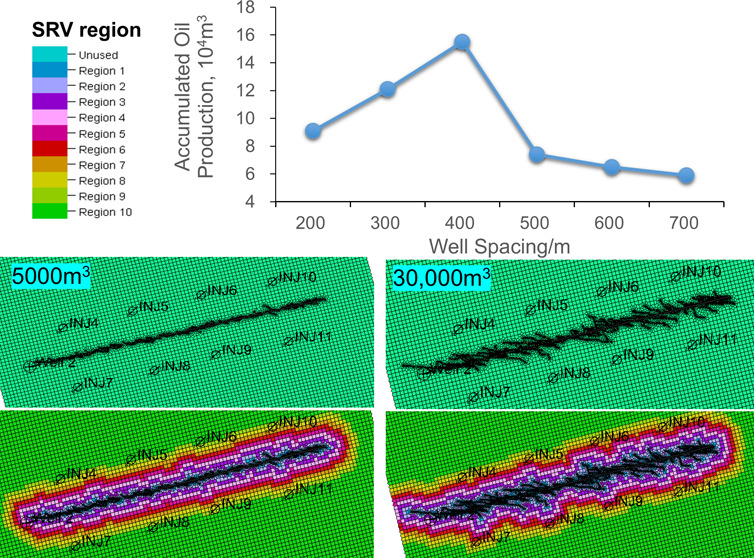
The optimal fracturing scale for different well spacings is different. The matching relationship between the fracturing scale and well spacing is demonstrated by numerical simulation to optimize the injection and production well pattern under the coupling of the fracture network and well pattern. A total of 24 scenarios are set up to optimize the matching relationship between the fracture network and the well pattern through numerical simulation, with the injection and production well spacing of 200, 300, 400, 500, 600, and 700 m without fracturing, and with fracturing fluids of 5000, 10,000, and 30,000 m3.
5.3.1. Simulation of Fractures at Different Fracturing Scales
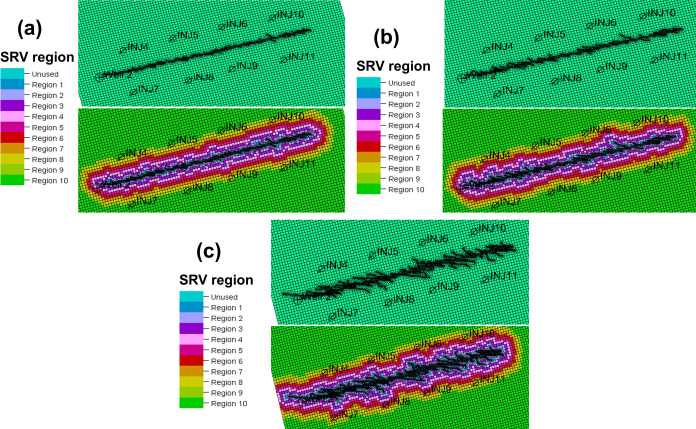
The fracture expansion patterns under different fracture scales are simulated by fracturing software (i.e., Petrel Kinetix 2022), shown in Figure 13, and the fracture sizes are shown in Table 5. After the fracturing fluid volume is increased from 5000 to 30,000 m3, the fracture half-length and fracture volume along the direction of the maximum principal stress increased with the average fracture half-length increased from 41 to 87 m and the fracture volume increased from 5723 m3 to 3,454,550 m3. It indicates that increasing the fracture scale when the horizontal well direction is parallel to the direction of maximum principal stress improves the reservoir mainly along the direction of the horizontal well trajectory.
Figure 13.
Fracture propagation morphology and SRV transformation volume under different fracturing scales: (a) 5000 m3, (b) 10,000 m3, (c) 30,000 m3.
Table 5. Simulation Results of Fracture under Different Fracturing Scales.
| fracturing fluid volume (m3) | fracture half-length (m) | fracture volume (m3) | SRV (km3) | fracture height (m) | fracture width (mm) |
|---|---|---|---|---|---|
| 0 | 0 | 0 | 0 | 0 | 0 |
| 5000 | 41 | 5723 | 12.5 | 3.7 | 264 |
| 10,000 | 51 | 10,987 | 13 | 5 | 351 |
| 30,000 | 87 | 34,545 | 15.7 | 10 | 434 |
5.3.2. Optimization of Fracturing Size at Different Well Spacing
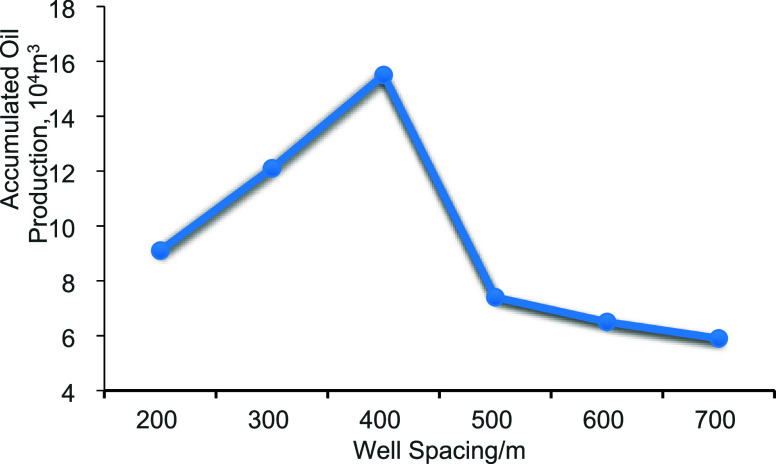
The cumulative oil production of a single well with different injection spacing at the same fracturing scale is simulated.25−28 The simulation results are shown in Figure 14, which shows that with the increase of injection spacing the degree of well control recovery increases and then decreases and the highest degree of recovery is achieved when the injection spacing is 400 m. When the distance is less than 400 m, the well distance is too small can lead to the gas channeling advanced which results in low recovery; more than 400 m, with the increase of well distance, the gas injection time is late, and the formation energy is insufficient, resulting in early degassing, and the recovery degree is also reduced. Therefore, to delay reservoir degassing and guarantee single-well EUR, it is recommended to deploy injection and production wells with 400 m well spacing.
Figure 14.
Accumulated production of well patterns at different well spacing under 10,000 m3 fracturing scale.
5.3.3. Optimization of Well Spacing at Different Fracturing Sizes
The results of the well control reserve recovery degree under different fracturing scales at 400 m well spacing are shown in Figure 15, from which it can be seen that the larger the fracturing scale, the higher the reserve recovery degree. The increase of recovery degree under different fracturing scales at 400 m well spacing is calculated and shown in Figure 15, from which it can be seen that the increase of recovery degree is the largest when the fracturing scale is 10,000 m3, but the increase decreases when the fracturing fluid volume exceeds 10,000 m3. Therefore, gas injection is suitable for medium-sized fracturing (10,000 m3) to improve the fluid flow around the well appropriately. Horizontal wells without fracturing have a high cumulative oil production but a slow oil recovery rate with only 0.8% at a 400 m well spacing.
Figure 15.
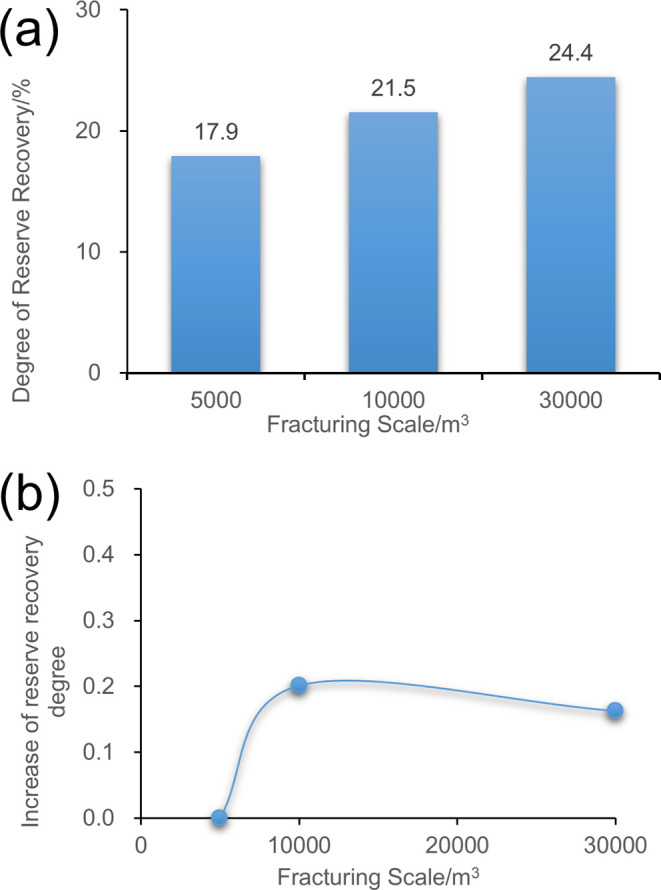
Recovery degree and increase of reserve recovery degree. (a) Recovery degree at different fracturing scales. (b) Increase of reserve recovery degree.
Considering the cumulative oil production, cost, and other factors, it is recommended to use 400 m injection and production well spacing, and the horizontal wells are fractured with a fracturing fluid volume of about 10,000 m3 (1800 m, 24 sections) of medium-sized fracturing.
5.4. Optimization of Injection Medium
The results of laboratory slim tube experiments show that the miscible capacity is a dry gas, rich gas, and CO2 in descending order, and all three gases can be miscible under the original formation pressure. CO2 and hydrocarbon gas have strong solvency, expansion, and viscosity reduction capacity in crude oil, which is very favorable to increase the production capacity and improve the fluidity of crude oil. Among them, injected CO2 has a stronger dissolving capacity, better swelling effect, and viscosity reduction effect, which makes it a very potential oil-repellent gas. In the model, CO2 and dry gas are designed to simulate the development effect under the same injection conditions.
The simulation results show that after three years of gas injection, the interfacial tension is reduced by 63.54% by CO2 injection and 19.67% by hydrocarbon gas injection, and the ability of CO2 to reduce interfacial tension is 3.2 times that of hydrocarbon gas. The well control recovery degree of the CO2 injection is 22.3%, which is 13.8% higher than that of depletion exploitation, and the well control recovery degree of hydrocarbon gas injection is 18.4%, which is 9.9% higher than that of depletion exploitation. CO2 has good miscible capacity with crude oil, and it is delayed than the time of hydrocarbon gas channeling, so it is recommended that the injection gas is CO2.
6. Conclusions
The development of tight conglomerate reservoirs generally faces the problems of a fast pressure drop and difficult energy replenishment. To solve these problems, this paper carried out the feasibility experiment of different gas injection developments and the potential evaluation of enhanced oil recovery, based on the combination of laboratory experiments and numerical simulation. Laboratory experiments show that the miscible pressures of crude oil with CO2, rich gas, and dry gas in X oilfield are 19.0, 45.0, and 48.5 MPa, respectively, and all of them can realize miscible or immiscible under formation pressure, among which the mixing pressure of CO2 is the lowest, the viscosity-reducing ability is 2.25 times that of hydrocarbon gas, and the expansion ability is 2.14 times that of hydrocarbon gas, so it is the most promising gas for energy replenishment. The optimization of key parameters of gas injection is concluded as follows: the development well pattern suitable for gas injection is a vertical well injection and horizontal well production; the direction of horizontal wells is the angle of 0–30° with the direction of the maximum principal stress; the recommended spacing of injection and production wells is 400 m; and the horizontal wells are fractured with the medium-scale fracturing with the volume of fracturing fluid of about 10,000 m3 (1800 m, 24 sections); laboratory experiments and numerical simulations have shown that CO2 is the most promising gas to drive the oil.
Acknowledgments
This research was supported by the Science Foundation of China University of Petroleum, Beijing (No. 2462023BJRC001).
The authors declare no competing financial interest.
References
- Jia C.; Zheng M.; Zhang Y. Unconventional Hydrocarbon Resources in China and the Prospect of Exploration and Development. Pet. Explor. Dev. 2012, 39 (2), 139–146. 10.1016/S1876-3804(12)60026-3. [DOI] [Google Scholar]
- Hu S.; Zhu R.; Wu S.; Bai B.; Yang Z.; Cui J. Exploration and Development of Continental Tight Oil in China. Pet. Explor. Dev. 2018, 45 (4), 790–802. 10.1016/S1876-3804(18)30082-X. [DOI] [Google Scholar]
- Hu S.; Tao S.; Yan W.; Yang Z.; Men G.; Tang Z.; Xue J.; Chen X.; Jia X.; Jiang T.; Huang D.; Liang X.; Jing F. Advances on Enrichment Law and Key Technologies of Exploration and Development of Continental Tight Oil in China (2016–2018). J. Nat. Gas Geosci. 2019, 4 (6), 297–307. 10.1016/j.jnggs.2019.11.001. [DOI] [Google Scholar]
- Li Z.; Qu X.; Liu W.; Lei Q.; Sun H.; He Y. Development Modes of Triassic Yanchang Formation Chang 7 Member Tight Oil in Ordos Basin, NW China. Pet. Explor. Dev. 2015, 42 (2), 241–246. 10.1016/S1876-3804(15)30011-2. [DOI] [Google Scholar]
- Du J.; Liu H.; Ma D.; Fu J.; Wang Y.; Zhou T. Discussion on Effective Development Techniques for Continental Tight Oil in China. Pet. Explor. Dev. 2014, 41 (2), 217–224. 10.1016/S1876-3804(14)60025-2. [DOI] [Google Scholar]
- Zheng M.; Li J.; Wu X.; Wang S.; Guo Q.; Yu J.; Zheng M.; Chen N.; Yi Q. China’s Conventional and Unconventional Natural Gas Resources: Potential and Exploration Targets. J. Nat. Gas Geosci. 2018, 3 (6), 295–309. 10.1016/j.jnggs.2018.11.007. [DOI] [Google Scholar]
- US Energy Information Administration (EIA) . Technically Recoverable Shale Oil and Shale Gas Resources: An Assessment of 137 Shale Formations in 41 Countries Outside the United States [EB/OL]. (June 01, 2013).
- Hui G.; Chen Z.; Wang Y.; Zhang D.; Gu F. An Integrated Machine Learning-Based Approach to Identifying Controlling Factors of Unconventional Shale Productivity. Energy 2023, 266, 126512 10.1016/j.energy.2022.126512. [DOI] [Google Scholar]
- Hui G.; Chen S.; He Y.; Wang H.; Gu F. Machine Learning-Based Production Forecast for Shale Gas in Unconventional Reservoirs via Integration of Geological and Operational Factors. J. Nat. Gas Sci. Eng. 2021, 94, 104045 10.1016/j.jngse.2021.104045. [DOI] [Google Scholar]
- Liu S. Review of the Development Status and Technology of Tight Oil: Advances and Outlook. Energy Fuels 2023, 37 (19), 14645–14665. 10.1021/acs.energyfuels.3c02726. [DOI] [Google Scholar]
- Wang L.; Tian Y.; Yu X.; Wang C.; Yao B.; Wang S.; Winterfeld P. H.; Wang X.; Yang Z.; Wang Y.; Cui J.; Wu Y.-S. Advances in Improved/Enhanced Oil Recovery Technologies for Tight and Shale Reservoirs. Fuel 2017, 210, 425–445. 10.1016/j.fuel.2017.08.095. [DOI] [Google Scholar]
- Song Y.; Song Z.; Zhang Z.; Chang X.; Wang D.; Hui G. Phase Behavior of CO 2 -CH 4 -Water Mixtures in Shale Nanopores Considering Fluid Adsorption and Capillary Pressure. Ind. Eng. Chem. Res. 2022, 61 (16), 5652–5660. 10.1021/acs.iecr.2c00431. [DOI] [Google Scholar]
- Davis T. L.; Benson R. D.; Roche S. L.; Scuta M. S. In Dynamic Reservoir Characterization of a CO2 Huff’n’Puff, Central Vacuum Unit, Lea County, New Mexico, SPE Annual Technical Conference and Exhibition; SPE: San Antonio, TX, 1997.
- Collins MA [USA] . Mechanism and Engineering Design of Carbon Dioxide Flooding; Petroleum Industry Press: Beijing, 1989; pp 82–138. [Google Scholar]
- Zhengzhang Z.; Jinhu D.. Tight Oil and Gas; Petroleum Industry Press: Beijing, 2012; pp 100–128. [Google Scholar]
- Wan T.; Sheng J. J.; Soliman M. Y. In Evaluate EOR Potential in Fractured Shale Oil Reservoirs by Cyclic Gas Injection, Unconventional Resources Technology Conference; Society of Exploration Geophysicists, American Association of Petroleum Geologists, Society of Petroleum Engineers: Denver, Colorado, USA, 2013; pp 1845–1854.
- Monger T. G.; Coma J. M. A Laboratory and Field Evaluation of the CO2 Huff’n’ Puff Process for Light-Oil Recovery. SPE Reservoir Eng. 1988, 3 (04), 1168–1176. 10.2118/15501-PA. [DOI] [Google Scholar]
- Ghaderi S. M.; Clarkson C. R.; Ghanizadeh A.; Barry K.; Fiorentino R. In Improved Oil Recovery in Tight Oil Formations: Results of Water Injection Operations and Gas Injection Sensitivities in the Bakken Formation of Southeast Saskatchewan, SPE Unconventional Resources Conference; SPE: Calgary, Alberta, Canada, 2017.
- Moridis G.; Reagan M. Evaluation of the Effectiveness of Continuous Gas Displacement for EOR in Hydraulically Fractured Shale Reservoirs. SPE J. 2021, 26 (04), 2068–2091. 10.2118/198999-PA. [DOI] [Google Scholar]
- Pospisil G.; Weddle P.; Strickland S.; McChesney J.; Tompkins K.; Neuroth T.; Pearson C. M.; Griffin L.; Kaier T.; Sorensen J.; Jin L.; Jiang T.; Pekot L.; Bosshart N.; Hawthorne S. In Report on the First Rich Gas EOR Cyclic Multiwell Huff N Puff Pilot in the Bakken Tight Oil Play, SPE Annual Technical Conference and Exhibition; SPE, 2020.
- Wang H.; Chen Z.; Chen S.; Hui G.; Kong B. Production Forecast and Optimization for Parent-Child Well Pattern in Unconventional Reservoirs. J. Pet. Sci. Eng. 2021, 203, 108899 10.1016/j.petrol.2021.108899. [DOI] [Google Scholar]
- Todd H. B.; Evans J. G. In Improved Oil Recovery IOR Pilot Projects in the Bakken Formation, SPE Low Perm Symposium; SPE: Denver, Colorado, USA, 2016.
- Hui G.; Chen Z.; Schultz R.; Chen S.; Song Z.; Zhang Z.; Song Y.; Wang H.; Wang M.; Gu F. Intricate Unconventional Fracture Networks Provide Fluid Diffusion Pathways to Reactivate Pre-Existing Faults in Unconventional Reservoirs. Energy 2023, 282, 128803 10.1016/j.energy.2023.128803. [DOI] [Google Scholar]
- Sheng J. J. Critical Review of Field EOR Projects in Shale and Tight Reservoirs. J. Pet. Sci. Eng. 2017, 159, 654–665. 10.1016/j.petrol.2017.09.022. [DOI] [Google Scholar]
- Hui G.; Chen Z.; Chen S.; Gu F. Hydraulic Fracturing-Induced Seismicity Characterization through Coupled Modeling of Stress and Fracture-Fault Systems. Adv. Geo-Energy Res. 2022, 6 (3), 269–270. 10.46690/ager.2022.03.11. [DOI] [Google Scholar]
- Weng X.; Kresse O.; Chuprakov D.; Cohen C.-E.; Prioul R.; Ganguly U. Applying Complex Fracture Model and Integrated Workflow in Unconventional Reservoirs. J. Pet. Sci. Eng. 2014, 124, 468–483. 10.1016/j.petrol.2014.09.021. [DOI] [Google Scholar]
- Hui G.; Chen S.; Gu F. Strike–Slip Fault Reactivation Triggered by Hydraulic-Natural Fracture Propagation during Fracturing Stimulations near Clark Lake, Alberta. Energy Fuels 2024, 38 (19), 18547–18555. 10.1021/acs.energyfuels.4c02894. [DOI] [Google Scholar]
- Jing G.; Chen Z.; Hui G. A Novel Model to Determine Gas Content in Naturally Fractured Shale. Fuel 2021, 306, 121714 10.1016/j.fuel.2021.121714. [DOI] [Google Scholar]


