Abstract
It is widely accepted that the γ relaxation of poly(methyl methacrylate) (PMMA) arises from the hindered rotational motion of the side chain around the C–C bond, which links to the main chain. However, the physical model to explain this process has been unknown. The hybrid density functional theory calculation showed that the PMMA intramolecular hindered rotation has an activation energy of 6.53 kcal/mol. This activation energy causes the friction coefficient to the intramolecule to hinder rotation. The qualitative value of the friction coefficient was evaluated on the basis of linear response theory by using the calculated value of the activation energy. The Lorentz model is adopted to calculate the complex dielectric constant of the γ relaxation using the calculated value of the friction coefficient. The calculated value of the complex dielectric constant agreed reasonably well with experimental results.
1. Introduction
Polymers present several relaxation processes that cause imaginary dielectric constants. These relaxation processes are usually named α, β, and γ. The terminology of α, β, and γ relaxation is somewhat vague because of the complex nature of polymers; however, the α processes are observed at lower frequencies or higher temperatures and are usually related to the dynamic glass transition, i.e., the main intermolecular internal friction mechanism due to micro Brownian translational movement of molecular chains. The typical relaxation time of α processes is in the order of pico-seconds, and many molecular dynamics (MD) studies have successfully simulated the processes both qualitatively and quantitatively. The MD methods are very suitable at simulating energy-relaxation phenomena in the relaxation time scale of pico-seconds.1−4
Relaxation known as β processes is observed at higher frequencies or lower temperatures and is typical of local motion such as the flip motion of the phenylene group. The last and the most unexplained relaxation, known as the γ process, has its origin in the molecular fluctuations of the chain segments such as intrarotations of side chains. The relaxation time of β process is smaller than that of γ processes, and much larger than that of α processes. Therefore, molecular dynamics simulations are very difficult in the case of the β or γ processes. A nearly complete physical model for energy relaxation was given by Debye about 100 years ago for the β or γ process.5,6 As far as the authors know, however, there are no quantitative evaluations for β or γ processes based on a clear physical model or a physical picture.
The Debye’s relaxation theory adopts the Arrhenius plot. The problem was that there were no theoretical methods to obtain quantitative values of activation energies at that time. Thus, Debye’s theory seems to have been forgotten in the field of polymer science for many years. We will get into this problem with molecular-level resolution. We study poly(methyl methacrylate) as a typical example. As shown below, we believe our arguments are not limited to this polymer only.
Poly(methyl methacrylate) (PMMA) is a polymer that has an intramolecular hindered rotational motion of the side chain around the C–C bond which links to the main chain. This intramolecular hindered rotation causes γ relaxation to PMMA. The PMMA structure is shown in Figure 1. The −C(CO)OCH3 is the main intramolecular rotator, which rotates around the C–C bond, linking to the main chain of PMMA.
Figure 1.
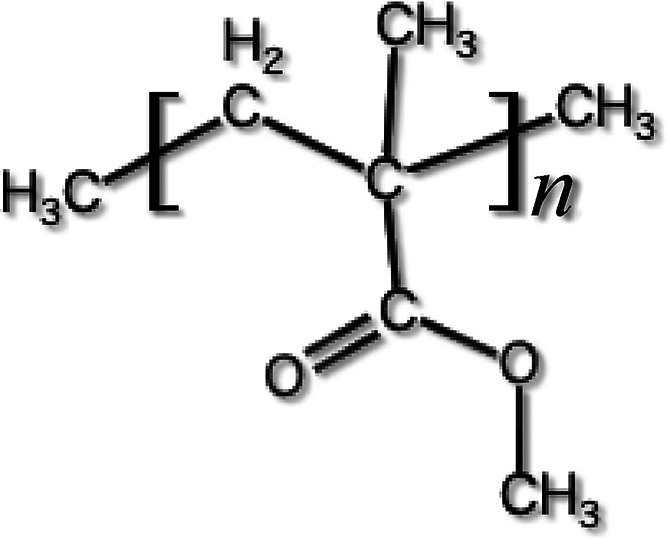
PMMA structure and main intramolecular rotator of −C(CO)OCH3.
The imaginary part of the complex dielectric constant causes the energy loss of an external electric field as a function of its frequency and the environmental temperature. When a temperature is fixed, the imaginary part of the complex dielectric constant has a peak at a frequency fmax. Teixeira et al. measured experimentally fmax for α, β, and γ relaxations of PMMA as a function of the temperature.7 The fmax signals of α, β, and γ relaxations are sharply separated from each other in their experimental results.7 However, the molecular-level explanation for γ relaxations still has to be clarified.
In our present study, hybrid density functional theory (DFT) calculation showed that the PMMA intramolecular rotator, −C(CO)OCH3, has an activation energy of 6.53 kcal/mol. This activation energy causes the friction coefficient to the intramolecule rotator. We used Debye’s relaxation model, almost as it is, to evaluate the value of the friction coefficient; that is, the activation energy, 6.53 kcal/mol, was used in Debye’s γ relaxation calculation. On the base of this friction coefficient, we adopted the Lorentz model to quantitatively evaluate the complex dielectric constant of the γ relaxation. The results of the calculation agreed well with the experimental results.
2. Methods
In this paper, quantum chemical calculations were carried out to analyze the intramolecular hindered rotation. All geometry optimization procedures were performed using the Gaussian16 program package8 with hybrid density functional theory (DFT) calculations.9 The exchange–correlation term was considered in the B3LYP functional.10−12 The 6-31G(d) basis set13,14 was adopted for all atoms.
3. Results and Discussion
The Activation Energy of Intramolecular Rotator
The model of the PMMA unit monomer is shown in Figure 2. Intramolecular rotator −C(CO)OCH3 rotates around the axis CB–CC. The simplified version of the monomer (CB is replaced by H) is shown in Figure 3. The moment of inertia I of the intramolecular rotator −C(CO)OCH3 around the axis CCHB is obtained by calculating the distance of the O, O, CH3 components of the rotator from the linear line (HB–CC), and is summed up (mass of the components)*(distance between the axis and the component).2 As a result, we get the moment of inertia I of the intramolecular rotator.
| 1 |
Figure 2.
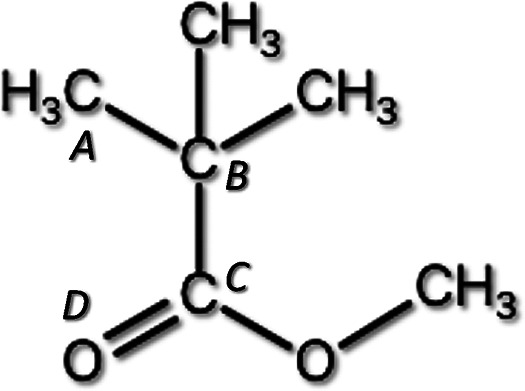
PMMA unit monomer.
Figure 3.
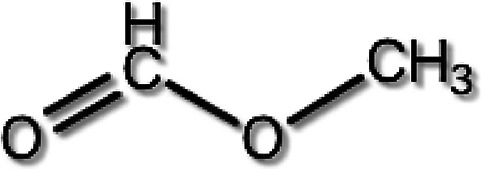
Simplified unit monomer.
The component of the dipole moment of −C(CO)OCH3 perpendicular to CB–CC is calculated as 1.36147 × 10⁻²⁹ SI.
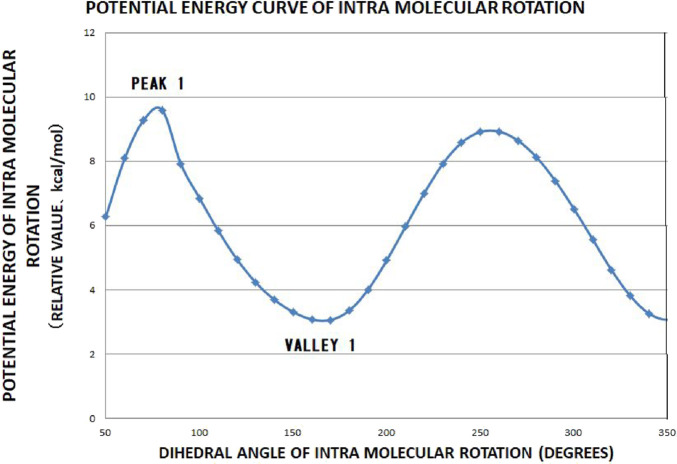
Then, we obtained the activation energy of the intramolecular hindered rotation. We performed a geometry optimization by using hybrid DFT to the trimer, as shown in Figure 4, in such a way that the dihedral angle CA–CB–CC–OD is swept by taking about 30 steps of 10 degrees. At each step, other degrees of freedom are optimized (Figure 5). The activation energy thus obtained ΔH is,
| 2 |
Figure 4.
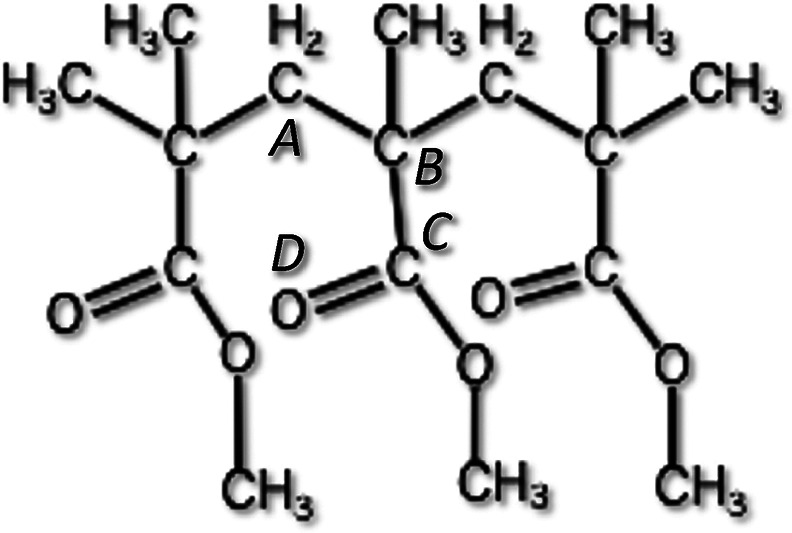
Trimer of unit of the PMMA.
Figure 5.
Potential energy curve of the intramolecular rotation calculated as a function of the dihedral angle CA-CB-CC-OD, shown in Figure 4. ΔH is calculated using PEAK 1 and VALLY 1 in this figure.
Here, we assume that the intramolecular rotator is regarded as a single mass point rotating around an axis. Let the average distance between the axis and the mass points be L. The mass m is assumed,
| 3 |
i.e., the mass m is estimated as half of the summation of the mass of O and OCH3.
On the basis of the basic mechanics, L satisfies the following equation,
| 4 |
| 5 |
The intramolecular rotational angular frequency, ω0 is
| 6 |
We can regard this rotator as a harmonic oscillator15 with the spring coefficient k which satisfies
| 7 |
From eqs 3, 6, and 7, we get the force constant k,
| 8 |
4. Evaluation of Friction Coefficient on the Basis of Linear Response Theory
We introduce here the simple linear response theory16 to derive the friction coefficient from the activation energy obtained above.
In simple linear response theory, as shown in Figure 6, a particle moves parallel to the X-axis. A potential well of depth ΔH is arranged periodically with an interval distance Lwell. It is assumed that a jump over a potential well is described by the mechanism of Arrhenius. Between neighboring wells, it is assumed that a particle makes a uniform linear ballistic motion without friction in the flat path between neighboring two potential wells. Under this assumption, it takes Tballistic seconds for the particle to travel the flat path Lwell. Also, we assume that it takes Tflat seconds for the particle to travel the flat path in the real system, in which a random walk may occur.
Figure 6.
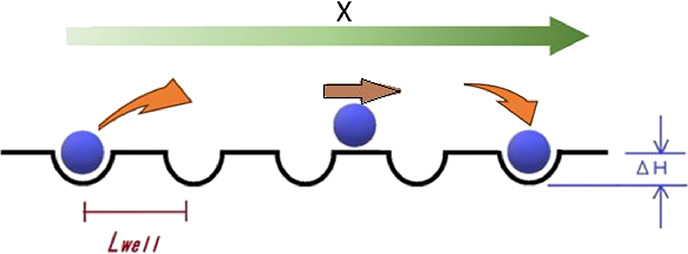
Schematic image for simple linear response theory.
In the present paper, we assume
| 9 |
We further assume that it takes Tescape seconds for the particle to escape from the potential well. We call the average time with which a particle travels one unit (one potential well plus neighboring one flat path) Tt.
| 10 |
The average velocity of the particle is
| 11 |
The friction coefficient is given by its definition,
| 12 |
where F is the external force. In the situation without any external force, the equation of Arrhenius is
| 13 |
where KB is the Boltzmann constant, and h is the Planck
constant.
In the situation that right to left direction external force exists,
we assume that the left potential well becomes shallower by  , and that the right potential well becomes
deeper by
  . In this situation, we can assume that
it takes Tescape_L_to_R seconds for a
particle to escape from the potential well from left to right, and
that it takes Tescape_R_to_L seconds for
a particle to escape from the potential well in the opposite direction.
Under these assumptions, we get right to left transition rate, RR_to_L
 |
14 |
also, left to right transition rate, RL_to_R
 |
15 |
Hereafter, we consider two cases, the low-temperature limit case and the high-temperature limit case. First, we describe a theory for low temperatures where it takes a long time for a particle to escape from a potential well,
| 16 |
When an external force F exists, and if the condition of eqs 4–8 is satisfied, (i.e., low-temperature case) the Tflat can be neglected and the following equation is valid, with Tt as the time for this process
| 17 |
| 18 |
When eq 16 is satisfied and in addition
| 19 |
is satisfied, eq 18 is approximated by the following equation,
| 20 |
From eq 20, we get the following equations.
| 21 |
By inserting eq 21 to eq 12, we get
| 22 |
Equation 22 shows that in the low temperature case where eq 16 is satisfied, Cfric_L_T decreases when the temperature increases.
Next, we apply a theory for high temperature where it takes only a short time for a particle to escape from a potential well, where
| 23 |
is satisfied (high temperature case).
When temperature is high, we assume that the particle which collides with a potential well penetrates it with the probability of 50%, and is reflected by the potential well with the probability of 50%. The thermal velocity is given by
| 24 |
where m is the mass of the particle. The acceleration of the particle under the external force F is
| 25 |
In the following discussion,
we assume that the velocity of the
particle just after it escapes from the potential well is zero. To
travel the flat path Lwell, it takes Lwell/vmacro seconds, where vmacro is
the macroscopic velocity of the particle. After traveling the flat
path Lwell, the velocity of the particle
will be Aacc × Lwell/vmacro. The average macroscopic
speed of the particle during traveling the flat path Lwell is, therefore, given by, . Here, we call the average macroscopic
speed of the particle during traveling the flat path Lwell, vmacro_average. Then, we can obtain the following,
| 26 |
Here, we make an approximation,
| 27 |
By inserting eq 27 to eq 26, we get
| 28 |
| 29 |
By inserting eq 25 to eq 29, we get
| 30 |
| 31 |
Therefore,
| 32 |
It should be noted that eqs 26 to 32 are valid only when we assume that the velocity of the particle just after escaping from the potential well is zero.
Thus, in the case of high temperature,
| 33 |
In this high temperature case, the value of the friction coefficient is independent of the temperature, contrary to the low temperature case 22.
Complex Dielectric Constant on the Basis of Lorentz Model
Let the electric charge of the oscillator q, and let the external electric field
| 34 |
The Lorents equation15 is given by
| 35 |
The static solution of eq 35 is
| 36 |
where A is given by
| 37 |
| 38 |
The polarizability is given by its definition as
| 39 |
where Nosc is the number of Lorentz-type oscillators in unit volume. By inserting eq 38 to eq 39, we get
| 40 |
By the definition of electric flux density,
| 41 |
where ε0 is the permittivity of vacuum. By definition of relative permittivity,
| 42 |
Inserting eq 41 into eq 42, we get
| 43 |
Notice that relative permittivity is composed of the real part and imaginary part, as follows;
| 44 |
When we insert eq 40 into eq 43, we obtain a full description of complex relative permittivity. Then, εr described by eq 44 gives the full description of complex relative permittivity, if we define εrreal and εrimaginary by
| 45 |
and
| 46 |
The angular frequency ωextmax, at which εrimaginary is maximum, satisfies;
| 47 |
Insering eq 46 to eq 47, we get the angular frequency
| 48 |
When
| 49 |
is satisfied, eq 5–15 is approximated as follows;
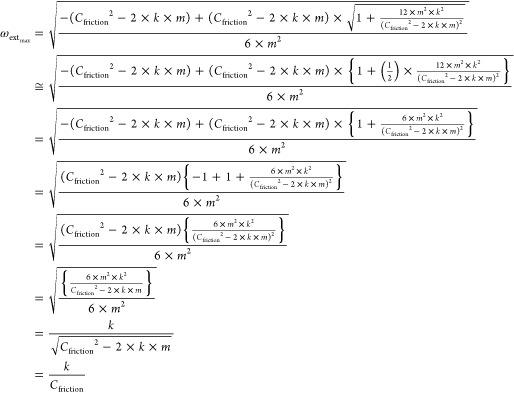 |
50 |
The frequency which makes εrimaginary maximum is
| 51 |
By inserting eq 22 to eq 51, we get
| 52 |
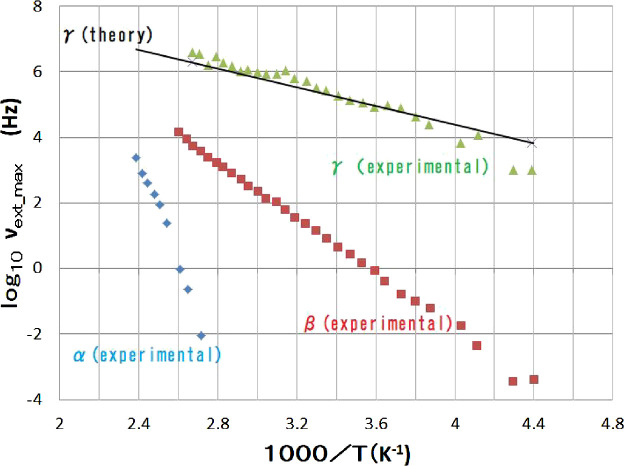
Summing up the arguments described above, we can finally show the behavior of γ relaxation as a function of the temperature. In Figure 7, the frequency giving the maximum imaginary dielectric constant is shown as a function of the temperature, where
| 53 |
is assumed. Here, π is the circle ratio, and the value of L is given by eq 5. Thus, obtained black line is plotted according to eq 52 wherein the ΔH is given by hybrid DFT calculations. Other plots in Figure 7 show data from the results of the experiment.7 The results obtained owing to Debye’s theory, linear response theory, Lorentz model, and the hybrid DFT calculation reasonably reproduced consistently the experimental data.7 Considering the complexity of the molecular level situation in polymer, this consistency justifies our arguments mentioned above. The simplified picture shown in Figure 6 reflects an essence of the complicated interactions in polymer, which is obtained in γ relaxation. Due to the complexity of the phenomenon, we are obliged to introduce many approximations onto various nontrivial processes. All of these approximations are at the zeroth or first order; however, they are not irrational. This is why we obtained the correct results.
Figure 7.
Frequency, νext_max, gives the maximum imaginary dielectric constant. Black line shows the result of the present theoretical calculation (eqs 5–19). Other dots are the results of experiment.7
6. Conclusions
It is well established that MD simulations make a good theoretical analysis for α relaxation processes of polymers. As for the β relaxation, although the MD is also difficult, it is understood as a local motion. The relaxation time of γ relaxation processes, however, is usually much larger than that of α relaxation processes, and therefore, molecular dynamics simulations are very difficult in the case of γ relaxation processes. The mathematical calculations in the present paper show that the Lorentz model and Debye’s theory combined with hybrid DFT calculations on the basis of linear response theory give a good theoretical evaluation for γ relaxation processes of PMMA. We present a physical image of γ relaxation, which was ambiguous for a long time.
In the present stage of our study, it is not so clear how formula 26 should be modified if we want to expand the scheme to the other cases. Experimental and theoretical examination in the high-temperature cases will be necessary to test the validity of formula 26. In other words, the compatibility of formula 26, which seems to be based on the random walk model, should be experimentally checked at higher temperatures.
The Arrhenius equation is used to derive eq 22. This means that each atom or each functional group vibrates around a fixed point within the molecule. Those molecules would have low fluidity, which indicates similarity to a glass state. Equation 31 is derived from a simple random walk model, which suggests a ladder network model of rubber viscoelasticity, even though the present model does not include a polymer chain. It is suggested that a glass transition-like effect occurs between conditions of eq 22 and conditions of eq 31, but details are not clarified in the present study. To clarify this point, further experimental and theoretical research will need to be closely coordinated in the future.
In Figure 7, the discrepancy between the experimental value and theoretical predictions for gamma becomes more pronounced as the temperature decreases. This indicates that the calculated value underestimates the absolute value of νextmax, and that the plot of the experimental values shows a steep slope in the low-temperature range and a more gradual slope in the high-temperature range.
To improve the accuracy of the calculated value of νextmax, a more comprehensive molecular model than that shown in Figure 4 would be necessary. In addition, a more sophisticated model than the Arrhenius equation, such as absolute reaction rate theory, would also be necessary.
The experimental results show a steep slope in the low-temperature range and a more gradual slope in the high-temperature range. This suggests that the phenomenon is almost entirely explained by eq 22, which has a steep temperature dependence in the low-temperature range. However, in the high-temperature range, the influence of eq 31, which has a gradual temperature dependence, starts to mix in, causing the temperature dependence of the plot of the experimental values to begin to be more gradual.
Acknowledgments
The authors thank Dr. Shinichi Higai for his encouragement and valuable discussion from the viewpoint of the sustainable society. We acknowledge KAKETSUKEN.
The authors declare no competing financial interest.
References
- Karasawa N.; Goddard W. A. III Dielectric Properties of Poly(vinylidene fluoride) from Molecular Dynamics Simulations. Macromolecules 1995, 28 (6765), 6765–6772. 10.1021/ma00124a010. [DOI] [Google Scholar]
- Hancock S. B.; Landau D. P.; Aghamiri N. A.; Abate Y. Langevin Dynamics/Monte Carlo Simulations Method for Calculating Nanoscale Dielectric Functions of Materials. Phys. Rev. Mater. 2022, 6, 076001 10.1103/PhysRevMaterials.6.076001. [DOI] [Google Scholar]
- Zhang Z. A Universal Dielectric Constant Calculation Method for Copolymers. Computational and Theoretical Chemistry 2022, 1208, 113528 10.1016/j.comptc.2021.113528. [DOI] [Google Scholar]
- Wu R.; Kong B.; Yang X. Conformational Transition Characterization of Glass Transition Behavior of Polymers. Polymer 2009, 50 (14), 3396–3402. 10.1016/j.polymer.2009.05.013. [DOI] [Google Scholar]
- Debye P. J. W.Polare Molekeln; Leipzig, Germany: S.Hizel, 1929. [Google Scholar]
- Anelastic and Dielectric Effects in Polymeric Solids; McCrum N. G.; Read B. E.; Williams G., Eds.; JOHN WILEY & SONS: London, U. K., 1967. [Google Scholar]
- Teixeira S. S.; Dias C. J.; Dionisio M.; Costa L. C. New Method to Analyze Dielectric Relaxation Processes: a Study on Polymethacrylate Series. Polym. Int. 2013, 62 (12), 1744–1749. 10.1002/pi.4479. [DOI] [Google Scholar]
- Frisch M. J.; Trucks G. W.; Schlegel H. B.; Scuseria G. E.; Robb M. A.; Cheeseman J. R.; Scalmani G; Barone V.; Petersson G. A.; Nakatsuji H.; Li X.; Caricato M.; Marenich A. V.; Bloino J.; Janesko B. G.; Gomperts R.; Mennucci B.; Hratchian H. P.; Ortiz J. V.; Izmaylov I. F.; Sonnenberg J. L.; Williams-Young D.; Ding G.; Lipparini F.; Egidi F.; Goings J.; Peng B.; Petrone A.; Henderson T.; Ranasinghe D.; Zakrzewski V. G.; Gao J.; Rega N.; Zheng G.; Liang W.; Hada M.; Ehara M.; Toyota K.; Fukuda R.; Hasegawa J.; Ishida M.; Nakajima T.; Honda Y; Kitao O.; Nakai H.; Vreven T.; Throssell K.; Montgomery J. A.; Peralta J. E.; Ogliaro F.; Bearpark M. J.; Heyd J. J.; Brothers E. N.; Kudin K. N.; Staroverov V. N.; Keith TA; Kobayashi R; Normand J; Raghavachari K.; Rendell A. P.; Burant J. C.; Iyengar S. S.; Tomasi J; Cossi M; Millam J. M.; Klene M.; Adamo C.; Cammi R.; Ochterski J. W.; Martin R. L.; Morokuma K.; Farkas O.; Foresman J.B.; Fox D. J., Gaussian 16, Revision A.03; Gaussian, Inc., Wallingford CT, 2016. [Google Scholar]
- Hohenberg P.; Kohn W. Inhomogeneous Electron Gas. Phys. Rev. 1964, 136, B864–B870. 10.1103/PhysRev.136.B864. [DOI] [Google Scholar]
- Becke A. D. III. The Role of Exact Exchange. J. Chem. Phys. 1993, 98, 5648–5652. 10.1063/1.464913. [DOI] [Google Scholar]
- Becke A. D. Density-functional exchange-energy approximation with correct asymptotic behavior. Phys. Rev. A 1988, 38, 3098–3100. 10.1103/PhysRevA.38.3098. [DOI] [PubMed] [Google Scholar]
- Lee C.; Yang W. T.; Parr R. G. Development of the ColicSalvetti Correlation-Energy Formula into a Functional of the Electron Density. Phys. Rev. B 1988, 37, 785–789. 10.1103/PhysRevB.37.785. [DOI] [PubMed] [Google Scholar]
- Hariharan P. C.; Pople J. A. The influence of polarization functions on molecular orbital hydrogenation energies. Theor. Chim. Acta 1973, 28, 213–222. 10.1007/BF00533485. [DOI] [Google Scholar]
- Francl M. M.; Pietro W. J.; Hehre W. J.; Binkley J. S.; Gordon M. S.; Defrees D. J.; Pople J. A. Self-Consistent Molecular Orbital Methods. XXIII. A Polarization-Type Basis Set for Second-Row Elements. J. Chem. Phys. 1982, 77, 3654–3665. 10.1063/1.444267. [DOI] [Google Scholar]
- Towns C. H.; Schawlow A. L.; Microwave Spectroscopy; DOVER PUBLICATIONS, INC.: NEW YORK, U.S.A., 1975. [Google Scholar]
- Ryogo K.; Daigaku Enshu Neturikigaku Toukeirikigaku (In Japanese) (Problems in Thermodynamics and Statistical Mechanics for Exercises for College Students) ; Tokyo, Japan, Shokabo, 1961. [Google Scholar]


