

Abstract
Our purpose was to provide an understanding of current functional lung imaging (FLI) techniques and their potential to improve dosimetry and outcomes for patients with lung cancer receiving radiation therapy (RT). Excerpta Medica dataBASE (EMBASE), PubMed, and Cochrane Library were searched from 1990 until April 2023. Articles were included if they reported on FLI in one of: techniques, incorporation into RT planning for lung cancer, or quantification of RT-related outcomes for patients with lung cancer. Studies involving all RT modalities, including stereotactic body RT and particle therapy, were included. Meta-analyses were conducted to investigate differences in dose-function parameters between anatomic and functional RT planning techniques, as well as to investigate correlations of dose-function parameters with grade 2+ radiation pneumonitis (RP). One hundred seventy-eight studies were included in the narrative synthesis. We report on FLI modalities, dose-response quantification, functional lung (FL) definitions, FL avoidance techniques, and correlations between FL irradiation and toxicity. Meta-analysis results show that FL avoidance planning gives statistically significant absolute reductions of 3.22% to the fraction of well-ventilated lung receiving 20 Gy or more, 3.52% to the fraction of well-perfused lung receiving 20 Gy or more, 1.3 Gy to the mean dose to the well-ventilated lung, and 2.41 Gy to the mean dose to the well-perfused lung. Increases in the threshold value for defining FL are associated with decreases in functional parameters. For intensity modulated RT and volumetric modulated arc therapy, avoidance planning results in a 13% rate of grade 2+ RP, which is reduced compared with results from conventional planning cohorts. A trend of increased predictive ability for grade 2+ RP was seen in models using FL information but was not statistically significant. FLI shows promise as a method to spare FL during thoracic RT, but interventional trials related to FL avoidance planning are sparse. Such trials are critical to understanding the effect of FL avoidance planning on toxicity reduction and patient outcomes.
Introduction
Lung cancer is the leading cause of cancer mortality globally, with a 5-year relative survival rate of 10% to 20%.1 Radiation therapy (RT) is a cornerstone of management in localized lung cancer.2 Radiation-induced lung toxicities (RILT) are common side effects caused by damage to healthy lung tissue and can result in morbidity, reduced quality of life, and compromised oncological outcomes.3
Functional lung imaging (FLI) is an umbrella term for lung imaging modalities that characterize regions of lung that contribute to lung function – usually, ventilation (V) or perfusion (Q). These modalities highlight regions of functional importance to gas exchange.4 There has been growing interest in the use of FLI to enhance RT treatment planning.4 An example of one such plan is seen in Figure 1, wherein, compared with a standard plan, the FLI-guided plan spares regions of higher function in the left lung. The logic behind incorporating FLI into RT planning is to prioritize protection of lung tissues preferentially involved in gas exchange, potentially leading to reduced toxicity and improved functional outcomes.4 Unfortunately, most FLI modalities necessitate additional imaging, which can pose a substantial cost barrier and requires the synthesis of multiple imaging types, which can be challenging. Furthermore, at the moment, a lack of exploration into the optimal modality of FLI, as well as inconsistency between attempts to implement FLI in clinical RT planning, mean that the benefit of FLI to patient outcomes is not yet well-elucidated. There is thus a strong incentive for an in-depth exploration of the potential benefit FLI may have to determine whether it is a worthwhile addition to the care of patients with lung cancer.
Fig. 1.

Example anatomic and functional avoidance radiation therapy plans. The functional plan demonstrates decreased irradiation of the high-functioning areas in the left lung.
There have been many studies exploring best methods for FLI, incorporating FLI into RT planning and correlating FLI-based parameters with RILT. Such studies use varying methods, definitions of functional lung (FL), and RT delivery modalities, with significant variability in techniques and results. The last review article to synthesize these data, by Bucknell et al,4 was published in 2018. Since then, many new studies on FLI and RT have been published, including a substantial increase in observational data and the advent of prospective clinical trial data. This warrants an in-depth, updated examination of FLI for treatment-planning, including novel analyses and the integration of new data into previous analyses.
This review article has 2 main objectives: assess improvements in FL irradiation for plans that incorporate FLI compared with plans that do not and assess correlations between FL irradiation and RILT. Secondarily, this article reports on FLI modalities, definitions of FLI, and dose-response relationships between irradiated FL and measures of lung function.
Methods and Materials
Literature review
The review is in concordance with Preferred Reporting Items for Systematic Reviews and Meta-Analyses (PRISMA) guidelines and was registered on the International Prospective Register of Systematic Reviews (PROSPERO) (CRD42022349032). PubMed, Excerpta Medica dataBASE (EMBASE), and Cochrane Library were searched from 1990 to April 2023, in English. The full protocol for the search strategy and screening criteria are available in supplementary material E1.
Title and abstract screening were conducted in-duplicate and independently by 2 review authors (JM and RS). Studies were included if they mentioned FLI modalities in any capacity related to adult lung cancer. Studies that reported on multiple types of cancer to the thorax, including lung cancer, were kept. Conflicts were resolved by a senior author (SR). At the full-text stage, the 2 reviewers screened the studies. Inclusion criteria were any paper detailing FLI methods for imaging patients with lung cancer treated with RT; FLI to inform RT planning for lung cancer; FLI-based quantification of change in lung function or development of toxicity due to RT in lung cancer; and using FLI to predict or correlate with any RILT in patients with lung cancer. Exclusion criteria were protocols, reviews, abstracts, or conference presentations; failure to report in the context of lung cancer; pediatric population related to anything other than technical details of FLI modalities; and regional perfusion quantification not related to identifying functional lung. Conflicts were again resolved by SR. Reference lists in included articles were then screened for additional sources. For all statistical analyses, risk of bias assessment was conducted in the form of the appropriate JBI checklist.
Data collection
Data were collected twice in a predefined collection form, in-duplicate, and cross-checked. Items of note included FLI modality, study type, study population descriptors and size, FL definition, and any relevant outcome related to the study objective. Detailed headers for data extraction can be found in E2.
Functional avoidance planning: Meta-analysis, sensitivity, and metaregression
The effect of RT on FL is assessed via dose-function metrics, which measure the dose of radiation to FL specifically. A meta-analysis was conducted to compare the mean difference of dose-functional parameters between functional plans, which minimize dose to FL, and anatomic (standard) plans. Included studies reported the unadjusted parameters of interest or patient data from which we calculated the parameters required. For studies that reported the relevant parameters individually for functional and anatomic plans, we used the provided P values and knowledge of the significance test used to impute the information. If not provided, we read numerical results from figures. If this was not possible, for studies where only medians and ranges/IQRs were available, we used previously established methods5,6 to calculate the required information. Barring these, we contacted corresponding authors for appropriate summary statistics. Some studies reported multiple outcomes for different RT modalities and definitions of FL. In these cases, we chose to include the best result (lowest P value, followed by greatest difference), while maintaining consistency between different techniques for the same study: if we chose 1 modality or definition for 1 parameter, we would use the same one for all other parameters from that study. Studies were excluded if they did not use V- or Q-imaging or if they failed to provide sufficient data to calculate dose-function parameters via one of the previously mentioned methods. Studies were also excluded if they had identical or sufficiently similar patient populations to larger studies. Papers where entire data sets of plans were deemed clinically unacceptable or had average planning target volume (PTV) under 80% were discarded. When corresponding data were provided, individual cases with PTV coverage under 80% were deemed clinically unacceptable and were excluded.
To assess the effect of the choice of specific FL definitions on functional dosimetry, we performed a sensitivity analysis and metaregression on eligible studies in the meta-analysis. First, we repeated the meta-analysis, swapping out definitions of FL for studies that reported the same parameters using multiple different definitions, and compared the results of the altered and original analyses. To further elucidate the influence these definitions have, we then took only studies that optimized their RT plans using a specific, thresholded definition of FL, and categorized them as high or low threshold using a predefined cutoff of 30% or 30th percentile and 70% or 70th percentile. The intermediate range was excluded to account for the difference between percentile and percentage threshold definitions. We performed metaregression between these 2 categories, to see if there were significant differences in dose-function parameters between the 2 groups.
Radiation pneumonitis: Meta-analyses
We first assessed the predictive power of dose-function parameters to the incidence of grade 2+ radiation pneumonitis (RP) by comparing the ability of models to predict grade 2+ RP between those that used only anatomic information and those that incorporated functional information (V or Q separately). We did this through the area under the receiver operating characteristic curve (AUC) statistic for prediction of grade 2+ RP. Studies were included if they assessed the predictive ability of a model that predicted only grade 2+ RP. Studies that reported more broadly on other grades of RP, or which did not provide enough statistical information, were excluded. For studies that reported multiple models, we selected the best model available in each category. We then meta-analyzed the 3 groups of AUC values: anatomic, V, and Q, to determine whether functional information enhanced prediction of grade 2+ RP.
Finally, we collated all studies that used interventional avoidance planning and reported their rate of grade 2+ RP and performed a meta-analysis of the rate of grade 2+ RP. The details of this and all aforementioned analyses can be found in E3.
Results
Of the 2550 studies that were screened, 178 were deemed relevant to the review. The detailed breakdown of screening can be seen in Figure EA.
FLI modalities
There are many FLI modalities, which vary widely in technique and information obtained. Sixty-one papers described in detail, assessed performance of, or compared different modalities of FLI:
Single-photon emission computed tomography (SPECT): V or Q. Sixteen studies reported for perfusion7–22 and 14 for ventilation.9,10,13,17,22–31
Computed tomography (CT): referring to approaches to derive FL images from CT scans. The two main groups of methods for V are Jacobian-based10,13,23–26,28,29,30,32–42,43,44,45 (23 studies) and Hounsfield unit (HU)-based10,12,24–26,28–30,32,34,35,38,40,41,46,43,47–49 (19 studies). Twenty other methods were also reported for V.24–28,33,39,41,43,44,49,45,50–57 Even within their subcategories, CT-V methods are heterogeneous: the studies listed use a variety of techniques and forms of image registration, resulting in different performance characteristics.10,23–26,28–30,34–36,38,40,41,43,45,52 Q CT was less common, with 5 studies reporting in total.11,14,15,16,20
Positron emission tomography (PET): V or Q: 6 studies reported for Q58–63 and 10 studies reported for V.34,38,40,55,58–61,62,64 All studies, V and Q, used 68Ga-PET.
Magnetic resonance imaging (MRI): all ventilation, using either helium or xenon (Xe). Five studies were found.43,46,65–67
Dual energy CT (DECT): perfusion only. Three studies were found.7,11,63
Seven studies reported on FLI methods that were not V or Q based.21,24,31,47,52,64,68,69 These consisted of planar imaging,47 various surrogates for identifying diseased regions of lung,64,68,69 incorporating tumor anatomy,21,31 and stress mapping.24,52
Table E1 details all comparisons of other FLI modalities to SPECT. Given that CTs are obtained as standard of care for diagnostics and RT planning, there appears to be substantial interest in development of robust, CT-derived FLI methods. Nine papers in Table EA compared various CT-V methods derived from routine CT scans to SPECT V.10,13,24–26,28–30,36 The performance of Jacobian, HU, and other methods is variable, with Spearman coefficients (rs) as high as 0.8223 and as low as −0.02.10 No 1 method was consistently superior compared with the others, and no 1 method was consistent in Dice similarity coefficient or rs. Four studies compared CT-V with SPECT Q,8,10,12,13 with all correlations and comparative statistics found to be significant. One study reported on Xe-CT versus SPECT V and found that only 3 of 11 patients had a significant correlation to the SPECT V scan.27 A more general 2019 review was published on the subject of CT-V imaging, which contains CT-derived FLI compared with all other FLI modalities, with similar, variable results.70 CT-Q was less frequently studied, with only 4 (Table E1) papers comparing it to SPECT-Q.14–16,58 All correlations were significant and as low as 0.57.58 The other modality compared with SPECT was DECT.7,11 Although only 2 papers compared the efficacy of these methods, both found strong correlations (r ≥ 0.89).7,11
Interestingly, although both V and Q SPECT appear to be the standard for FLI in patients with thoracic cancer, Forghani et al9 found only modest correlations between them. They suggest that this discrepancy may be because of a small sample size, which prevented their comparisons from accounting for a wide variety of functional defects.9 Complementing this, Yuan et al22 found that 39% of patients had sufficient differences between V and Q SPECT scans, and that they would benefit from incorporating both into functional avoidance plans. Nakajima et al12 similarly found that radiation doses to ventilated regions were consistently and significantly higher than to perfused regions, indicating that they do not occupy identical space.
Defining FL
In total, 95 studies defined FL via a threshold: using SPECT counts, image intensity, or some other metric, they determined a cutoff value of V or Q, above which tissue was considered to be functional.8–11,13–16,18,19,21,24–26,28–30,32,34,39–42,45,50,53,55,57–60,62,66,69,71–131 Thirteen studies had a physician or software annotate FL contours.7,17,22,46,48,83,131–137 Five studies used all lung tissue that was positive on the scan.54,67,126,138,139 Thirty-four studies used a weighting method7,12,31,44,50,56,73,78,81,83,90,96,97,99,104,108,117,118,121,123,126,127,129,140–150: instead of using a threshold or contour, the entire lung was weighted by the image intensity in each pixel. As such, there are no functional and nonfunctional lung classifications, but rather each voxel has a unique level of function relative to the others. This is a substantially different definition of FL compared with the thresholding method. Seven studies defined FL in a manner unrelated to V or Q.39,64,68,69,126,128,151 A table of definitions used in each study is included in Table E2.
Supporting data on optimal choice of FL are sparse. A comparison between threshold and weighted methods revealed superior AUC and odds ratios (significance not provided) for parameters derived using the thresholding method,72 in the context of predicting RP. Within thresholding methods, a theme that emerged was the correlation of certain thresholds with RILT development: Farr et al87 chose a 40th percentile threshold for this reason, and Ieko et al93 chose a 20th percentile by the same logic, as did Ding et al.73 A lower-end threshold was not, however, always the most predictive. Dhami et al84 found that a 70th-percentile threshold was the most predictive for grade 2+ RP. Similarly, Faught et al90 found that their best predictive models used a threshold at the 69th percentile, though they also showed minimal variation between AUC values for different thresholds.
Regarding robustness, although a lack of data for non-CT-based methods prevented us from analyzing the robustness of thresholding in various FLI modalities, it is worth noting that Siva et al112 found only a marginal difference in dose-function parameters when thresholding ventilated lung at 70% rather than 50% of the maximum value. For perfusion, Shioyama et al110 and Farr et al87 both found that for SPECT Q, changing the minimum cutoff value for defining a lung as functional still allowed for a significant improvement to dose-functional parameters with functional planning. The same was found by Lucia et al116 for Ga-PET Q. None of these studies aside from Siva et al performed a direct comparison between thresholds.
Dose-response relationships
Generally, it was found that FL distribution changes after irradiation. Several studies explored changes in Q59,72,74,76,82,102,106,152–166 or V.37,44,51,57,66,67,74,75,82,98,106,138,148,164,165,167–170 Though not always significantly, lung function in irradiated regions was usually found to worsen,37,51,57,59,66,72,82,98,102,153–161,163,164,167,169–171 except in regions to which function was shunted72,102,154,155,169 or where tumor shrinkage restored air or blood flow.74,75,82,138,148,156,157,161,164,165,170
These results were not, however, always tied to other metrics of lung function. Abratt and Willcox158,159 did not find correlations between changes in perfusion and changes in pulmonary function test (PFT) results; however, several other studies did.168,169,171 Marks et al172 specifically found that the odds of PFT improvement after RT increases only if the tumor is central with adjacent hypoperfusion. Others found a correlation between single-acquisition FLI and various PFT results (including forced expiratory volume and diffusing capacity of the lungs for carbon monoxide).30,35,48,50,58,62,67,100,128,132,136,152,169,173–175 Multiple studies found correlations between dose-function metrics and changes in PFT scores.166,176,177
Functional lung avoidance: Treatment planning
Fifty-nine studies tested the idea of pretreatment avoidance planning to preferentially spare FL tissue and preserve lung health during RT.18,21,31,39,53,54,57,64,68,69,71,76,77,80,81,83,85–89,91–95,97,107–120,122,127,129,131,133–137,139,145,146,148–151,162,165,178 Of these, 48 studies compared pairwise RT plans for real (nonsimulated) patients, 1 of which was optimized using objectives intended to spare standard organs at risk (OARs) and meet standard criteria, and 1 of which used additional objectives pertaining to minimizing damage to FL for the same RT modality and in the same patient.21,31,39,53,57,64,68,69,71,76,77,81,83,85–87,89,91,92,97,113–120,122,127,131,133–137,139,145,146,148–151 From these, studies that provided data on dose-function parameters specifically can be seen in Table 1. We did not include results relating changes in dose-function parameters to change in incidence or risk of RILT, as these results are better summarized in the subsequent section (Table 2). Most, but not all, functional plans resulted in a reduction in functional parameters: mean dose to functional lung (fMLD) and percent volume of functional lung receiving ≥ xGy of irradiation (fVx). RT modalities of these studies varied widely and included various dose/fractionation schedules, including stereotactic body RT (SBRT). Three studies reported on SBRT specifically and found that avoidance planning for SBRT similarly results in a reduction in functional parameters, with the exception of fV13.5 for Vicente et al.57,116,120 Some studies had a mix of schedules in their cohorts and did not break down results by technique/fractionation. As such, we did not have enough information to characterize the effect of this on our results.
Table 1.
Comparison of functional parameters, PTV, and OARs for pairwise anatomic and functional-avoidance RT plans
| Study first author | N | Age | Cancer type | FLI modality: Definition | RT modality | Dose-function parameters: Absolute reduction (anatomic - functional, mean difference) | Plan quality: Significant results (anatomic - functional) | |
|---|---|---|---|---|---|---|---|---|
| Agrawal137 | 11 | N/A | All NSCLC | SPECT Q: Visual thresholding into 2 groups | 3DCRT | fV20 ↓ 5.45 fV30 ↓ 7.54* fMLD ↓ 7.72* |
V20 ↓ 5.86* V20 ↓ 7.59* MLD ↓ 7.76* |
|
| Christian83 | 6 | N/A | All NSCLC | SPECT Q: Visual thresholding into 2 groups; weighting | 3DCRT | fV20 ↓ 0.807 (coplanar) fV20 ↓ 0.597 (noncoplanar) fMLD ↓ 0.325 (coplanar) fMLD ↑ 0.378 (noncoplanar) Mean perfusion-weighted lung dose (MPWLD): ↓ 0.03 (coplanar) MPWLD: ↑ 0.118 (noncoplanar) |
No significant difference | |
| Ding85 | 10 | 58.5 (med) | All NSCLC | Xe-MRI V: Thresholded into 4 groups (unspecified) | IMRT | fV5 ↓ 3.5* fV10 ↓ 2.7* fV20 ↓ 1.5* fMLD ↓ 0.7 |
No significant difference | |
| Doi151 | 12 | 66 (med) | Malignant pleural mesothelioma (MPM) | CT V: Direct thresholding at −860 HU | VMAT | Medians reported fV5 ↓ 9.8* fV10 ↓ 4.9* fV20 ↓ (difference not reported) fMLD ↓ 0.6* |
Medians reported V5 ↓ 9.8* MLD ↓0.6* |
|
| Dougherty86 | 31 | 64 (med) | 26 NSCLC 5 SCLC |
CT V (HU): 15% of max, with further processing | IMPT VMAT | fV5 ↓ 2.1* (VMAT) fV5 ↓ 1.52* (IMPT) fV10 ↓ 8.88* (VMAT) fV10 ↓ 4.27* (IMPT) fV20 ↓ 3.72* (VMAT) fV20 ↓ 4.11* (IMPT) fV30 ↓ 2.01* (VMAT) fV30 ↓ 2.6* (IMPT) fV40 ↓ 1.26* (VMAT) fV40 ↓ 1.69* (IMPT) fV50 ↓ 0.51 (VMAT) fV50 ↓ 0.96* (IMPT) fMLD[RBE] ↓ 1.56* (VMAT) fMLD[RBE] ↓ 1.51* (IMPT) |
CTV max ↑ 0.77* (IMPT) CI ↓ 0.07* (VMAT) CI ↓ 0.08* (IMPT) HI ↑ 0.01* (VMAT) HI ↑ 0.01* (IMPT) MLD ↓ 0.86* (VMAT) MLD ↓ 0.95* (IMPT) V20 ↓ 2.07* (VMAT) V20 ↓ 2.48* (IMPT) V5 ↓ 1.91* (VMAT) V5 ↓ 2.13* (IMPT) Mean esophagus ↓ 0.69* (VMAT) |
|
| Farr87 | 15 | 71 (med) | 12 NSCLC 1 SCLC 2 other |
SPECT Q: 20%, 40%, 60%, and 80% of max | IMRT VMAT 3DCRT |
20% threshold fV5 ↑ 0.41 (IMRT) fV5 ↓ 0.85 (VMAT) fV5 ↑ 1.86 (3DCRT) fV20 ↓ 2.69* (IMRT) fV20 ↓ 1.89* (VMAT) fV20 ↓ 0.14 (3DCRT) fV30 ↓ 1.35* (IMRT) fV30 ↓ 0.24 (VMAT) fV30 ↓ 1.09 (3DCRT) fMLD ↓ 0.75* (IMRT) fMLD ↓ 0.43 (VMAT) fMLD ↑ 0.26 (3DCRT) 40% threshold fV5 ↓ 1.74 (IMRT) fV5 ↓ 2.05 (VMAT) fV5 ↑ 1.78 (3DCRT) fV20 ↓ 5.24* (IMRT) fV20 ↓ 4.52* (VMAT) fV20 ↓ 2.73* (3DCRT) fV30 ↓ 3.03* (IMRT) fV30 ↓ 1.67 (VMAT) fV30 ↓ 3.25 (3DCRT) fMLD ↓ 1.73* (IMRT) fMLD ↓ 1.18* (VMAT) fMLD ↓ 0.37 (3DCRT) 60% threshold fV5 ↓ 6.5* (IMRT) fV5 ↓ 3.15 (VMAT) fV5 ↑ 2.27 (3DCRT) fV20 ↓ 4.95* (IMRT) fV20 ↓ 5.57* (VMAT) fV20 ↓ 2.21 (3DCRT) fV30 ↓ 3.36 (IMRT) fV30 ↓ 1.85 (VMAT) fV30 ↓ 2.17 (3DCRT) fMLD ↓ 2.15* (IMRT) fMLD ↓ 1.57* (VMAT) fMLD ↓ 0.13 (3DCRT) 80% threshold fV5 ↓ 9.5* (IMRT) fV5 ↓ 2.92 (VMAT) fV5 ↑ 0.31 (3DCRT) fV20 ↓ 3.36* (IMRT) fV20 ↓ 4.64 (VMAT) fV20 ↓ 2.78 (3DCRT) fV30 ↓ 1.86 (IMRT) fV30 ↓ 3.62 (VMAT) fV30 ↓ 2.53 (3DCRT) fMLD ↓ 2.3* (IMRT) fMLD ↓ 1.73* (VMAT) fMLD ↓ 0.52 (3DCRT) |
V20 ↓ 2.02* (IMRT) V30 ↓ 1.03* (IMRT) Esophagus V60 ↓ 1.5* (IMRT) Esophagus V60 ↑ 1.29* (VMAT) |
|
| Faught89 | 70 | N/A | All NSCLC | CT V (HU): 15% below average lung function | IMRT | Significance not reported fV5 ↓ 4 fV10 ↓ 6.2 fV20 ↓ 3.3 fV30 ↓ 4.3 fMLD ↓ 1.2 |
Significance not reported Cord max ↑ 3.43 V20 ↓ 0.98 MLD ↓ 0.08 Mean esophagus ↓ 0.17 Heart V60 ↑ 0.11 Heart V45 ↑ 1.63 Heart V40 ↑ 3.18 |
|
| Feng39 | 20 | 64 (med) | All lung cancer | CT V (Jacobian with density): Jacobian thresholded at 60% and 30%-60% of max; density thresholded at >−700 HU and −850 to 701 HU | IMRT | Jacobian fV5 ↓ 2.07* fV20 ↓ 1.82* fV30 ↓ 0.88* fVMLD ↓ 0.59* Density fV5 ↓ 2.16* fV20 ↓ 2.16* fV30 ↓ 1.1* fMLD ↓ 0.57* |
V5 ↓ 1.48* V20 ↓ 2.26* V30 ↓ 0.48* MLD ↓ 0.37* PTV mean ↑ 0.59* PTV D2 ↑ 1.07* PTV D98 ↓ 0.54* CI ↓ 0.06* HI ↑ 0.02* |
|
| Greco91 | 9 | 72 (med) | All lung cancer | SPECT Q: Thresholded at 70% and 40%-70% of max | 3DCRT | fV20 ↓ 7* ipsi-fV20 ↓ 16* ipsi-fMLD ↓ 4* |
No significant difference | |
| Hodge135 | 1 | N/A | NSCLC | He-MRI V: Automated threshold | N/A | Significance not reported. Mean Normalized total dose (NTD) to functional lung ↓ 4.01 |
Significance not reported. Mean NTD to total lung↓ 1.45 |
|
| Huang92 | 8 | 66 (med) | NSCLC | CT V (Jacobian): Thresholded into 2 groups (unspecified) | Double scattering proton therapy (DSPT) IMPT | Significance not reported. fV5 ↓ (DSPT, IMRT) fV20 ↓ (DSPT, IMRT) fMLD ↓ (DSPT, IMRT) |
Significance not reported. Potentially substantial increase seen in cord max dose for functional IMPT plan |
|
| Huang71 | 11 | 58 (mean) | 5 NSCLC 1 SCLC 3 esophageal 2 thymoma |
CT V (breath change-based): Thresholded at top 20%, 30%, and 40% of max | IMRT | Small tumors fV5 ↓* fV20 ↓* fMLD ↓* Large tumors fV5 ↓* fV20 ↓ fMLD ↓ |
Significance not reported V5 ↓ 5.8 V20 ↓ 2.32 MLD ↓ 1.05 Heart V40 ↑ 5.12 Mean heart ↑ 0.61 Cord max ↑ 1.73 Esophagus V35 ↑ 3.79 Mean esophagus ↑ 0.88 |
|
| Huang136 | 36 | 66 (med) | All NSCLC | CT V (Xe-enhanced): >15 HU | VMAT IMRT |
fV5 ↓ 2.1 fV20 ↓ 1.7* fMLD ↓ 2.9* |
Maximum dose ↑ 1.5* V20 ↓ 2* MLD ↓ 1.1* |
|
| Ireland139 | 6 | N/A | All NSCLC | He-MRI V: Manual thresholding | IMRT | fV20 ↓ 2.46* fMLD ↓ 0.9* |
Cord max ↑ 3.02* | |
| Iqbal81 | 29 | N/A | All lung cancer | CT V (density change): Weighted or thresholded at 33% and 66% | IMRT | Percent volume reduction reported. Thresholded method fV20 ↓ 2% fV30 ↓ 7%* fV40 ↓ 8.8%* fMLD ↓ 1.1 Weighted, voxel-wise method fV20 ↓ 7.8* fV30 ↓ 13.5* fV40 ↓ 17.2* fMLD ↓ 6.2* |
Percent volume reduction reported. Thresholded method V30 ↓ 5.3* V40 ↓ 7* Weighted, voxel-wise method V20 ↓ 7.1* V30 ↓ 13* V40 ↓ 16.8* MLD ↓ 6.4* Cord max ↑* |
|
| Kadoy120 | 11 | 80 (med) | Peripheral lung tumors | CT V (Jacobian): 90th percentile | 3DCRT (SBRT) | fV5 ↓ 8.2* fV10 ↓ 7.3* fV20 ↓ 3.2 fMLD ↓ 1.43* |
HI ↑ 0.03* | |
| Kida77,† | 8 | 64 (med) | 1 SCLC 4 NSCLC 3 Other |
CT V (HU) CT V (Jacobian) SPECT V All: weighted |
IMRT | Significance not reported HU fMLD ↓ 0.36 fV20 ↓ 1.88 Jacobian fMLD ↓ 0.38 fV20 ↓ 2.03 SPECT fMLD ↓ 0.42 fV20 ↓ 2.17 |
Not reported | |
| Kimura69 | 8 | 72.5 (med) | All lung cancer | CT (direct thresholding): > −860 HU | IMRT VMAT |
fV30 ↓ 1.3* (IMRT) fMLD ↓ 0.3 (IMRT) fMLD ↓ 0.5 (VMAT) |
PTV V5 ↑* (IMRT, VMAT, PTV > 250 cc) PTV fV20 ↑* (VMAT, PTV > 250 cc) |
|
| Lee21 | 8 | N/A | All NSCLC | SPECT Q: Threshold into 7 equidistant bins; 70% of max threshold used for dose-function parameters | VMAT | Pairwise significance not reported Medians reported; difference between medians used below, fMLD ↓ 7.6 (median) |
Pairwise significance not reported. PTV V60 ↑ (median) BTV mean ↑ (median) SUVpeak ↑ (median) MLD ↑ (median) V5 ↓ (median) V10 ↓ (median) Heart mean ↑ (median) Heart mean ↓ (median) Heart V40 ↑ (median) Heart V45 ↑ (median) Heart V60 ↑ (median) Cord D0.03 ↑ (median) Mean esophagus ↑ (median) |
|
| Lucia116 | 60 | 69 (med) | 25 NSCLC 23 secondary 12 other |
Ga-PET Q: Minimum volume containing 50%, 70%, and 90% of activity | VMAT (SBRT) | Medians reported. 50% threshold fMLD ↓ 0.2* fV5 ↓ 1.4* fV10 ↓ 0.8* fV15 ↓ 0.5* fV20 ↓ 0.3* 70% threshold fMLD ↓ 0.2* fV5 ↓ 1.3* fV10 ↓ 0.7* fV15 ↓ 0.4* fV20 ↓ 0.2* 90% threshold fMLD ↓ 0.2* fV5 ↓ 1* fV10 ↓ 0.6* fV15 ↓ 0.4* fV20 ↓ 0.1* |
MLD ↓ 0.1* V5 ↓ 0.7* V10 ↓ 0.5* V15 ↓ 0.3* V20 ↓ 0.1* PTV coverage ↓* |
|
| Matrosic64 | 18 | N/A | Lung Mediastinal |
CT Parametric response mapping (PRM): Tissue-based contours | VMAT | Emphysema fV20 ↓ 8.95*Small airway disease (SAD) fV20 ↓ 4.9*Parenchymal disease (PD) fV20 ↓ 3.42* |
MLD ↓ 0.31* V20 ↓ 1.85* |
|
| Matuszak146 | 15 | N/A | NSCLC | SPECT Q: Weighted | IMRT | fMLD ↓ 2.7* | Cord functional mean ↑ 5.4* Esophagus functional mean ↑ 3* Heart functional mean ↑ 2.3* Conformity ↓ 17.6%* |
|
| McGuire108 | 5 | N/A | Lung cancer | SPECT Q: Threshold into 4 regions, with subsequent weighting | IMRT | fV20 ↓ 13.6 (% reduction)* fV30 ↓ 10.5 (% reduction)* |
Not reported | |
| McGuire127 | 5 | N/A | Lung cancer | SPECT Q: Threshold into 4 regions, with subsequent weighting | IMRT: 7 beams | Significance not reported fV20 ↓ 5.9 fV30 ↓ 2.66 |
Not reported | |
| Miften34 | 1 | N/A | NSCLC | SPECT Q: Manual annotation | IMRT | Significance not reported Functional equivalent uniform dose (EUD) to lungs ↓ 4.21 |
Significance not reported EUD to lung ↓ 4.23 EUD to heart ↓ 3.45 |
|
| Mounessi114 | 13 | N/A | NSCLC | SPECT Q: 30% of max | IMRT VMAT |
All patients fMLD ↓ 0.59 (IMRT) fMLD ↓ 0.16 (VMAT) fV5 ↓ 0.45 (IMRT) fV5 ↓ 3.22 (VMAT) fV10 ↓ 1.25 (IMRT) fV10 ↓ 0.29 (VMAT) fV20 ↓ 3.14* (IMRT) fV20 ↓ 2.02* (VMAT) fV30 ↓ 1.11 (IMRT) fV30 ↓ 0.4 (VMAT) Localized hypo-perfusion fMLD ↓ 0.31 (IMRT) fMLD ↓ 0.12 (VMAT) fV20 ↓ 5.29* (IMRT) fV20 ↓ 2.7* (VMAT) fV30 ↓ 0.37* (IMRT) fV30 ↓ 1.18* (VMAT) Diffuse hypo-perfusion fMLD ↓ 0.75 (IMRT) fMLD ↓ 0.17 (VMAT) fV20 ↓ 1.8* (IMRT) fV20 ↓ 1.62* (VMAT) fV30 ↓ 1.58 (IMRT) fV30 ↓1.18* (VMAT) |
Esophagus parameters ↑* (VMAT, IMRT) | |
| Munawar117 | 10 | N/A | NSCLC | SPECT V: Threshold at 50% and 70% of max; weighting | IMRT | All patients fMLD ↓ 5.552* Group 1: Clinically acceptable fMLD ↓ 2.26 Group 2: Not acceptable fMLD ↓ 8.844* |
All patients MLD ↑ 45.051* Group 1: Clinically acceptable MLD ↑ 9.326 Group 2: Not acceptable MLD ↑ 82.642* |
|
| Seppenw-oolde149 | 116 | N/A | NSCLC | SPECT Q: Weighted | N//A | Significance not reported. Tumor hypoperfusion fMLD ↓ 4 (fMLD-optimized) fMLD ↓ 2 (fV20-optimized) Tumor-adjacent hypoperfusion fMLD ↓ 4.5 (fMLD-optimized) fMLD ↓ 3 (fV20-optimized) Tumor-ventral hypoperfusion fMLD unchanged (fMLD-optimized) fMLD unchanged (fV20-optimized) Ipsilateral lung hypoperfusion fMLD ↓ 2 (fMLD-optimized) fMLD ↑ 0.5 (fV20-optimized) Misc. fMLD ↓ 10 (fMLD-optimized) fMLD ↓ 10 (fMLD-optimized) |
Significance not reported. Tumor hypoperfusion MLD ↓ 7.5 (fMLD-optimized) MLD ↓ 3 (fV20-optimized) V20 ↑ 1 (fMLD-optimized) V20 ↓ 2.5 (fV20-optimized) Tumor-adjacent hypoperfusion MLD ↓ 1.5 (fMLD-optimized) MLD ↓ 0.5 (fV20-optimized) V20 ↓ 3.5 (fMLD-optimized) V20 ↓ 3.5 (fV20-optimized) Tumor-ventral hypo-perfusion MLD 0.5 (fMLD-optimized) MLD unchanged (fV20-optimized) V20 unchanged (fMLD-optimized) V20 unchanged (fV20-optimized) Ipsilateral lung hypo-perfusion MLD ↓ 1.5 (fMLD-optimized) MLD ↑ 1 (fV20-optimized) V20 ↓ 2.5 (fMLD-optimized) V20 ↓ 3 (fV20-optimized) Misc. MLD ↓ 1.5 (fMLD-optimized) MLD ↓ 1.5 (fMLD-optimized) V20 ↓ 17 (fMLD-optimized) V20 ↓ 17 (fV20-optimized) |
|
| Shioyama110 | 14 | 62 (med) | 15 NSCLC 1 neuroendo |
SPECT Q: 50th and 90th percentiles | IMRT | Median differences reported. 50% threshold fMLD ↓ 2.2* fV5 ↓ 7.1* fV10 ↓ 6* fV20 ↓ 5.1* 90% threshold fMLD ↓ 4.2* fV5 ↓ 7.1* fV10 ↓ 12* fV20 ↓ 6.8* |
Median differences reported. CI ↑ 0.2* PTV min ↓ 0.1* |
|
| Siva111 | 20 | 68 (med) | NSCLC | Ga-PET V/Q: Perfusion 70th percentile; ventilation 70th and 50th percentile | IMRT | Well perfused fMLD ↓ 1.7* fV5 ↓ 13.2* fV10 ↓ 7.3* fV20 ↓ 3.8* fV30 unchanged fV40 ↓ 0.63 fV50 ↓ 0.3 fV60 ↑ 0.05 Well-ventilated fMLD ↓ 1.2 fV5 ↓ 9.10 fV10 ↓ 5.3 fV20 ↓ 1.9 fV30 ↓ 0.8 fV40 ↓ 0.19 fV50 ↑ 0.14 fV60 ↓ 0.08 Ventilated fMLD ↓ 0.4 fV5 ↓ 5.2 fV10 ↓ 2.5 fV20 ↓ 0.3 fV30 ↓ 0.2 fV40 ↑ 0.09 fV50 ↑ 0.09 fV60 ↓ 0.12 |
Cord max ↑* for high-perfusion plan | |
| Siva112 | 14 | N/A | NSCLC | Ga-PET Q: top 70% of voxels | 3DCRT | Median differences reported Perfused lung fV5 ↑ 3.33* fV20 ↑ 0.42 fV30 ↓ 1.07 Hypo fV40 ↓ 1.15 fV50 ↓ 1.27 fV60 ↓ 1* fMLD ↓ 0.07 Well-perfused lung fV5 ↑ 0.15 fV20 ↓ 0.46 fV30 ↓ 1.76* fV40 ↓ 1.25* fV50 ↓ 0.74* fV60 ↓ 0.99* fMLD ↓ 0.86* |
Not reported | |
| St-Hilaire150,† | 15 | N/A | All lung cancer | SPECT Q: Weighting | IMRT | Local defects fV20 ↓ 1.13 fMLD ↓ 0.9 Nonuniform fV20 ↓ 1.69 fMLD ↓ 0.69* All patients fV20 ↓ 1.43 fMLD ↓ 0.79* |
Not reported | |
| Tian122 | 10 | N/A | NSCLC | SPECT Q (7-beam): Threshold (unspecified) | IMRT | Significance not reported fV20 ↓ 3.14 fV30 ↓ 0.7 |
Not reported | |
| Vicente57 | 12 | 64 | All lung cancer | CT V (HU-Jacobian hybrid): Thresholding at average of pretreatment scan CT V (airway segmentation) |
SBRT | 5-fraction Functional Lung Avoidance (FLA) fDmean ↓ 1.5 fV13.5 ↓ 3.6 5-fraction Functionally Weighted Airway Sparing (FWAS) fDmean ↓ 0.1 fV13.5 ↑ 0.1 5-fraction FLA + FWAS fDmean ↓ 1.5 fV13.5 ↓ 3.7 3-fraction FLA fDmean ↓ 1.5 fV11.4 ↓ 7.3 3-fraction FWAS fDmean ↓ 0.2 fV13.5 ↓ 1.6 3-fraction FLA + FWAS fDmean ↓ 2.4 fV13.5 ↓ 7.6 Individual-parameter significance not reported. Overall ventilation preservation, compared with conventional plan, was found to be significant. |
Significance not reported 5-fraction FLA Dmean ↓ 1.2 V13.5 ↓ 3.1 5-fraction FWAS V13.5 ↓ 0.2 5-fraction FLA + FWAS Dmean ↓ 1.1 V13.5 ↓ 2.9 3-fraction FLA Dmean ↓ 1.8 V11.4 ↓ 4.7 3-fraction FLA + FWAS Dmean ↓ 1.7 V13.5 ↓ 5 |
|
| Vinogradskiy119 | 67 | 65 (med) | All NSCLC | CT V (HU): 15% of max | IMRT | fMLD ↓ 1.3* fV5 ↓ 3.4* fV10 ↓ 6.4* fV20 ↓ 3.5* fV30 ↓ 1.8* |
PTV coverage ↓ 0.8* MLD ↓ 0.7* V20 ↓ 2* Cord max ↑ 1.4* Mean esophagus ↓ 0.7* |
|
| Wang113 | 38 | 61 (med) | NSCLC | SPECT Q: 30% of max | IMRT | fV10 ↓ 5.21* fV15 ↓ 4.84* fV20 ↓ 4.25* fV25 ↓ 2.84* fV30 ↓ 2.38* fV35 ↓ 1.37* fV40 ↑ 0.43 |
No significant differences | |
| Wang115 | 16 | 55 (med) | All NSCLC | CT V (Jacobian): Top 30% | IMRT: Equally spaced beams IMRT: Manual beams |
fV5 ↓ 1.8* (equal) fV5 ↓ 1 (manual) fV10 ↓ 5.4* (equal) fV10 ↓ 1.1 (manual) fV20 ↓ 5.2* (equal) fV20 ↓ 1.1 (manual) fV30 ↓ 0.3 (equal) fV30 ↓ 1.5 (manual) |
No significant difference | |
| Waxweiler118 | 25 | N/A | All lung cancer | CT V (HU): Maximum 15% reduction per lung third, weighted | IMRT | Thresholded fMLD ↓ 2.8* fV5 ↓ 13.7* fV10 ↓ 14.9* fV20 ↓ 5.6* fV30 ↓ 2.9* fV40 ↓ 1.6* Weighted fMLD ↓ 2.1* fV5 ↓ 11.3* fV10 ↓ 14.9* fV20 ↓ 5* fV30 ↓ 2 |
PTV max ↑ 1.3* HI ↓ 0.03* MLD ↓ 1.4* V20 ↓ 1.9* Cord max ↑ 3.6* |
|
| Yamamoto145 | 1 | N/A | NSCLC | CT V (HU): Weighted | IMRT | Single-patient data fV20 ↓ 5.1 fMLD ↓ 0.2 |
Single-patient data PTV homogeneity ↑ 1.6 V20 ↓ 4.5 V5 ↑ 10.6 MLD ↑ 0.2 Cord max ↑ 2.1 Mean esophagus ↑ 1.4 |
|
| Yamamoto109,† | 15 | 75.1 (mean) | All NSCLC | CT V (Jacobian): Thresholded into 3 equal volumes (unspecified) | VMAT IMRT |
High-functioning lung fMLD ↓ 1.7425* (IMRT) fMLD ↓ 1.972* (VMAT) fV5 ↓ 2.09* (IMRT) fV5 ↓ 2.11* (VMAT) fV20 ↓ 3.37* (IMRT) fV20 ↓ 2.89* (VMAT) fV30 ↓ 2.8* (IMRT) fV30 ↓ 2.71* (VMAT) fV40 ↓ 2.54* (IMRT) fV40 ↓ 2.87* (VMAT) fV50 ↓ 2.32* (IMRT) fV50 ↓ 2.57* (VMAT) Moderate-functioning lung fMLD ↓* (IMRT) fMLD ↓ (VMAT) fV20 ↓ (IMRT) fV20 ↑ (VMAT) Low-functioning lung fMLD ↑ (VMAT) fV20 ↑ (IMRT) fV20 ↑ (VMAT) |
MLD ↓ 0.7* (IMRT) PTV mean ↑ 2.1* (IMRT) PTV mean ↑ 1.8* (VMAT) CI ↓ 0.05* (IMRT) CI ↓ 0.03* (VMAT) HI ↑ 0.07* (IMRT) HI ↑ 0.07* (VMAT) |
|
| Yamamoto148 | 14 | 74 (med) | All NSCLC | CT V (elastic): Weighted | IMRT | fMLD ↓ 0.5* fV10 ↓ 2.2* fV20 ↓ 2.6* fV30 ↓ 1* |
No significant differences | |
| Yaremko133 | 27 | 65.7 (mean) | NSCLC | He-MRI V: Automated threshold into 3 regions | VMAT | All ventilated lung fV5 ↓ 3.5* fV10 ↓ 3.9* fV20 ↓ 2.9* fMLD ↓ 1* High-ventilated lung fV5 ↓ 4* fV10 ↓ 4.3* fV20 ↓ 4.4* fMLD ↓ 1.2* |
PTV V95 ↓ 6* PTV max ↑ 0.9* V5 ↓ 3* V10 ↓ 3.3* V20 ↓ 2.4* MLD ↓ 0.8* Heart V40 ↑ 0.8* Mean esophagus ↓ 0.4* |
|
| Yaremko107 | 21 | 69 (med) | NSCLC | CT V (HU): 90th percentile | IMRT | Significance not reported. All functional dose-volume parameters improved in functional planning. VENT 1: Functional only fMLD ↓ 5.8 VENT 2: Functional with increased priority on PTV coverage fMLD ↓ 2.4 |
Significance not reported. PTV coverage was only sufficient for 11 patients in VENT 1 but all in VENT 2. VENT 1: Functional only HI ↓ 0.001 PTV 95% isodose ↑ 0.2 VENT2: Functional with increased priority on PTV coverage HI ↓ 0.193 PTV 95% isodiose ↓ 8.6 |
|
| Yin131 | 10 | N/A | NSCLC | SPECT Q: Visual thresholding | IMRT 3DCRT |
fV5 ↓ (3DCRT) fV5 ↓* (IMRT) fV10 ↓* (IMRT, 3DCRT) fV20 ↓* (IMRT, 3DCRT) fV30 ↓* (3DCRT) fV40 ↓* (IMRT, 3DCRT) fMLD ↓* (IMRT, 3DCRT) |
PTV V66 ↑* (IMRT, 3DCRT) |
Anatomic plans were optimized without incorporating functional lung information, whereas functional-avoidance plans included this information.
Abbreviations: 3DCRT = 3-dimensional conformal radiation therapy; BTV = biologic tumor volume; CT = computed tomography; CTV = clinical target volume; FLI = functional lung imaging; fMLD = mean dose to functional lung; fVx = dose parameter (x) to functional lung, defined as in the modality column; FWAS = functionally weighted airway sparing; Ga = gallium; He = helium; HI = homogeneity index; HU = Hounsfield unit; IMPT = intensity modulated proton therapy; IMRT = intensity modulated radiation therapy; MLD = mean dose to non-PTV lung; MRI = magnetic resonance imaging; NSCLC = non-small cell lung cancer; OAR = organs at risk; PET = positron emission tomography; PTV = planning target volume; Q = perfusion; RBE = relative biological effectiveness; RT = radiation therapy; SBRT = stereotactic body radiation therapy; SCLC = small cell lung cancer; SPECT = single-photon emission computed tomography; SUV = standardized update volume; V/VENT = ventilation; VMAT = volumetric modulated arc therapy; Xe = xenon.
Statistically significant.
Data acquired via email.
Table 2.
Using functional lung information to predict RILT
| Study first author | N | Age | Cancer type | FLI modality: Definition | RT modality | RILT predicted | Best prediction outcome using functional parameters | Model used to make best prediction | Improvement in prediction compared with nonfunctional information |
|---|---|---|---|---|---|---|---|---|---|
| Bin143 | 217 | 60.8 (mean) | 169 lung 48 esophageal |
CT V (HU): Weighting | N/A | Grade 2+ RP | AUC: 0.874 (95% CI, 0.871-0.877) | Dual-omics model, combining radiomics with deep learning | N/A |
| Dhami84 | 20 | 67.5 (med) | 15 NSCLC 2 SCLC 3 other |
SPECT Q: Thresholding from 5%-95% of max, in 5% increments | 3DCRT IMRT/VMAT PBT SBRT |
Grade 2+ RP | Sensitivity: 100% Specificity: 81.25% P = .008 |
Cutoff at 13.3 Gy, using perfused mean lung dose (pMLD) at the 70th percentile threshold | No (univariate) Yes (bivariate) |
| Ding73 | 40 | N/A | All NSCLC | SPECT Q: Thresholding from 10%-60% of max, in 10% increments Weighting | 3DCRT IMRT |
All grades RP | Thresholded AUC: 0.928 (95% CI, 0.842-1.013) Sensitivity: 90.9% Specificity: 86.2% Accuracy: 87.5% |
Cutoff at 20% of maximum, for fV20, was the most predictive | N/A |
| Dougherty86 | 31 | 64 (med) | 26 NSCLC 5 SCLC |
CT V (HU): 15% of max, with further processing | VMAT IMPT |
Grade 2+ RP Grade 3+ RP |
Grade 2+: IMPT: NTCP ↓ 5.7% VMAT: NTCP ↓ 6.2% Grade 3+: IMPT: NTCP ↓ 2.4% VMAT: NTCP ↓ 3.4% |
NTCP model from Faught et al89,90 | Yes |
| Farr152 | 71 | 67 (med) | All NSCLC | SPECT Q: 20%, 40%, 60%, and 80% of max | IMRT SBRT |
Grade 3+ RP | Baseline SPECT Q: AUC: 0.79 (95% CI, 0.68-0.91) Sensitivity: 72% Specificity: 70% Odds ratio: 7.8 Odds ratio with GTV: 9.2 Post-RT SPECT Q: AUC: 0.8 (95% CI, 0.62-0.94) |
Baseline: Perfusion defect score cutoff Post-RT: Difference in defect score cutoff |
N/A |
| Farr72 | 45 | 67 (median) | All NSCLC | SPECT Q: 20%, 40%, 60%, and 80% of max | IMRT SBRT |
Symptomatic RP | Spearman’s rs = 0.4, P = .02 Relative risk estimate: 3.6 (95% CI, 1.1-12) | Correlation analysis for rs is for perfusion reduction in 21-40 Gy bin. Relative risk estimate reflects all reductions. |
N/A |
| Farr121 | 58 | 67 (median) | All NSCLC | SPECT Q: Thresholding in 10% increments from 20th to 80th percentiles, followed by weighting | IMRT | Grade 2+ RP | Threshold odds ratio 1.53, P < .01 AUC = 0.81 (95% CI, 0.7-0.93) Weighting Odds ratio 1.4, P < .01 AUC = 0.78 (95% CI, 0.66-0.91) |
Best for OR both thresholded and weighted models was found when using fMLD. Best for AUC for both thresholded and weighted models was found when using fV30 |
Yes |
| Faught89 | 70 | N/A | All NSCLC | CT V (HU): 15% below average lung function | IMRT 3DCRT |
Grade 2+ RP Grade 3+ RP |
Grade 2+: AUC: 0.723, P < .01 NTCP ↓ 8%* (univariate) NTCP ↓ 10.4% (bivariate) Grade 3+: AUC: 0.674, P = .13 NTCP ↓ 4.8%* (univariate) NTCP ↓ 4.7% (bivariate) |
Grade 2+: Best AUC uses fMLD Best univariate NTCP reduction uses fV10 Best bivariate NTCP reduction uses fV10 and V10 Grade 3+: Best AUC uses fV20 Best univariate NTCP reduction uses fV30 Best bivariate NTCP reduction uses fV10 and V10 |
N/A |
| Faught90 | 70 | N/A | All NSCLC | CT V (HU): Thresholding from 5th to 95th percentile in increments of 5; nonlinear weighting | N/A | Grade 2+ RP Grade 3+ RP |
Grade 2+: AUC: 0.73, P < .01 (threshold) AUC: 0.74, P < .01 (weighting) Grade 3+: AUC: 0.7, P = .033 (threshold) AUC: 0.67, P < .03 (weighting) NTCP 10% reduction: 17.2% NTCP 20% reduction: 30.2% |
Grade 2+: Threshold best model used fV20 at 86th percentile or fMLD at 69th percentile. Sigmoid best model used amount of functional lung receiving ≥ 20 Gy (F20). Grade 3+: Threshold best model used fV20 at 85th percentile. Sigmoid best model used F20. Sigmoid NTCP 10% reduction requires a 17.2% reduction in F20 and a 20% reduction requires a 30.2% reduction in F20. |
Yes |
| Gayed174 | 50 | 67.6 (mean) | All lung cancer | Planar Q: Lung perfusion score | IMRT 3DCRT Proton |
Grade 2+ pulmonary complications (O2 dependence, respiratory failure, dyspnea, etc) | Lung perfusion score higher in patients with pulmonary complications, P = .01. Odds ratio = 1.6 (95% CI, 1.07-2.39) Odds ratio = 3.25 (95% CI, 1.37-7.70) (multivariate) AUC = 0.7 |
Lung perfusion score rates the perfusion defects seen in perfusion imaging | N/A |
| Hodge135 | 1 | N/A | NSCLC | He-MRI V: Automated threshold | IMRT | Grade 3+ RP | Predicted risk of grade 3+ RP was 4% with functional planning | NTCP model assessing damage to individual functional subunits179,180 | Yes |
| Hoover144 | 26 | N/A | 20 NSCLC 6 SCLC |
SPECT V/Q: Weighting | N/A | Grade 2+ RP | AUC: 0.74 (ventilation) (95% CI, 0.54-0.94) AUC: 0.74 (perfusion) (95% CI, 0.54-0.93) Significant correlations found with increase in functional parameters and RP |
N/A | Yes |
| Huang140 | 244 | N/A | All lung cancer | CT V (HU): Weighting | IMRT VMAT |
Grade 3+ RP | AUC: 0.77 Sensitivity: 0.71 Specificity: 0.76 |
Fully connected Convolutional neural network (CNN) | Yes |
| Huang136 | 36 | 66 (med) | All NSCLC | CT V (Xe-enhanced): >15 HU | VMAT IMRT |
Grade 2+ RP | Relative risk reduction compared with anatomic plan: 30%, P < .001 | Varian Eclipse’s biologic evaluations, using parameters from Seppenwoolde et al181 | Yes |
| Kanai96 | 40 | 77 (med) | Thoracic cancers | CT V (HU): Thresholds from 5th to 95th percentiles | SBRT | Grade 2+ RP | AUC: 0.57 | Best AUC found for fV30 at the 25th percentile threshold. Not statistically significant. | Yes |
| Kocak141 | 182 | N/A | 167 NSCLC 15 SCLC |
SPECT Q: Weighting | N/A | Grade 2+ RP | One-tailed Fisher’s exact P = .03 on original data set, P = .33 and .41 on other data sets AUC: 0.65 (bivariate, Duke) AUC: 0.72 (univariate/bivariate, Netherlands cancer institute (NKI)) |
Model predicts high risk if a patient has MLD ≥ 25 Gy and pre-RT DLCO less than (Overall perfusion-weighted response parameter (OpRP) + 38) AUC for Duke data set was OpRP and FEV1 AUC for NKI was OpRP or OpRP and DLCO or OpRP and FEV1 |
Variable depending on data set |
| Lan50 | 37 | 61 (mean) | 37 NSCLC | CT V (density change): Thresholded at 20%, 40%, 60% 80% of max; weighted | N/A | Grade 2+ radiation fibrosis | Lung consolidation: AUC: 0.66 (weighted) AUC: 0.65 (threshold) Volume loss: AUC: 0.71 (weighted) AUC: 0.75 (threshold) Statistically significant decrease in fV20, fV30, and fV40 for 60% thresholded parameters, for patients without volume loss Airway dilation: AUC: 0.8 (weighted) AUC: 0.85 (threshold) Statistically significant decrease in all thresholded functional parameters (60% threshold) and all but fV40 weighted parameters, for patients without airway dilation compared with those with |
Lung consolidation weighting model used fV20, and threshold used fV30 at a threshold of 20% Volume loss model used fV30 or fV40 for weighting and 40% threshold fV40, 60% threshold fV40, or 80% threshold fV40 for thresholded method Airway dilation model used fV20 for weighting and fV20 at 40% threshold for thresholded method |
Yes |
| Lee79 | 28 | 70.5 (med) | 14 NSCLC 5 SCLC 5 Locally recurrent 4 Lung mets |
SPECT Q: Threshold into 7 equidistant bins; 70% of max threshold used for dose-function parameters | VMAT proton IMRT SBRT 3DCRT |
Grade 2+ RP | rs = 0.94 AUC: 0.87, P =.011 pMLD cutoff 13.2 Gy EQD2: Sensitivity 100%; specificity 74% |
Best functional Spearman coefficient was for fV20 using perfusion Best AUC was for pF20 (perfusion-weighted) |
No |
| Li130 | 126 | 61 (med) | All lung cancer | CT Q: Model from Ren et al15 | IMRT | Grade 2+ RP | AUC: 0.862 (95% CI, 0.851-0.871) | Dual radiomics and perfusion image-based model | Yes |
| Li97 | 17 | 67 (med) | All NSCLC | CT V (Jacobian): Top 10%, 20%, 30%, 40%, and 50% of max (planning); weighting (dose-function parameter calculation) | IMRT | Grade 2+ RP | Previous NTCP model successfully predicted which population would have statistically significant improvements in functional parameters due to avoidance planning compared with anatomic plans. For this population only: 50% thresholded fV5 ↓, fV10 ↓, fV20 ↓, fMLD ↓, V5 ↓, V10 ↓. 40% thresholded fv5 ↓, fV10 ↓, fV20 ↓, fMLD ↓, V5 ↓. 40% thresholded fV5 ↓, fV20 ↓, fMLD ↓ This population also had: 50% thresholded PTV HI ↑, Cord Max ↑. 40% thresholded PTV HI ↑, cord max ↑. 30% thresholded HI max ↑, cord max ↑ |
NTCP model89 | Yes |
| Lind142 | 162 | 59 (mean) | 118 Lung 20 Breast 17 Lymphoma 8 Other |
SPECT Q: Weighting | N/A | Grade 2+ RP: Minimum 6 months follow-up | AUC: 0.62 (bivariate) AUC: 0.79 (bivariate with conditions) AUC: 0.83 (trivariate with conditions) |
Bivariate: DLCO and overall response parameter (ORP) Bivariate with conditions: DLCO > 40; Mean perfused lung dose (MPLD) and DLCO Trivariate with conditions: DLCO > 40; DLCO, FEV1, and MPLD or ORP |
Yes |
| Marks182 | 50 | N/A | 67 Lung 17 Breast 12 Lymphoma 4 Other |
SPECT Q: N/A | N/A | RT-related pulmonary symptoms | NTCPs based on functional parameters provided no additional predictive value | N/A | No |
| O’Reilly105 | 74 | N/A | All NSCLC | CT V (Jacobian): Top 6%, 45%, and 60% of max | Photon (unspecified) proton | Grade 2+ RP | AUC: 0.9 (photon) (95% CI, 0.74-0.98) AUC: 0.74 (proton) (95% CI, 0.53-0.89) |
Best AUC used fMLD in highly ventilated lung | Yes |
| Otsuka101 | 40 | 66 (med) | All thoracic cancer | CT V: Threshold at percentile regions from 0-100, in increments of 10 | SBRT other photon | Grade 2+ RP | AUC: 0.843 (95% CI, 0.732-0.954) For all functional parameters, grade 2+ RP had higher values than grade 1 RP |
Best AUC used fV5 to low-ventilated region (0-30th percentiles) | N/A |
| Owen106 | 88 | N/A | All NSCLC | SPECT V/Q: Percentile thresholds from 10-90, in increments of 10; analogous percentile thresholds of lowest function | 3DCRT VMAT |
Grade 2+ RP or clinical RF | Odds ratio: 0.05, P = .5 (Q) (95% CI, 0.01-0.91) Odds ratio: 0.06, P = .02 (V) (95% CI, 0.00-0.64) Odds ratio: 1.19, P = .006 (V and Q) |
Best for Q was normalized fV20 in ipsilateral lung. Best for V was normalized fV20 in both lungs. Best for V and Q combined was the low-function volume receiving ≥20 Gy |
No |
| Seppenwoolde181 | 382 | N/A | 274 NSCLC 66 Lymphoma 42 Breast |
SPECT Q: NA | N/A | Grade 2+ RP Grade 2+ RP |
Predictive; specific performance regarding quality of fit not specified. Log-likelihood of −119.4. | Sigmoid dose-effect relation fitted through SPECT Q | No |
| Sharifi78 | 30 | N/A | All NSCLC | CT V (Jacobian) CT V (volume): Threshold at 95% of max and weighting |
N/A | Grade 2+ dyspnea | Jacobian AUC: 0.79, P = .2 Volume AUC: 0.8, P = .01 |
Best AUC for Jacobian used fV1 to fV5 Best AUC for volume used fV1 to fV5 |
N/A |
| Thomas126 | 39 | 63 (med) | All NSCLC | SPECT Q: Radiomics, thresholding, and weighting separately each | IMRT VMAT PBT |
Grade 2+ RP | No functional parameters were found to be significantly predictive of the endpoint. | N/A | No |
| Vinogradskiy147 | 96 | N/A | All NSCLC | CT V (HU): Weighting | 3DCRT IMRT |
Grade 3+ RP | AUC: 0.62, P = .093 | Best AUC used fV20. None were significant. | Yes |
| Wang99 | 57 | N/A | All NSCLC | SPECT Q: Threshold 30% of max followed by weighting | IMRT 3DCRT |
Grade 2+ RP | RP rate stratification of 2.9%:43.5% AUC: 0.869, P = .0001 Sensitivity: 0.9091 Specificity: 0.7391 |
Best AUC used fV15 | Yes |
| Wang104 | 57 | N/A | All NSCLC | SPECT Q: Threshold 30% of max followed by weighting | 3DCRT IMRT |
Grade 2+ RILT | All functional parameters from fV5 to fV50 in 5 Gy increments were significantly higher in patients with RILT AUC:0.869, P = .001 (95%CI,0.764-0.973) |
Best AUC used fV15; best AUC better than volume-based fV40 | No |
Studies in Table 1 that also reported on dose to OARs had varying results. In many cases, but not all,21,39,57,64,69,71,81,83,85–87,89,91,107,109,110,113,115,116,118,119,131,133–137,145,148,149,151 improvement to functional parameters came at the cost of decreased target volume coverage and/or increased OAR doses.21,39,71,81,86–89,92,109–112,114,116–120,133,136,139,145,146,149 In these cases, OARs that sustained increased doses were lung,21,117,145,149 esophagus,21,71,87,114,145,146 heart,21,71,89,133,146 and spinal cord.21,81,89,92,111,118,119,139,145,146
Sixteen studies directly compared different methods of RT delivery, within the scope of FL avoidance planning.21,57,69,83,86,87,92–95,109,117,122,127,131 Of these, studies that provided data on dose-function parameters specifically can be seen in Table 3. Proton beam therapies (PBT) consistently outperformed photon-based therapies in terms of functional parameters.86,92,93 Dougherty et al86 and Huang et al92 found this was accompanied by an improvement in PTV and OAR parameters, whereas Ieko et al93 found this came at a small but significant decrease to PTV D99 (percentage of dose covering 99% of PTV). For photon-based therapies, intensity modulated radiation therapy (IMRT) generally, but not always, outperformed both volumetric modulated arc therapy (VMAT)57,87,109,128 and 3-dimensional conformal RT87,94,95,131 in functional parameters. This was also generally, but not consistently, accompanied by improvements to PTV and OAR parameters. Finally, several studies compared different beam arrangements for IMRT plans. These results were not consistent. One study found a decrease in only fMLD,117 whereas others found a mix of increases and decreases when beam number was reduced.122,127 The substantial heterogeneity between studies in terms of RT modality, FLI modality, cancer type, cancer stage, and tumor location can be significant: Vinogradskiy et al129 found that dose-function parameters were substantially higher in stage III patients than in stage I using CT V (HU). Kida et al77 explored the effect of FLI modality on treatment planning. They found a strong linear correlation between fV20 for CT V (HU) and CT V (Jacobian), each with SPECT V (R = 0.94 and R = 0.85, respectively).77 For OAR, PTV, and functional metrics, they found that the differences between FLI modalities were usually under 1%.77
Table 3.
Comparison of functional parameters, PTV, and OARs for varying RT modalities using functional avoidance planning
| Study first author | N | Age | Cancer type | FLI modality: Definition | RT modality comparison | Significant changes in dose-function parameters | Plan quality: Significant results |
|---|---|---|---|---|---|---|---|
| Christian83 | 6 | N/A | All NSCLC | SPECT Q: Visual threshholding into 2 groups; weighting | Coplanar Noncoplanar |
No significant changes | No significant changes |
| Dougherty86 | 31 | 64 (med) | 26 NSCLC 5 SCLC |
CT V (HU): 15% of max, with further processing | IMPT IMPT (dose-escalated) VMAT |
IMPT changes vs VMAT fMLD ↓ 7.18* fV20 ↓ 9.18* fV30 ↓ 4.41* IMPT changes vs dose-escalated fV20 ↓ 1.37* fV30 ↓ 1.03* |
IMPT reductions vs VMAT MLD ↓ 6.5* V20 ↓ 8.25* Mean esophagus ↓ 4.54* Mean heart ↓ 7.11* Cord max ↓ 23.34* |
| Farr87 | 15 | 71 (med) | 12 NSCLC 1 SCLC 2 other |
SPECT Q: 20%, 40%, 60%, and 80% of max | IMRT VMAT 3DCRT |
3DCRT produced no statistically significant reductions or increases to functional parameters, aside from fV20 at the 40% threshold. VMAT produced statistically significant reductions in fV20 at the 20% threshold, fMLD and fV20 at the 40% threshold, fMLD and fV20 at the 60% threshold, and fMLD at the 80% threshold. IMRT produced statistically significant reductions for all functional parameters except fV5 for the 20% and 40% thresholds, and fV30 for the 60% and 80% thresholds. |
Only the functional IMRT plan had statistically significant reductions in OAR-related parameters: V20 ↓ 2.02* V30 ↓ 1.03* Esophagus V60 ↓ 1.5* VMAT had a statistically significant increase in esophagus V60: Esophagus V60 ↑ 1.29* |
| Huang92 | 8 | 66 (med) | NSCLC | CT V (Jacobian): Thresholded into 2 groups (unspecified) | IMRT Double-scattering proton therapy (DSPT) IMPT |
Only 2 IMRT plans were clinically acceptable. Both proton plans were superior in sparing low-dose regions. IMPT specifically did so while maintaining PTV coverage. |
Significance not reported. V5 median IMRT > DSPT > IMPT V20 median IMRT = DSPT > IMPT MLD median IMRT > DSPT > IMPT Mean heart median IMRT > DSPT > IMPT Mean esophagus median IMRT = DSPT > IMPT Cord max IMRT > IMPT > DSPT |
| Ieko93 | 13 | 75.1 (mean) | All NSCLC | CT V (HU): 20th percentile | VMAT (SBRT) 3DCRT (SBRT) Proton (SBRT) |
VMAT changes vs 3DCRT: fV10 ↓ 3.3* (threshold) fV10 ↓ 3* (weighting) Proton changes vs 3DCRT: fV5 ↓ 16* (threshold) fV5 ↓ 15.3* (weighting) fV10 ↓ 6.2* (threshold) fV10 ↓ 5.4* (weighting) fMLD ↓ 1.7* (threshold) fMLD ↓ 1.8* (weighting) Proton changes vs VMAT: fV5 ↓ 12.2* (threshold) fV5 ↓ 11.2* (weighting) fV10 ↓ 2.9* (threshold) fV10 ↓ 2.4* (weighting) fMLD ↓ 1.3* (threshold) fMLD ↓ 1.4* (weighting) |
VMAT changes vs 3DCRT: V10 ↓ 3.2* contra-MLD ↑ 0.6* Cord max ↑ 3* Proton changes vs 3DCRT: PTV D1 ↓ 2.9* PTV D99 ↓ 1.4* MLD ↓ 1.7* V5 ↓ 15.7* V10 ↓ 6.2* contra-MLD ↓ 1.2* contra-V5 ↓ 8.9* contra-V20 ↓ 0.6* Cord max ↓ 9.1* Heart max ↓ 8.1* Proton changes vs VMAT: PTV D1 ↓ 2.3* PTV D99 ↓ 1* MLD ↓ 1.3* V5 ↓ 12.3* V10 ↓ 3* contra-MLD ↓ 1.8* contra-V5 ↓ 13* contra-V10 ↓ 0.7* Cord max ↓ 12.1* Heart max ↓ 8.5* |
| Kimura69 | 8 | 72.5 (med) | All lung cancer | CT (direct thresholding): > −860 HU | IMRT VMAT |
IMRT changes VS VMAT: fV5 ↓* fV10 ↓* fV20 ↑* |
IMRT changes vs VMAT: CI ↑ 0.64* Mean esophagus ↓ 0.7* PTV > 250 cc V5 ↓* PTV > 250 cc fV5 ↓* |
| Lavrenkov94 | 17 | N/A | All NSCLC | SPECT Q: 60% of max | IMRT 3DCRT |
IMRT changes vs 3DCRT stage III: fV20 ↓ 7.7* fMLD ↓ 2.7* IMRT changes vs 3DCRT nonuniform heterogeneous hypoperfusion: fV20 ↓ 11.5* fMLD ↓ 3.6* |
IMRT changes vs 3DCRT stage III: PTV90/fV20 ↑ 2.1* IMRT changes vs 3DCRT nonuniform heterogeneous hypoperfusion: PTV90/fV20 ↑ 2.3* |
| Lavrenkov95 | 25 | N/A | All NSCLC | SPECT Q: 60% of max | IMRT 3DCRT |
IMRT changes vs 3DCRT stage III and nonuniform heterogeneous hypoperfusion: fV20 ↓ 10.6* fMLD ↓ 3.2* |
IMRT changes vs 3DCRT stage III and nonuniform heterogeneous hypoperfusion: PTV90/fV20 ↑ 2.4* |
| Lee21 | 8 | N/A | All NSCLC | SPECT Q: Threshold into 7 equidistant bins; 70% of max threshold used for dose-function parameters | VMAT proton VMAT and proton |
(VMAT + proton) changes vs VMAT fMLD ↓* (median) (VMAT + proton) changes vs proton fMLD ↓* (median) |
(VMAT + proton) changes vs VMAT PTV V60 ↑* (median) SUVpeak mean ↑* (median) MLD ↓* (median) V5 ↓* (median) V10 ↓* (median) V20 ↓* (median) Mean heart ↓* (median) Cord D0.03 ↓* (median) (VMAT + proton) changes vs proton PTV V60 ↑* (median) SUVpeak mean ↑* (median) MLD ↑* (median) Mean heart ↑* (median) Cord D0.03 ↑* (median) |
| McGuire127 | 5 | N/A | All lung | SPECT Q: Threshold into 4 regions, with subsequent weighting | IMRT: 7 and 4 beams | Four beams vs 7 beams fV5 ↓ 8.6* fV13 ↓ 3.3* fV20 ↓ 1.4 fV30 ↑ 1.8 |
No significant differences |
| Mounessi114 | 13 | N/A | NSCLC | SPECT Q: 30% of max | IMRT VMAT |
Only IMRT gives a significant reduction in fV30 for localized hypoperfusion patients. Only VMAT gives a significant reduction in fV30 for diffuse hypoperfusion patients. Only IMRT gives a significant increase in V20 to nonfunctional lung. Only VMAT gives a significant increase to mean dose to nonfunctional lung. |
No significant difference |
| Munawar117 | 10 | N/A | NSCLC | SPECT V: Threshold at 50% and 70% of max; weighting | IMRT: 9 and 3 field | 3-field change vs 9-field All patients No significant difference Group 1: Clinically acceptable fMLD ↓ 1.078* Group 2: Not acceptable No significant difference |
3-field change vs 9-field All patients No significant difference Group 1: Clinically acceptable No significant difference Group 2: Not acceptable No significant difference |
| Tian122 | 10 | N/A | NSCLC | SPECT Q: 4, 5, 7 beam: threshold (unspecified) | IMRT | 4 beam changes vs 5 beam fV5 ↓ 10.28* fV30 ↑ 1.22* 4 beam changes vs 7 beam fV5 ↓ 15.24* fV20 ↑ 2.2* fV30 ↑ 1.6* fMLD ↓ 0.62* 5 beam changes vs 7 beam fV5 ↓ 4.96* fV20 ↑ 1.74* fV30 ↑ 0.48* |
4 beam changes vs 5 beam CI ↓ 0.09* 4 beam changes vs 7 beam CI ↓ 0.1* 5 beam changes vs 7 beam HI ↑ 0.12* |
| Vicente57 | 12 | 64 | All lung cancer | CT V (HU-Jacobian hybrid): Thresholding at average of pretreatment scan CT V (airway segmentation) |
IMRT VMAT vs 3DCRT conventional plan All plans were SBRT |
IMRT vs 3DCRT fDmean ↓ 32% fV13.5 ↓ 39% VMAT vs 3DCRT fDmean ↓ 14% fV13.5 ↓ 5% |
Not reported |
| Wang115 | 16 | 55 (med) | All NSCLC | CT V (Jacobian): Top 30% | IMRT: Equally spaced beams IMRT: Manual beams |
Manual change vs equal fV5 ↓ 13.2* fV10 ↓ 14.1* fV20 ↓4.4* fV30 ↓ 2 |
Manual change vs equal Mean cord ↓ 6.5* Max cord ↓ 4.4* Heart V60 ↑ 3.9* |
| Yamamoto109 | 15 | 75.1 (mean) | All NSCLC | CT V (Jacobian): Thresholded into 3 equal volumes (unspecified) | VMAT IMRT |
Only IMRT had a significant decrease in fMLD and fV20 to moderately ventilated lung for the functional plan compared with anatomic. | Only IMRT had a significant reduction in mean lung dose in the functional plan compared with anatomic. |
| Yin131 | 10 | N/A | NSCLC | SPECT Q: Visual thresholding | IMRT 3DCRT |
IMRT changes vs 3DCRT fV5 ↑* fV40 ↓* |
Significance not reported. IMRT changes vs 3DCRT PTV V66 ↑ Heart V30 ↑ |
Abbreviations: 3DCRT = 3-dimensional conformal radiation therapy; CT = computed tomography; FLI = functional lung imaging; fMLD = mean dose to functional lung; fVx = dose parameter (x) to functional lung, defined as in the modality column; HU = Hounsfield unit; IMPT = intensity modulated proton therapy; IMRT = intensity modulated radiation therapy; MLD = mean dose to non-PTV lung; Vx = dose parameter (x) to non-PTV lung; NSCLC = non-small cell lung cancer; OAR = organs at risk; PTV = planning target volume; Q = perfusion; RT = radiation therapy; SBRT = stereotactic body radiation therapy; SCLC = small cell lung cancer; SPECT = single-photon emission computed tomography; SUV = standardized update volume; V/VENT = ventilation; VMAT = volumetric modulated arc therapy.
Statistically significant; anatomic plans not compared.
Different studies also used different plan optimization methods, which have the potential to influence results. Faught et al88 explored knowledge-based planning, which is meant to better spare OARs and meet coverage requirements. They found that compared with conventional, inverse-planned FL RT plans, their method significantly reduced fV20, fMLD, V20 (percent of non-PTV lung volume receiving 20 Gy or more), MLD (mean dose to non-PTV lung), and mean dose to the esophagus. Vicente et al53 introduced functionally weighted airway sparing, an optimization algorithm that prioritizes protection of airways in addition to FL tissue on CT scan, and found that it improved V preservation compared with nonairway-sparing functional optimization.53,57 Some data were excluded from Table 1 for reporting on functional plans made at different timepoints. Of note, Bucknell et al82 explored the use of 68Ga-PET (V/Q) to assess FL volumes and adapted treatment accordingly at week 4. This was intended to account for potential changes in functionality that may occur during treatment.82 They found a statistically significant decrease in fV20 for ventilation at week 4 for the adaptive plan.82 Yamamoto et al148 found a similar pattern, with midtreatment functional adaptation further reducing functional dose parameters.
FL avoidance: Meta-analysis
A total of 22 studies were included in the meta-analysis on mean difference of dose-functional parameters between functional and anatomic plans in the same patient.39,83,85–87,91,107,109–111,113–116,118–120,122,133,136,137,139 Dose-functional parameters fV20 and fMLD were chosen, as they were most frequently reported upon and have dose-volume analogs most commonly used in treatment planning. We chose to use the more commonly reported threshold definition of FL, and studies using the weighted method were excluded. Seven studies directly reported either raw data or the required statistics.83,87,111,122,133,137,139 Four studies’ authors were able to provide us with data for the analysis.86,109,118,119 Three studies reported the required statistics graphically,85,107,114 and 5 studies’ means and standard errors (SEs) were derived using P values.91,113,115,120,136 Three studies reported medians and ranges and were thus kept.39,110,116 Nine studies reported multiple different methods or definitions of FL, in which case only 1 outcome was included.82,86,87,110,111,114–116,133 Two studies had 1 patient each excluded because of clinically unacceptable plans.83,139 A detailed list of exclusions can be found in supplementary table E4.
The results of the meta-analysis can be seen in Figure 2. We report mean differences for fV20 and fMLD, split between perfusion (perf-) and ventilation (vent-)-defined FL. For all 4 parameters, functional avoidance planning resulted in statistically significant reductions: vent-fV20 absolute reduction of 3.22% (95% CI, 2.53-3.92); perf-fV20 absolute reduction of 3.52% (95% CI, 1.88-5.17); vent-fMLD absolute reduction of 1.3 Gy (95% CI, 0.85-1.76); and perf-fMLD absolute reduction of 2.41 (95% CI, 0.37-4.44). Heterogeneity was high, at 77% for vent-fV20, 89% for perf-fV20, 88% for vent-fMLD, and 89% for perf-fMLD. To assess for risk of bias, the JBI analytical cross-sectional study checklist was used.183 The average score for each analysis was: 7.37 of 8 (vent-fV20), 6.1 of 8 (perf-fV20), 7 of 8 (vent-fMLD), and 6.3 of 8 (perf-fMLD), indicating low risk of bias.
Fig. 2.
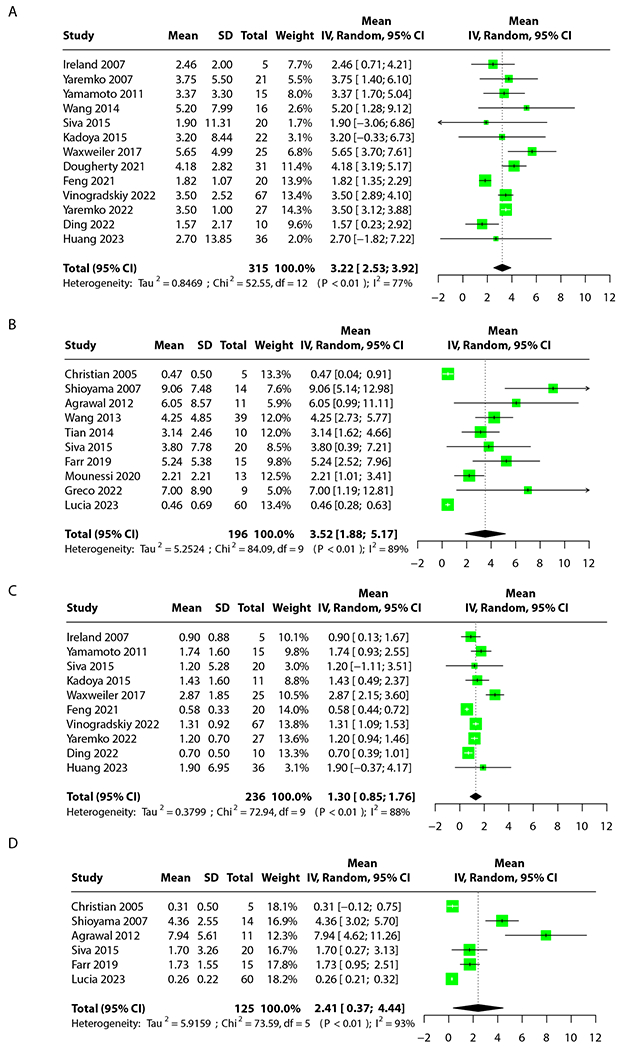
Meta-analysis results. (A) Ventilation dose parameter 20 to functional lung. Twelve studies analyzed across 300 patients. (B) Perfusion dose parameter 20 to functional lung. Ten studies analyzed across 196 patients. (C) Ventilation mean dose to functional lung. Nine studies analyzed across 221 patients. (D) Perfusion mean dose to functional lung. Six studies analyzed across 125 patients.
FL avoidance definitions: Sensitivity and metaregression
The results for the sensitivity analysis were not statistically significant, indicating that the varying definitions of FL did not influence the results of the meta-analysis. They can be found in Figure E2.
To assess the effect of FL definition on dosimetric parameters directly, instead of on differences between functional and anatomic plans, we then performed metaregression on studies that gave a specific, thresholded definition of FL. A total of 8 studies’ avoidance plans were included: 7 for fV20-vent71,86,111,115,118,119,131 and 5 for fMLD-vent.71,107,111,119,131 Because of a lack of studies that reported the required statistics for Q, those results were excluded. Several studies provided multiple definitions and parameters. Anatomic plans were not included. The results of the metaregression can be seen in Figure E3. A trend of decreased fV20 or fMLD was seen for higher cutoff thresholds. However, this trend was only statistically significant for fV20-vent (P = .0183) and not for fMLD-vent (P = .3670). Again, the JBI analytical cross-sectional checklist183 was used, with average scores of 7.4 of 8 (vent-fV20) and 7.2 of 8 (vent-fMLD), indicating low risk of bias overall. A detailed list of exclusions can be found in supplementary table E4.
Prediction of RILT
Thirty-six studies used FL information to generate a predictive model or prediction of risk for developing RILT.21,50,72–77,84,86,89,90,96,97,99,100,101,103–111,121,123,126,130,133,135,136,140–144,147,174,182,181 Table 2 details all such studies, which involve a variety of fractionation schedules including SBRT. Results were inconsistent, with some studies finding that the addition of functional parameters enhanced prediction or reduced incidence of RILT-related outcomes,50,84,86,90,96,97,99,103,105,121,123,130,135,136,140–142,144,147 whereas others did not.21,79,84,100,104,106,126,133,141,182,181
To better quantify the relationship between grade 2+ RP and FL irradiation, we analyzed how incorporating functional information can enhance grade 2+ RP prediction. A total of 10 studies were included: 7 for anatomic-only models,79,84,89,105,121,130,144 6 for models including Q information,79,84,99,121,130,144 and 5 for models including V information.89,101,105,143,144 Multiple studies included models across multiple categories. A detailed list of exclusions can be found in supplementary table E4.
The results of the analysis can be seen in Figure 3. The anatomic models had a mean AUC of 0.77 (95% CI, 0.67-0.88). The Q-including models had a mean AUC of 0.89 (95% CI, 0.87-0.90). The V-including models had a mean AUC of 0.85 (95% CI, 0.81-0.90). These results were not statistically significant because of the CI overlap. Notably, the anatomic models had a high χ2 value, indicating substantial interstudy variability. This was not seen with the Q and V models. The case series JBI checklist tool184 was used, with an average score of 7.7 of 10.
Fig. 3.
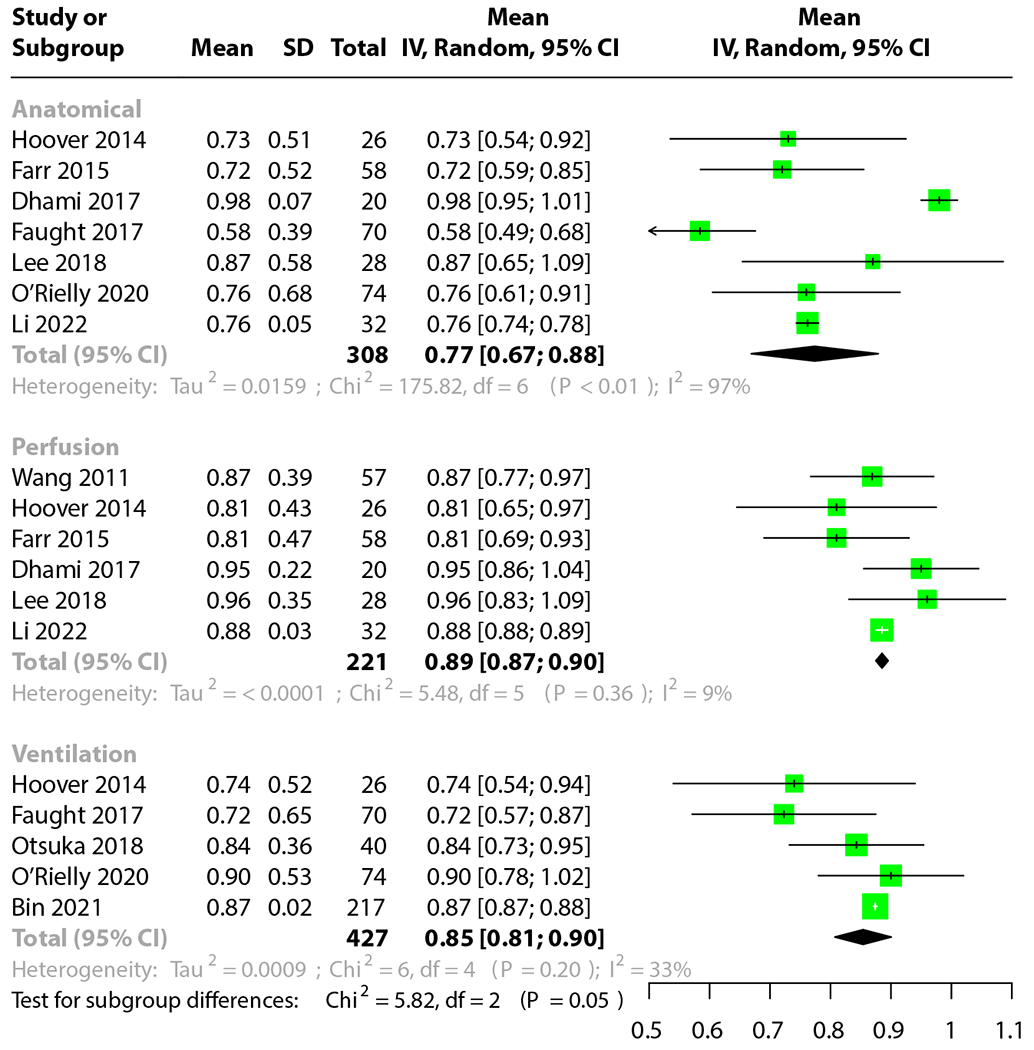
Meta-analysis of the area under the curve for prediction of grade 2+ radiation pneumonitis. Anatomic, perfusion, and ventilation-based models presented.
Interventional clinical trials
Recently, several interventional, multipatient clinical trials that employ functional avoidance planning have been published. The results of these 9 studies can be seen in Table 4.76,82,102,119,124,126,133,136,148 Only 2 studies included an anatomic arm to compare to the functional planning cohort.102,133 Of these, results were inconsistent: Thomas et al102 found a statistically significant reduction in dose-function parameters for plans used for treatment, but Yaremko et al133 did not. However, neither study reported any significant worsening of OAR or PTV metrics in the functional cohort compared with the anatomic cohorts. All single-arm studies that compared functional plans to anatomic plans computed for reference found reductions in dose-function parameters.76,82,102,119,133,136,148 Importantly, Miller et al124 found not only a reduction in functional parameters (as per a primary analysis by Vinogradskiy et al119), but also that the avoidance plans resulted in significantly better postlung RT PFT scores than the historical control. Similar to the results of the 2-arm comparative trials, the OAR and PTV metrics for functional plans were not significantly worse than anatomic plans, aside from a 1.4 Gy-increase in the cord max dose in Vinogradskiy et al.119 Two single-arm studies that assessed rates of RP found that functional planning significantly reduced the rate of grade 2+ RP119,136 relative to the historical control. Yaremko et al133—1 of the 2-arm studies—found no significant difference in grade 2+ RP between the 2 cohorts, though this result should be interpreted with caution, as the study was closed before full accrual and was not powered to detect RP differences.133
Table 4.
Interventional trials involving functional lung avoidance
| Study first author | N | Anatomic cohort? | FLI modality: Definition | RT modality | Technical results | Clinical outcomes | PTV and OAR, as compared with anatomic plan |
|---|---|---|---|---|---|---|---|
| Bucknell82 | 25 | No (anatomic plans included for reference) | V/Q PET: 70th percentile threshold | VMAT with midtreatment adaptation | Perfusion No statistically significant difference in fV20 or fMLD fV5 ↓ 5.1* in the functional plan No statistically significant benefit to midtreatment functional adaptation. V, no statistically significant difference in fMLD fV20 ↓ 1.4* in the functional plan fV5 ↓ 5.0* in the functional plan No statistically significant benefit to midtreatment functional adaptation |
The majority of patients with late-stage cancer benefitted from avoidance planning | Q, mean esophagus ↓ 0.6* V, no significant differences reported |
| Follacchio76 | 19 | No (anatomic plans included for reference) | SPECT Q: 60% of maximum threshold | IMRT: Choice of functional or anatomic plan was made individually for each patient | The best plan for patients in all cases was judged to be the functional plan | Two cases of grade 2 RP were observed during follow-up. A significant correlation was found between perfusion score and early-onset RILT. | All functional plans were clinically acceptable. |
| Huang136 | 36 | No (anatomic plans included for reference) | Xe CT V: Automated contouring | IMRT or VMAT | fV20 ↓ 1.7* in the functional plan fMLD ↓ 2.9* in the functional plan |
4 grade 2+ RP cases diagnosed at follow-up, found to be statistically significantly lower than historical control. 1 case of grade 3 esophagitis. 50% of patients developed disease progression. | Maximum dose ↑ 1.5* V20 ↓ 2* MLD ↓ 1.1* |
| Miller124 | 56 | No | CT V (HU-based): 15% of maximum threshold | N/A | Not reported | Avoidance planning reduces PFT results by less than standard anatomic plans compared with historical control. | Not reported |
| Thomas126 | 39 | No | SPECT Q: N/A | 19 IMRT/VMAT 20 Proton |
Not reported | 16 patients developed grade 2+ RP. COPD was the only significant predictor of grade 2+ RP development. No functional parameters were found to be significant. |
Not reported |
| Thomas102 | 28 (8:20) | Yes | SPECT Q: 70% of maximum threshold | Anatomic plan: 6 IMRT/VMAT 2 proton functional plan: 12 IMRT/VMAT 2 proton |
Medians reported. fMLD ↓ 7.9* in the functional cohort fV20 ↓ 12* in the functional cohort fV20 ↓ 23* in the functional cohort fV5 ↓ 24* in the functional cohort (all units EQD2) |
Significant perfusion changes between cohorts were found cohort only in the 0-5 Gy dose bin. The functional cohort had increased cohort perfusion in this region. | No statistically significant differences found between cohorts. |
| Vinogradskiy119 | 67 | No (anatomic plans included for reference) | CT V: 15% of maximum threshold | IMRT | fMLD ↓ 1.3* in the functional plan fV5 ↓ 3.4* in the functional plan fV10 ↓ 6.4* in the functional plan fV20 ↓3.5* in the functional fV30 ↓ 1.8* in the functional plan |
10 grade 2+ RP events 33 grade 2+ esophagitis events 14 grade 2+ dyspnea events 13 grade 2+ cough events 14 grade 2+ fatigue events RP reduction was statistically significant compared with plan historical control. |
PTV coverage ↓ 0.8* MLD ↓ 0.7* V20 ↓ 2* Cord max ↑ 1.4* Mean esophagus ↓ 0.7* |
| Yamamoto148 | 14 | No (anatomic plans included for reference) | CT V: Weighted | IMRT with midtreatment adaptation | fMLD ↓ 0.7* in functional adapted plan fV10 ↓ 2.8* in functional adapted plan fV20 ↓ 2.5* in functional adapted plan fV30 ↓ 1.1* in functional adapted plan |
Not reported | No significant differences found |
| Yaremko133 | 27 (11:16) | Yes | He-MRI: Threshold unspecifid | VMAT | No statistically significant reductions in dose-function parameters between cohorts. | No statistically significant differences in quality-of-life scores, RILT events, or disease progression statistics between cohorts. | No significant differences found between cohorts. |
Abbreviations: COPD = chronic obstructive pulmonary disease; CT = computed tomography; EQD2 = equivalent dose in 2 Gy fractions; FLI = functional lung imaging; fMLD = mean dose to functional lung; fVx = dose parameter (x) to functional lung, defined as in the modality column; He = helium; HU = Hounsfield unit; IMRT = intensity modulated radiation therapy; MLD = mean dose to non-PTV lung; Vx = dose parameter (x) to non-PTV lung; MRI = magnetic resonance imaging; OAR = organs at risk; PET = positron emission tomography; PFT = pulmonary function test; PTV = planning target volume; Q = perfusion; RILT = radiation-induced lung toxicities; RP = radiation pneumonitis; RT = radiation therapy; SPECT = single-photon emission computed tomography; V = ventilation; VMAT = volumetric modulated arc therapy; Xe = xenon.
Statistically significant.
Five interventional studies reported the rate of grade 2+ RP for the avoidance cohort.76,119,126,133,136 A detailed list of exclusions can be found in suppplementary document E4. Notably, Thomas et al126 used PBT on a substantial proportion of their cohort. We deemed this a confounding variable on an already small data set, as the remaining studies used only IMRT and VMAT. Excluding Thomas et al, we conducted a meta-analysis on the rate of grade 2+ RP for the remaining 4 studies. The results can be seen in Figure 4: for all interventional trials to-date, the incidence of grade 2+ RP for patients treated with IMRT or VMAT is 13% (95% CI, 8%-20%). The range was 11% to 15%, and the median was 11.5%. For all studies except Yaremko et al,133 we used the JBI quasi-experimental checklist.185 The mean score was 7.4 of 9. For Yaremko et al, we used the JBI randomized controlled trial checklist,184 for which the study achieved a perfect score.
Fig. 4.

Meta-analysis of incidence of grade 2+ radiation pneumonitis for intensity modulated radiation therapy and volumetric modulated arc therapy treated cohorts with functional avoidance planning.
Discussion
This review provides a comprehensive update to the state of knowledge relating to FLI for RT planning in lung cancer. We employed a variety of statistical methods to substantially increase the size of the previous meta-analysis and include an in-depth analysis of the significance of FL definition to study results. In addition, we provide a new analysis on the relationship between FLI and grade 2+ RP.
The 2 main purposes of this review were to investigate the difference in functional parameters between anatomic and functional plans and the ability of functional parameters to predict grade 2+ RP. The results of our analyses further solidify that avoidance planning substantially improves sparing of functional lung compared with anatomic plans for the same patient. This is the cornerstone of the integration of FLI into RT planning: all posited benefits of functional avoidance planning hinge on the concept that such planning will preferentially spare critical regions.
Our second outcome was less definitive. A previous meta-analysis on rates of grade 2+ RP for patients treated with standard chemoradiation prior to the use of adjuvant immune checkpoint inhibitors reported a rate of 29.8%.186 Our meta-analysis indicates that photon-based avoidance planning results in a significantly lower rate of 13% (95% CI, 8%-20%). Although some of the studies included patients treated with durvalumab, no durvalumab-era meta-analyses for grade 2+ RP rates exist for comparison. However, this drug typically is found to increase rates of grade 2+ RP,187,188 indicating that our historical control may be a conservative estimate and that our results likely maintain significance, though this should be balanced with an understanding that RT delivery techniques have also improved since then. Although the use of avoidance planning statistically significantly lowered functional parameters (Fig. 2) and thus decreased the rate of grade 2+ RP, we failed to find a statistically significant trend of increased predictive power of grade 2+ RP for models that incorporate FL information. The existence of a trend suggests that an increase in sample size may help determine whether there is a true difference between these groups of predictive models or not. Importantly, these 2 results are not in direct contradiction, but indicate that the full nature of the relationship between FL irradiation and grade 2+ RP may not yet be fully elucidated.
Recommendations: FLI modalities
The wide variety of FLI modalities available highlights a recurring issue: there is no agreement on the optimal modality for incorporation into RT planning. SPECT, PET, DECT, and MRI are expensive but are established methods of acquiring lung function measures, particularly DECT-Q as validated against SPECT-Q, with strong correlations.7,11 MRI and PET were not compared directly to the SPECT standard in any study.
CT-based methods, on the other hand, present cost-effective and convenient ways of extracting functional information from a scan that is already standardly required in the management of patients with lung cancer. However, as discussed, CT-V is inconsistent in correlation with SPECT,10,13,24–26,28–30,36 and no thoroughly validated Q analog currently exists. The previous review on CT-V corroborates this inconsistency.70
The substantial heterogeneity between all these methods, and even between V and Q SPECT,9,12,22 highlights the importance of homing in on 1 standard-of-care method to avoid confounding results. We thus recommend that the development of CT-V continues. The results of a recent clinical trial demonstrating a reduction in grade 2+ RP compared with historical control using CT-V119 suggests that although inconsistent, this method does show potential as a viable, convenient, and inexpensive alternative to other methods. We further recommend that future interventional trials consider using CT-V as one method of FL imaging, to allow for a more in-depth examination of the utility of this method.
Recommendations: Definitions
As with FLI modalities, definitions of FL vary widely between papers, raising concerns around synthesizing information between studies to determine the potential of FLI. The sparsity of investigation into the best definition is perhaps one of the largest gaps in the FLI literature at this point. We attempt to investigate this through our sensitivity and metaregression. Our sensitivity analysis shows that the definition of FL, for relevant studies, was not significant to the results of our meta-analysis. In contrast, our metaregression showed that in functional avoidance plans, when the cutoff value for defining lung as functional is low, functional parameters trend higher—though this trend only reached significance for fV20-vent. In some cases, this trend could be caused by the small volume of FL in the high-cutoff group, which may be easier to avoid. However, this may depend on FL location relative to the tumor: if they are too close, FL sparing will be challenging. Although the observed relationship in the metaregression may be cohort-dependent, it suggests that functional plans with higher cutoff values may see greater sparing of FL. In combination with the sensitivity analysis, it indicates that although the difference between functional and anatomic plans may not change based on FL definition, the raw value of the functional parameters may change. Further investigation into this trend, and for both V and Q, is thus warranted to determine whether it is true or spurious. Such investigation should also consider the viability of other definitions, such as the less commonly used weighting method, which has demonstrated predictive ability for RILT as well.50,73,78,90,97,99,104,121,123,126,140–144,147 We thus recommend that future studies investigate multiple different definitions of FL to contribute to a currently sparse pool of data.
Recommendations: Toxicity reduction
Information regarding the incidence of RILT in relation to FL irradiation, as well as the prediction of RILT using FL information, is suggestive but inconsistent. Current clinical trials indicate that avoidance planning reduces the rate of grade 2+ RP, as corroborated by our meta-analysis for VMAT and IMRT. However, when it comes to prediction, some studies show improved predictive ability compared with anatomic parameters, 50,84,86,90,96,97,99,103,105,121,123,130,135,136,140–142,144,147 although others do not.21,79,84,100,104,106,126,133,141,182,181 This is further corroborated by the inconclusive results of our own analysis, which may be improved with a larger data set.
We thus recommend that investigation of the relationship between avoidance planning and RILT continue. However, full reporting of all parameters and error bars related to results is critical for proper synthesis of information. We implore authors to report full details of models, including cutoff values for normal tissue complication probability models, 95% CIs, and the appropriate descriptive statistics for odds ratios, to facilitate future collaborative analyses.
Additionally, some—though not all—planning studies found that that FLI has the potential to raise doses to the lung,21,117,145,149 esophagus,21,71,87,114,145,146 heart,21,71,89,133,146 and spinal cord.21,81,89,92,111,118,119,139,145,146 Even if FLI reduces the rate of RILT, its benefit may be mitigated by an increase in other organ toxicities. This tradeoff is critically important and must be elucidated to determine the overall benefit of FLI for RT treatment planning. We thus further suggest that authors also report nonlung OAR dosimetry and toxicity outcome differences between conventional and avoidance techniques.
Recommendations: Future trials
There is increasing interest in prospective trials integrating FL avoidance planning. Most trials to date are single arm, and these largely found improvements compared with historical means and anatomic plans.82 However, 1 contemporary trial that incorporated PBT had a markedly high rate of grade 2+ RP,126 while another study found an improvement in functional parameters compared with anatomic plans but found no substantial benefit to midtreatment functional adaptation using those plans.82 The only 2-arm trials provide conflicting results, with one finding improvements between cohorts102 and the other finding no significant difference.133
Prospective interventional trials represent the best opportunity to fully understand the effect of avoidance planning on the development of RILT. Although our meta-analysis indicates that IMRT and VMAT avoidance planning may significantly reduce the rate of grade 2+ RP, comparison to older review articles and historical controls is not ideal, as this does not control for advances in technologies, administration of treatments, and differences between cohorts. We thus recommend the use of comparative trials, particularly randomized study designs, when possible, to better understand the effect of FL avoidance on RILT and other clinical outcomes. Current clinical trials registered on clinicaltrials.gov include 1 2-arm trial (National Clinical Trial [NCT]05302817189) and 3 1-arm trials (NCT05134558,190 NCT02773238,191 NCT02492867192), 2 of which aim to assess the incidence of RILT as a result of the intervention.
Limitations: Literature
Although the included studies report on a wealth of knowledge regarding FLI in the context of lung cancer, the individual studies do have some limitations. Apart from established concerns about small sample size, it is important to keep in mind that nearly every planning study provided few details on the rationale for its chosen FL definition. With little existing data on the most robust and RILT-predictive definition, the utility of individual study results must be taken with caution.
Furthermore, of the predictive modeling studies provided, almost none conducted external validation of their models. Although the predictive performance of FL information is important to assess, trained and fitted models that have not been tested on validation data should not be considered wholly complete. As such, there is an inherent bias to presenting a model that has only been tested on data from the cohort it was originally fitted to.
Finally, although the studies included in the tables do come from a variety of continents, medical centers, and populations, those that responded to our requests for data were exclusively authors at Western institutions. As a result, many studies from non-Western institutions, particularly Asia, had to be excluded from our analyses, introducing an inherent under-representation of particular populations of patients with lung cancer and health care systems in the statistical analyses.
Overall, by completing the relevant JBI checklists, we found that studies generally had low risk of bias. However, we acknowledge that this is not a foolproof or complete method, and that—as always—results should be taken in-context and with caution.
Limitations: Review design and statistical analysis
Our review design is not without limitations. To begin, some of our analyses have small sample sizes, and for others, approximations had to be made for them to be included. Although we attempt to account for the small sample sizes using the appropriate weighting techniques, it remains that the results of these studies may be skewed because of the small number of patients involved. Furthermore, the studies included in this review have heterogeneous lung cancer types, RT modalities, FLI modalities, and FL definitions. We attempted to mitigate this where possible, by eliminating studies that used the weighting FL definition, creating a strict cutoff for the metaregression to account for different threshold-determining methods, and by removing proton therapy for the interventional FLI trial meta-analysis of RP rates. Although all these decisions improve the uniformity of the data, some degree of heterogeneity remains, as there are insufficient papers to independently analyze and control for every possible combination of the confounders. Our study is also limited by the inconsistent choice of reported statistics: although our tables are large, the number of studies in each table that make it to the analysis is small, because many studies do not report the required statistics for the analysis—a byproduct of our attempt to control for the aforementioned variables of concern. Conclusions drawn should thus be interpreted with caution. Finally, all of our functional parameter meta-analyses had high heterogeneity, again indicating that results should be interpreted with caution.
Conclusions
FLI demonstrates substantial potential to spare functioning lung in patients with lung cancer. However, the costs of additional pretreatment scans and potential technical challenges70 necessitate an in-depth examination of any potential benefit that incorporation of FLI into RT may have for lung cancer. Our understanding of this field is currently limited by inconsistency in definition of FL, FLI modality used, and reporting of relevant post-RT outcomes. An increased number of interventional trials, with more on the way, will provide for a more direct approach to understand the effect of avoidance planning on dosimetric parameters and clinical outcomes.
Supplementary Material
Acknowledgments—
We are grateful to Tokihiro Yamamoto, Shankar Siva, Charlie Matrosic, Jingjing M. Dougherty, Jason St-Hilaire, and Luc Beaulieu for providing us with data in response to our requests.
Disclosures:
Y.V. reported research funding from MIM Software. D.P. reports a Clinician-Scientist Grant from the Ontario Institute for Cancer Research, royalties from Uptodate.com, and a consultant role with equity from Need Inc, all unrelated to the current work. No other disclosures were reported. This research was partially funded by NIH grant R01CA236857 and NCI grant 1UG3CA247605.
Footnotes
Supplementary material associated with this article can be found, in the online version, at doi:10.1016/j.ijrobp.2024.04.001.
Data Sharing Statement:
All data used are from published projects and are available publicly or upon request.
References
- 1.Yang P Epidemiology of lung cancer prognosis: Quantity and quality of life. Methods Mol Biol 2009;471:469–486. [DOI] [PMC free article] [PubMed] [Google Scholar]
- 2.Gadgeel SM, Ramalingam SS, Kalemkerian GP. Treatment of lung cancer. Radiol Clin North Am 2012;50:961–974. [DOI] [PubMed] [Google Scholar]
- 3.Arroyo-Hernández M, Maldonado F, Lozano-Ruiz F, Muñoz-Montaño W, Nuñez-Baez M, Arrieta O. Radiation-induced lung injury: Current evidence. BMC Pulm Med 2021;21:9. [DOI] [PMC free article] [PubMed] [Google Scholar]
- 4.Bucknell NW, Hardcastle N, Bressel M, et al. Functional lung imaging in radiation therapy for lung cancer: A systematic review and meta-analysis. Radiother Oncol 2018;129:196–208. [DOI] [PubMed] [Google Scholar]
- 5.Hozo SP, Djulbegovic B, Hozo I. Estimating the mean and variance from the median, range, and the size of a sample. BMC Med Res Methodol 2005;5:13. [DOI] [PMC free article] [PubMed] [Google Scholar]
- 6.Wan X, Wang W, Liu J, Tong T. Estimating the sample mean and standard deviation from the sample size, median, range and/or inter-quartile range. BMC Med Res Methodol 2014;14:135. [DOI] [PMC free article] [PubMed] [Google Scholar]
- 7.Bahig H, Campeau M-P, Lapointe A, et al. Phase 1-2 study of dual-energy computed tomography for assessment of pulmonary function in radiation therapy planning. Int J Radiat Oncol Biol Phys 2017;99:334–343. [DOI] [PubMed] [Google Scholar]
- 8.Castillo R, Castillo E, McCurdy M, et al. Spatial correspondence of 4D CT ventilation and SPECT pulmonary perfusion defects in patients with malignant airway stenosis. Phys Med Biol 2012;57:1855–1871. [DOI] [PubMed] [Google Scholar]
- 9.Forghani F, Patton T, Kwak J, et al. Characterizing spatial differences between SPECT-ventilation and SPECT-perfusion in patients with lung cancer undergoing radiotherapy. Radiother Oncol 2021;160:120–124. [DOI] [PMC free article] [PubMed] [Google Scholar]
- 10.Hegi-Johnson F, Keall P, Barber J, Bui C, Kipritidis J. Evaluating the accuracy of 4D-CT ventilation imaging: First comparison with Technegas SPECT ventilation. Med Phys 2017;44:4045–4055. [DOI] [PubMed] [Google Scholar]
- 11.Lapointe A, Bahig H, Blais D, et al. Assessing lung function using contrast-enhanced dual-energy computed tomography for potential applications in radiation therapy. Med Phys 2017;44:5260–5269. [DOI] [PubMed] [Google Scholar]
- 12.Nakajima Y, Kadoya N, Kimura T, Hioki K, Jingu K, Yamamoto T. Variations between dose-ventilation and dose-perfusion metrics in radiation therapy planning for lung cancer. Adv Radiat Oncol 2020;5:459–465. [DOI] [PMC free article] [PubMed] [Google Scholar]
- 13.Nyeng TB, Møller DS, Farr K, et al. A comparison of two methods for segmentation of functional volumes in radiotherapy planning of lung cancer patients. Acta Oncol 2021;60:353–360. [DOI] [PubMed] [Google Scholar]
- 14.Porter EM, Myziuk NK, Quinn TJ, et al. Synthetic pulmonary perfusion images from 4DCT for functional avoidance using deep learning. Phys Med Biol 2021;66 175005. [DOI] [PubMed] [Google Scholar]
- 15.Ren G, Lam S-K, Zhang J, et al. Investigation of a novel deep learning-based computed tomography perfusion mapping framework for functional lung avoidance radiotherapy. Front Oncol 2021;11 644703. [DOI] [PMC free article] [PubMed] [Google Scholar]
- 16.Ren G, Li B, Lam S-K, et al. A Transfer learning framework for deep learning-based CT-to-perfusion mapping on lung cancer patients. Front Oncol 2022;12 883516. [DOI] [PMC free article] [PubMed] [Google Scholar]
- 17.Suga K, Kawakami Y, Zaki M, Yamashita T, Shimizu K, Matsunaga N. Clinical utility of co-registered respiratory-gated 99mTc-Technegas/MAA SPECT-CT images in the assessment of regional lung functional impairment in patients with lung cancer. Eur J Nucl Med Mol Imaging 2004;31:1280–1290. [DOI] [PubMed] [Google Scholar]
- 18.Yin L, Shcherbinin S, Celler A, et al. Incorporating quantitative single photon emission computed tomography into radiation therapy treatment planning for lung cancer: Impact of attenuation and scatter correction on the single photon emission computed tomography—weighted mean dose and functional lung segmentation. Int J Radiat Oncol Biol Phys 2010;78:587–594. [DOI] [PubMed] [Google Scholar]
- 19.Yin LS, Tang L, Hamarneh G, et al. Complexity and accuracy of image registration methods in SPECT-guided radiation therapy. Phys Med Biol 2009;55:237–246. [DOI] [PubMed] [Google Scholar]
- 20.Castillo E, Nair G, Turner-Lawrence D, et al. Quantifying pulmonary perfusion from noncontrast computed tomography. Med Phys 2021;48:1804–1814. [DOI] [PMC free article] [PubMed] [Google Scholar]
- 21.Lee E, Zeng J, Miyaoka RS, et al. Functional lung avoidance and response adaptive escalation (FLARE) RT: Multimodality plan dosimetry of a precision radiation oncology strategy. Med Phys 2017;44:3418–3429. [DOI] [PMC free article] [PubMed] [Google Scholar]
- 22.Yuan ST, Frey KA, Gross MD, et al. Semiquantification and classification of local pulmonary function by V/Q single photon emission computed tomography in patients with non-small cell lung cancer: Potential indication for radiotherapy planning. J Thorac Oncol 2011;6:71–78. [DOI] [PMC free article] [PubMed] [Google Scholar]
- 23.Castillo E, Castillo R, Vinogradskiy Y, et al. Robust CT ventilation from the integral formulation of the Jacobian. Med Phys 2019;46:2115–2125. [DOI] [PMC free article] [PubMed] [Google Scholar]
- 24.Cazoulat G, Balter JM, Matuszak MM, Jolly S, Owen D, Brock KK. Mapping lung ventilation through stress maps derived from biomechanical models of the lung. Med Phys 2021;48:715–723. [DOI] [PMC free article] [PubMed] [Google Scholar]
- 25.Kipritidis J, Tahir BA, Cazoulat G, et al. The VAMPIRE challenge: A multi-institutional validation study of CT ventilation imaging. Med Phys 2019;46:1198–1217. [DOI] [PMC free article] [PubMed] [Google Scholar]
- 26.Liu Z, Tian Y, Miao J, et al. Deriving pulmonary ventilation images from clinical 4D-CBCT using a deep learning-based model. Front Oncol 2022;12 889266. [DOI] [PMC free article] [PubMed] [Google Scholar]
- 27.Pinkham DW, Negahdar M, Yamamoto T, et al. A feasibility study of single-inhalation, single-energy xenon-enhanced CT for high-resolution imaging of regional lung ventilation in humans. Acad Radiol 2019;26:38–49. [DOI] [PubMed] [Google Scholar]
- 28.Tian Y, Miao J, Liu Z, et al. Availability of a simplified lung ventilation imaging algorithm based on four-dimensional computed tomography. Phys Med 2019;65:53–58. [DOI] [PubMed] [Google Scholar]
- 29.Yamamoto T, Kabus S, Lorenz C, et al. 4D CT lung ventilation images are affected by the 4D CT sorting method. Med Phys 2013;40 101907. [DOI] [PMC free article] [PubMed] [Google Scholar]
- 30.Yamamoto T, Kabus S, Lorenz C, et al. Pulmonary ventilation imaging based on 4-dimensional computed tomography: Comparison with pulmonary function tests and SPECT ventilation images. Int J Radiat Oncol Biol Phys 2014;90:414–422. [DOI] [PMC free article] [PubMed] [Google Scholar]
- 31.Das SK, Miften MM, Zhou S, et al. Feasibility of optimizing the dose distribution in lung tumors using fluorine-18-fluorodeoxyglucose positron emission tomography and single photon emission computed tomography guided dose prescriptions. Med Phys 2004;31:1452–1461. [DOI] [PubMed] [Google Scholar]
- 32.Yamamoto T, Kabus S, von Berg J, et al. Reproducibility of four-dimensional computed tomography-based lung ventilation imaging. Acad Radiol 2012;19:1554–1565. [DOI] [PMC free article] [PubMed] [Google Scholar]
- 33.Jensen KR, Brink C, Hansen O, Bernchou U. Ventilation measured on clinical 4D-CBCT: Increased ventilation accuracy through improved image quality. Radiother Oncol 2017;125:459–463. [DOI] [PubMed] [Google Scholar]
- 34.Kipritidis J, Siva S, Hofman MS, Callahan J, Hicks RJ, Keall PJ. Validating and improving CT ventilation imaging by correlating with ventilation 4D-PET/CT using 68 Ga-labeled nanoparticles. Med Phys 2013;41011910. [DOI] [PubMed] [Google Scholar]
- 35.Brennan D, Schubert L, Diot Q, et al. Clinical validation of 4-dimensional computed tomography ventilation with pulmonary function test data. Int J Radiat Oncol Biol Phys 2015;92:423–429. [DOI] [PMC free article] [PubMed] [Google Scholar]
- 36.Castillo E, Castillo R, Vinogradskiy Y, et al. Technical note: On the spatial correlation between robust CT-ventilation methods and SPECT ventilation. Med Phys 2020;47:5731–5738. [DOI] [PMC free article] [PubMed] [Google Scholar]
- 37.Ding K, Bayouth JE, Buatti JM, Christensen GE, Reinhardt JM. 4DCT-based measurement of changes in pulmonary function following a course of radiation therapy. Med Phys 2010;37:1261–1272. [DOI] [PMC free article] [PubMed] [Google Scholar]
- 38.Eslick EM, Kipritidis J, Gradinscak D, et al. CT ventilation imaging derived from breath hold CT exhibits good regional accuracy with Galligas PET. Radiother Oncol 2018;127:267–273. [DOI] [PubMed] [Google Scholar]
- 39.Feng A, Shao Y, Wang H, et al. A novel lung-avoidance planning strategy based on 4DCT ventilation imaging and CT density characteristics for stage III non-small-cell lung cancer patients. Strahlenther Onkol 2021;197:1084–1092. [DOI] [PMC free article] [PubMed] [Google Scholar]
- 40.Kipritidis J, Hofman MS, Siva S, et al. Estimating lung ventilation directly from 4D CT Hounsfield unit values. Med Phys 2015;43:33–43. [DOI] [PubMed] [Google Scholar]
- 41.Latifi K, Forster KM, Hoffe SE, et al. Dependence of ventilation image derived from 4D CT on deformable image registration and ventilation algorithms. J Appl Clin Med Phys 2013;14:4247. [DOI] [PMC free article] [PubMed] [Google Scholar]
- 42.Nyeng TB, Kallehauge JF, Høyer M, Petersen JBB, Poulsen PR, Muren LP. Clinical validation of a 4D-CT based method for lung ventilation measurement in phantoms and patients. Acta Oncol 2011;50:897–907. [DOI] [PubMed] [Google Scholar]
- 43.Tahir BA, Hughes PJC, Robinson SD, et al. Spatial comparison of CT-based surrogates of lung ventilation with hyperpolarized helium-3 and xenon-129 gas MRI in patients undergoing radiation therapy. Int J Radiat Oncol Biol Phys 2018;102:1276–1286. [DOI] [PubMed] [Google Scholar]
- 44.Kipritidis J, Hugo G, Weiss E, Williamson J, Keall PJ. Measuring interfraction and intrafraction lung function changes during radiation therapy using four-dimensional cone beam CT ventilation imaging. Med Phys 2015;42:1255–1267. [DOI] [PMC free article] [PubMed] [Google Scholar]
- 45.Woodruff HC, Shieh CC, Hegi-Johnson F, Keall PJ, Kipritidis J. Quantifying the reproducibility of lung ventilation images between 4dimensional cone beam CT and 4-dimensional CT. Med Phys 2017;44:1771–1781. [DOI] [PubMed] [Google Scholar]
- 46.Mathew L, Wheatley A, Castillo R, et al. Hyperpolarized 3He magnetic resonance imaging. Acad Radiol 2012;19:1546–1553. [DOI] [PubMed] [Google Scholar]
- 47.Vinogradskiy Y, Koo PJ, Castillo R, et al. Comparison of 4-dimensional computed tomography ventilation with nuclear medicine ventilation-perfusion imaging: A clinical validation study. Int J Radiat Oncol Biol Phys 2014;89:199–205. [DOI] [PMC free article] [PubMed] [Google Scholar]
- 48.Guerrero T, Sanders K, Noyola-Martinez J, et al. Quantification of regional ventilation from treatment planning CT. Int J Radiat Oncol Biol Phys 2005;62:630–634. [DOI] [PubMed] [Google Scholar]
- 49.Zhong Y, Vinogradskiy Y, Chen L, et al. Technical note: Deriving ventilation imaging from 4DCT by deep convolutional neural network. Med Phys 2019;46:2323–2329. [DOI] [PMC free article] [PubMed] [Google Scholar]
- 50.Lan F, Jeudy J, Senan S, et al. Should regional ventilation function be considered during radiation treatment planning to prevent radiation-induced complications? Med Phys 2016;43:5072–5079. [DOI] [PubMed] [Google Scholar]
- 51.Latifi K, Dilling TJ, Feygelman V, et al. Impact of dose on lung ventilation change calculated from 4D-CT using deformable image registration in lung cancer patients treated with SBRT. J Radiat Oncol 2015;4:265–270. [Google Scholar]
- 52.Zhong H, Jin J-Y, Ajlouni M, Movsas B, Chetty IJ. Measurement of regional compliance using 4DCT images for assessment of radiation treatment. Med Phys 2011;38:1567–1578. [DOI] [PMC free article] [PubMed] [Google Scholar]
- 53.Vicente E, Modiri A, Kipritidis J, et al. Functionally weighted airway sparing (FWAS): A functional avoidance method for preserving post-treatment ventilation in lung radiotherapy. Phys Med Biol 2020;65165010. [DOI] [PubMed] [Google Scholar]
- 54.Kazemzadeh N, Modiri A, Samanta S, et al. Virtual bronchoscopy-guided treatment planning to map and mitigate radiation-induced airway injury in lung SAbR. Int J Radiat Oncol Biol Phys 2018;102:210–218. [DOI] [PMC free article] [PubMed] [Google Scholar]
- 55.Grover J, Byrne HL, Sun Y, Kipritidis J, Keall P. Investigating the use of machine learning to generate ventilation images from CT scans. Med Phys 2022;49:5258–5267. [DOI] [PMC free article] [PubMed] [Google Scholar]
- 56.Jafari P, Yaremko BP, Parraga G, Hoover DA, Sadeghi-Naini A and Samani A, 4DCT ventilation map construction using biomechanics-base image registration and enhanced air segmentation, In: Presented at: 2019 41st Annual International Conference of the IEEE Engineering in Medicine and Biology Society (EMBC), Berlin, Germany, 2019, July 23-27. [DOI] [PubMed] [Google Scholar]
- 57.Vicente EM, Modiri A, Kipritidis J, et al. Combining serial and parallel functionality in functional lung avoidance radiation therapy. Int J Radiat Oncol Biol Phys 2022;113:456–468. [DOI] [PMC free article] [PubMed] [Google Scholar]
- 58.Li Z, Le Roux P-Y, Callahan J, et al. Quantitative assessment of ventilation-perfusion relationships with gallium-68 positron emission tomography/computed tomography imaging in lung cancer patients. Phys Imaging Radiat Oncol 2022;22:8–12. [DOI] [PMC free article] [PubMed] [Google Scholar]
- 59.Hardcastle N, Hofman MS, Hicks RJ, et al. Accuracy and utility of deformable image registration in 68Ga 4D PET/CT assessment of pulmonary perfusion changes during and after lung radiation therapy. Int J Radiat Oncol Biol Phys 2015;93:196–204. [DOI] [PubMed] [Google Scholar]
- 60.Le Roux P-Y, Siva S, Callahan J, et al. Automatic delineation of functional lung volumes with (68)Ga-ventilation/perfusion PET/CT. EJNMMI Res 2017;7 82–82. [DOI] [PMC free article] [PubMed] [Google Scholar]
- 61.Callahan J, Hofman MS, Siva S, et al. High-resolution imaging of pulmonary ventilation and perfusion with 68Ga-VQ respiratory gated (4-D) PET/CT. Eur J Nucl Med Mol Imaging 2013;41:343–349. [DOI] [PubMed] [Google Scholar]
- 62.McIntosh L, Jackson P, Hardcastle N, et al. Automated assessment of functional lung imaging with (68)Ga-ventilation/perfusion PET/CT using iterative histogram analysis. EJNMMI Phys 2021;8:23. [DOI] [PMC free article] [PubMed] [Google Scholar]
- 63.Gaudreault M, Korte J, Bucknell N, et al. Comparison of dual-energy CT with positron emission tomography for lung perfusion imaging in patients with non-small cell lung cancer. Phys Med Biol 2023;68 035015. [DOI] [PubMed] [Google Scholar]
- 64.Matrosic CK, Owen DR, Polan D, et al. Feasibility of function-guided lung treatment planning with parametric response mapping. J Appl Clin Med Phys 2021;22:80–89. [DOI] [PMC free article] [PubMed] [Google Scholar]
- 65.Ireland RH, Woodhouse N, Hoggard N, et al. An image acquisition and registration strategy for the fusion of hyperpolarized helium-3 MRI and x-ray CT images of the lung. Phys Med Biol 2008;53:6055–6063. [DOI] [PMC free article] [PubMed] [Google Scholar]
- 66.Rankine LJ, Wang Z, Driehuys B, Marks LB, Kelsey CR, Das SK. Correlation of regional lung ventilation and gas transfer to red blood cells: Implications for functional-avoidance radiation therapy planning. Int J Radiat Oncol Biol Phys 2018;101:1113–1122. [DOI] [PMC free article] [PubMed] [Google Scholar]
- 67.Allen AM, Albert M, Caglar HB, et al. Can hyperpolarized helium MRI add to radiation planning and follow-up in lung cancer? J Appl Clin Med Phys 2011;12:3357. [DOI] [PMC free article] [PubMed] [Google Scholar]
- 68.Defraene G, van Elmpt W, De Ruysscher D. Regional lung avoidance by CT numbers to reduce radiation-induced lung damage risk in non-small–cell lung cancer: A simulation study. Acta Oncol 2019;59:201–207. [DOI] [PubMed] [Google Scholar]
- 69.Kimura T, Nishibuchi I, Murakami Y, Kenjo M, Kaneyasu Y, Nagata Y. Functional image-guided radiotherapy planning in respiratory-gated intensity-modulated radiotherapy for lung cancer patients with chronic obstructive pulmonary disease. Int J Radiat Oncol Biol Phys 2012;82:e663–e670. [DOI] [PubMed] [Google Scholar]
- 70.Hegi-Johnson F, de Ruysscher D, Keall P, et al. Imaging of regional ventilation: Is CT ventilation imaging the answer? A systematic review of the validation data. Radiother Oncol 2019;137:175–185. [DOI] [PubMed] [Google Scholar]
- 71.Huang T-C, Hsiao C-Y, Chien C-R, Liang J-A, Shih T-C, Zhang GG. IMRT treatment plans and functional planning with functional lung imaging from 4D-CT for thoracic cancer patients. Radiat Oncol 2013;8:3. [DOI] [PMC free article] [PubMed] [Google Scholar]
- 72.Farr KP, Møller DS, Khalil AA, Kramer S, Morsing A, Grau C. Loss of lung function after chemo-radiotherapy for NSCLC measured by perfusion SPECT/CT: Correlation with radiation dose and clinical morbidity. Acta Oncol 2015;54:1350–1354. [DOI] [PubMed] [Google Scholar]
- 73.Ding X, Man X, Sun M, et al. Which is the optimal threshold for defining functional lung in single-photon emission computed tomography lung perfusion imaging of lung cancer patients? Nucl Med Comm 2018;39:103–109. [DOI] [PubMed] [Google Scholar]
- 74.Meng X, Frey K, Matuszak M, et al. Changes in functional lung regions during the course of radiation therapy and their potential impact on lung dosimetry for non-small cell lung cancer. Int J Radiat Oncol Biol Phys 2014;89:145–151. [DOI] [PMC free article] [PubMed] [Google Scholar]
- 75.Vinogradskiy YY, Castillo R, Castillo E, Chandler A, Martel MK, Guerrero T. Use of weekly 4DCT-based ventilation maps to quantify changes in lung function for patients undergoing radiation therapy. Med Phys 2011;39:289. [DOI] [PubMed] [Google Scholar]
- 76.Follacchio GA, D’Urso P, Cassese R, et al. Functional lung volume mapping with perfusion single-photon emission computed tomography scan for radiotherapy planning in patients with locally advanced nonsmall cell lung cancer. Nucl Med Commun 2020;41:1026–1033. [DOI] [PubMed] [Google Scholar]
- 77.Kida S, Bal M, Kabus S, et al. CT ventilation functional image-based IMRT treatment plans are comparable to SPECT ventilation functional image-based plans. Radiother Oncol 2016;118:521–527. [DOI] [PubMed] [Google Scholar]
- 78.Sharifi H, McDonald GC, Lee JK, Ajlouni MI, Chetty IJ, Zhong H. Four-dimensional computed tomography-based biomechanical measurements of pulmonary function and their correlation with clinical outcome for lung stereotactic body radiation therapy patients. Quant Imaging Med Surg 2019;9:1278–1287. [DOI] [PMC free article] [PubMed] [Google Scholar]
- 79.Lee HJ Jr., Zeng J, Vesselle HJ, Patel SA, Rengan R, Bowen SR. Correlation of functional lung heterogeneity and dosimetry to radiation pneumonitis using perfusion SPECT/CT and FDG PET/CT imaging. Int J Radiat Oncol Biol Phys 2018;102:1255–1264. [DOI] [PMC free article] [PubMed] [Google Scholar]
- 80.Cai J, McLawhorn R, Altes TA, et al. Helical tomotherapy planning for lung cancer based on ventilation magnetic resonance imaging. Med Dosim 2011;36:389–396. [DOI] [PubMed] [Google Scholar]
- 81.Iqbal GMD, Zhang H, D’Souza W, Ha L, Rosenberger JM. Four-dimensional computed tomography-based ventilation imaging in intensity-modulated radiation therapy treatment planning for pulmonary functional avoidance. J Appl Clin Med Phys 2023;24:e13920. [DOI] [PMC free article] [PubMed] [Google Scholar]
- 82.Bucknell N, Hardcastle N, Gunewardena R, et al. Mid-treatment adaptive planning during thoracic radiation using 68 ventilation-perfusion positron emission tomography. Clin Transl Radiat Oncol 2023;40 100599. [DOI] [PMC free article] [PubMed] [Google Scholar]
- 83.Christian JA, Partridge M, Nioutsikou E, et al. The incorporation of SPECT functional lung imaging into inverse radiotherapy planning for non-small cell lung cancer. Radiother Oncol 2005;77:271–277. [DOI] [PubMed] [Google Scholar]
- 84.Dhami G, Zeng J, Vesselle HJ, et al. Rahmenbedingungen zur Risikos-tratifizierung einer Strahlenpneumonie anhand anatomischer und perfundierter Lungendosimetrie [Framework for radiation pneumonitis risk stratification based on anatomic and perfused lung dosimetry]. Strahlenther Onkol 2017;193:410–418 [in German]. [DOI] [PMC free article] [PubMed] [Google Scholar]
- 85.Ding Y, Yang L, Zhou Q, et al. A pilot study of function-based radiation therapy planning for lung cancer using hyperpolarized xenon-129 ventilation MRI. J Appl Clin Med Phys 2022;23 e13502–e13502. [DOI] [PMC free article] [PubMed] [Google Scholar]
- 86.Dougherty JM, Castillo E, Castillo R, et al. Functional avoidance-based intensity modulated proton therapy with 4DCT derived ventilation imaging for lung cancer. J Appl Clin Med Phys 2021;22:276–285. [DOI] [PMC free article] [PubMed] [Google Scholar]
- 87.Farr KP, West K, Yeghiaian-Alvandi R, et al. Functional perfusion image guided radiation treatment planning for locally advanced lung cancer. Phys Imaging Radiat Oncol 2019;11:76–81. [DOI] [PMC free article] [PubMed] [Google Scholar]
- 88.Faught AM, Olsen L, Schubert L, et al. Functional-guided radiotherapy using knowledge-based planning. Radiother Oncol 2018;129:494–498. [DOI] [PMC free article] [PubMed] [Google Scholar]
- 89.Faught AM, Miyasaka Y, Kadoya N, et al. Evaluating the toxicity reduction with computed tomographic ventilation functional avoidance radiation therapy. Int J Radiat Oncol Biol Phys 2017;99:325–333. [DOI] [PMC free article] [PubMed] [Google Scholar]
- 90.Faught AM, Yamamoto T, Castillo R, et al. Evaluating which dose-function metrics are most critical for functional-guided radiation therapy. Int J Radiat Oncol Biol Phys 2017;99:202–209. [DOI] [PMC free article] [PubMed] [Google Scholar]
- 91.Greco C, Fiore M, Valenza V, et al. Precision radiotherapy by SPECT lung functional imaging in NSCLC. J Men Health 2022;18:101. [Google Scholar]
- 92.Huang Q, Jabbour SK, Xiao Z, et al. Dosimetric feasibility of 4DCT-ventilation imaging guided proton therapy for locally advanced non-small-cell lung cancer. Radiat Oncol 2018;13:78. [DOI] [PMC free article] [PubMed] [Google Scholar]
- 93.Ieko Y, Kadoya N, Kanai T, et al. The impact of 4DCT-ventilation imaging-guided proton therapy on stereotactic body radiotherapy for lung cancer. Radiol Phys Technol 2020;13:230–237. [DOI] [PubMed] [Google Scholar]
- 94.Lavrenkov K, Christian JA, Partridge M, et al. A potential to reduce pulmonary toxicity: The use of perfusion SPECT with IMRT for functional lung avoidance in radiotherapy of non-small cell lung cancer. Radiother Oncol 2007;83:156–162. [DOI] [PubMed] [Google Scholar]
- 95.Lavrenkov K, Singh S, Christian JA, et al. Effective avoidance of a functional SPECT-perfused lung using intensity modulated radiotherapy (IMRT) for non-small cell lung cancer (NSCLC): An update of a planning study. Radiother Oncol 2009;91:349–352. [DOI] [PubMed] [Google Scholar]
- 96.Kanai T, Kadoya N, Nakajima Y, et al. Evaluation of functionally weighted dose-volume parameters for thoracic stereotactic ablative radiotherapy (SABR) using CT ventilation. Phys Med 2018;49:47–51. [DOI] [PubMed] [Google Scholar]
- 97.Li S, Liu J, Gao S, et al. CT ventilation image-guided helical tomotherapy at sparing functional lungs for locally advanced lung cancer: Analysis of dose-function metrics and the impact on pulmonary toxicity. Radiat Oncol 2023;18:6. [DOI] [PMC free article] [PubMed] [Google Scholar]
- 98.Patton TJ, Gerard SE, Shao W, Christensen GE, Reinhardt JM, Bayouth JE. Quantifying ventilation change due to radiation therapy using 4DCT Jacobian calculations. Med Phys 2018;45:4483–4492. [DOI] [PMC free article] [PubMed] [Google Scholar]
- 99.Wang D, Li B, Wang Z, et al. Functional dose-volume histograms for predicting radiation pneumonitis in locally advanced non-small cell lung cancer treated with late-course accelerated hyperfractionated radiotherapy. Exp Ther Med 2011;2:1017–1022. [DOI] [PMC free article] [PubMed] [Google Scholar]
- 100.Weller A, Dunlop A, Oxer A, et al. Spect perfusion imaging versus CT for predicting radiation injury to normal lung in lung cancer patients. Br J Radiol 2019;92 . [DOI] [PMC free article] [PubMed] [Google Scholar]
- 101.Otsuka M, Monzen H, Matsumoto K, et al. Evaluation of lung toxicity risk with computed tomography ventilation image for thoracic cancer patients. PLoS One 2018;13 e0204721. [DOI] [PMC free article] [PubMed] [Google Scholar]
- 102.Thomas HMT, Zeng J, Lee HJ Jr., et al. Comparison of regional lung perfusion response on longitudinal MAA SPECT/CT in lung cancer patients treated with and without functional tissue-avoidance radiation therapy. Br J Radiol 2019;92 20190174. [DOI] [PMC free article] [PubMed] [Google Scholar]
- 103.Xiao L, Yang G, Chen J, et al. Comparison of predictive powers of functional and anatomic dosimetric parameters for radiation-induced lung toxicity in locally advanced non-small cell lung cancer. Radiother Oncol 2018;129:242–248. [DOI] [PubMed] [Google Scholar]
- 104.Wang D, Sun J, Zhu J, Li X, Zhen Y, Sui S. Functional dosimetric metrics for predicting radiation-induced lung injury in non-small cell lung cancer patients treated with chemoradiotherapy. Radiat Oncol 2012;7:69. [DOI] [PMC free article] [PubMed] [Google Scholar]
- 105.O’Reilly S, Jain V, Huang Q, et al. Dose to highly functional ventilation zones improves prediction of radiation pneumonitis for proton and photon lung cancer radiation therapy. Int J Radiat Oncol Biol Phys 2020;107:79–87. [DOI] [PubMed] [Google Scholar]
- 106.Owen DR, Sun Y, Boonstra PS, et al. Investigating the SPECT dose-function metrics associated with radiation-induced lung toxicity risk in patients with non-small cell lung cancer undergoing radiation therapy. Adv Radiat Oncol 2021;6 100666. [DOI] [PMC free article] [PubMed] [Google Scholar]
- 107.Yaremko BP, Guerrero TM, Noyola-Martinez J, et al. Reduction of normal lung irradiation in locally advanced non-small-cell lung cancer patients, using ventilation images for functional avoidance. Int J Radiat Oncol Biol Phys 2007;68:562–571. [DOI] [PMC free article] [PubMed] [Google Scholar]
- 108.McGuire SM, Zhou S, Marks LB, Dewhirst M, Yin F-F, Das SK. A methodology for using SPECT to reduce intensity-modulated radiation therapy (IMRT) dose to functioning lung. Int J Radiat Oncol Biol Phys 2006;66:1543–1552. [DOI] [PubMed] [Google Scholar]
- 109.Yamamoto T, Kabus S, von Berg J, Lorenz C, Keall PJ. Impact of four-dimensional computed tomography pulmonary ventilation imaging-based functional avoidance for lung cancer radiotherapy. Int J Radiat Oncol Biol Phys 2011;79:279–288. [DOI] [PubMed] [Google Scholar]
- 110.Shioyama Y, Jang SY, Liu HH, et al. Preserving functional lung using perfusion imaging and intensity-modulated radiation therapy for advanced-stage non–small cell lung cancer. Int J Radiat Oncol Biol Phys 2007;68:1349–1358. [DOI] [PubMed] [Google Scholar]
- 111.Siva S, Thomas R, Callahan J, et al. High-resolution pulmonary ventilation and perfusion PET/CT allows for functionally adapted intensity modulated radiotherapy in lung cancer. Radiother Oncol 2015;115:157–162. [DOI] [PubMed] [Google Scholar]
- 112.Siva S, Devereux T, Ball DL, et al. Ga-68 MAA perfusion 4D-PET/CT scanning allows for functional lung avoidance using conformal radiation therapy planning. Technol Cancer Res Treat 2016;15:114–121. [DOI] [PubMed] [Google Scholar]
- 113.Wang Z-T, Wei L-L, Ding X-P, Sun M-P, Sun H-F, Li B-S. SPECT-guidance to reduce radioactive dose to functioning lung for stage III non-small cell lung cancer. Asian Pac J Cancer Prev 2013;14:1061–1065. [DOI] [PubMed] [Google Scholar]
- 114.Mounessi FS, Eckardt J, Holstein A, Ewig S, Könemann S. Image-based lung functional radiotherapy planning for non-small cell lung cancer. Strahlenther Onkol 2020;196:151–158. [DOI] [PubMed] [Google Scholar]
- 115.Wang R, Zhang S, Yu H, et al. Optimal beam arrangement for pulmonary ventilation image-guided intensity-modulated radiotherapy for lung cancer. Radiat Oncol 2014;9:184. [DOI] [PMC free article] [PubMed] [Google Scholar]
- 116.Lucia F, Hamya M, Pinot F, et al. A feasibility study of functional lung volume preservation during stereotactic body radiotherapy guided by gallium-(68) perfusion PET/CT. Cancers (Basel) 2023;15:1726. [DOI] [PMC free article] [PubMed] [Google Scholar]
- 117.Munawar I, Yaremko BP, Craig J, et al. Intensity modulated radiotherapy of non-small-cell lung cancer incorporating SPECT ventilation imaging. Med Phys 2010;37:1863–1872. [DOI] [PubMed] [Google Scholar]
- 118.Waxweiler T, Schubert L, Diot Q, et al. A complete 4DCT-ventilation functional avoidance virtual trial: Developing strategies for prospective clinical trials. J Appl Clin Med Phys 2017;18:144–152. [DOI] [PMC free article] [PubMed] [Google Scholar]
- 119.Vinogradskiy Y, Castillo R, Castillo E, et al. Results of a multi-institutional phase 2 clinical trial for 4DCT-ventilation functional avoidance thoracic radiation therapy. Int J Radiat Oncol Biol Phys 2022;112:986–995. [DOI] [PMC free article] [PubMed] [Google Scholar]
- 120.Kadoya N, Cho SY, Kanai T, et al. Dosimetric impact of 4-dimensional computed tomography ventilation imaging-based functional treatment planning for stereotactic body radiation therapy with 3-dimensional conformal radiation therapy. Pract Radiat Oncol 2015;5:e505–e512. [DOI] [PubMed] [Google Scholar]
- 121.Farr KP, Kallehauge JF, Møller DS, et al. Inclusion of functional information from perfusion SPECT improves predictive value of dose–volume parameters in lung toxicity outcome after radiotherapy for non-small cell lung cancer: A prospective study. Radiother Oncol 2015;117:9–16. [DOI] [PubMed] [Google Scholar]
- 122.Tian Q, Zhang F, Wang Y, Qu W. Impact of different beam directions on intensity-modulated radiation therapy dose delivered to functioning lung tissue identified using single-photon emission computed tomography. Contemp Oncol (Pozn) 2014;18:436–441. [DOI] [PMC free article] [PubMed] [Google Scholar]
- 123.Wang D, Zhu J, Sun J, et al. Functional and biologic metrics for predicting radiation pneumonitis in locally advanced non-small cell lung cancer patients treated with chemoradiotherapy. Clin Transl Oncol 2012;14:943–952. [DOI] [PubMed] [Google Scholar]
- 124.Miller R, Castillo R, Castillo E, et al. Characterizing pulmonary function test changes for patients with lung cancer treated on a 2-institution, 4-dimensional computed tomography-ventilation functional avoidance prospective clinical trial. Adv Radiat Oncol 2023;8 101133. [DOI] [PMC free article] [PubMed] [Google Scholar]
- 125.Xiao L-L, Yang G, Chen J, et al. To find a better dosimetric parameter in the predicting of radiation-induced lung toxicity individually: Ventilation, perfusion or CT based. Sci Rep 2017;7:44646. [DOI] [PMC free article] [PubMed] [Google Scholar]
- 126.Thomas HMT, Hippe DS, Forouzannezhad P, et al. Radiation and immune checkpoint inhibitor-mediated pneumonitis risk stratification in patients with locally advanced non-small cell lung cancer: Role of functional lung radiomics? Discov Oncol 2022;13:85. [DOI] [PMC free article] [PubMed] [Google Scholar]
- 127.McGuire SM, Marks LB, Yin FF, Das SK. A methodology for selecting the beam arrangement to reduce the intensity-modulated radiation therapy (IMRT) dose to the SPECT-defined functioning lung. Phys Med Biol 2009;55:403–416. [DOI] [PubMed] [Google Scholar]
- 128.Kimura T, Doi Y, Nakashima T, et al. Combined ventilation and perfusion imaging correlates with the dosimetric parameters of radiation pneumonitis in radiation therapy planning for lung cancer. Int J Radiat Oncol Biol Phys 2015;93:778–787. [DOI] [PubMed] [Google Scholar]
- 129.Vinogradskiy Y, Schubert L, Diot Q, et al. Regional lung function profiles of stage I and III lung cancer patients: An evaluation for functional avoidance radiation therapy. Int J Radiat Oncol Biol Phys 2016;95:1273–1280. [DOI] [PMC free article] [PubMed] [Google Scholar]
- 130.Li B, Ren G, Guo W, et al. Function-wise dual-omics analysis for radiation pneumonitis prediction in lung cancer patients. Front Pharmacol 2022;13 971849. [DOI] [PMC free article] [PubMed] [Google Scholar]
- 131.Yin Y, Chen J-h, Li B-S, et al. Protection of lung function by introducing single photon emission computed tomography lung perfusion image into radiotherapy plan of lung cancer. Chin Med J (Engl) 2009;122:509–513. [PubMed] [Google Scholar]
- 132.Le Roux P-Y, Siva S, Steinfort DP, et al. Correlation of 68Ga ventilation–perfusion PET/CT with pulmonary function test indices for assessing lung function. J Nucl Med 2015;56:1718–1723. [DOI] [PubMed] [Google Scholar]
- 133.Yaremko BP, Capaldi DPI, Sheikh K, et al. functional lung avoidance for individualized radiation therapy: Results of a double-masked, randomized controlled trial. Int J Radiat Oncol Biol Phys 2022;113:1072–1084. [DOI] [PubMed] [Google Scholar]
- 134.Miften MM, Das SK, Su M, Marks LB. Incorporation of functional imaging data in the evaluation of dose distributions using the generalized concept of equivalent uniform dose. Phys Med Biol 2004;49:1711–1721. [DOI] [PubMed] [Google Scholar]
- 135.Hodge CW, Tomé WA, Fain SB, Bentzen SM, Mehta MP. On the use of hyperpolarized helium MRI for conformal avoidance lung radiotherapy. Med Dosim 2010;35:297–303. [DOI] [PMC free article] [PubMed] [Google Scholar]
- 136.Huang Y-S, Chen JL-Y, Lan H-T, et al. Xenon-enhanced ventilation computed tomography for functional lung avoidance radiation therapy in patients with lung cancer. Int J Radiat Oncol Biol Phys 2023;115:356–365. [DOI] [PubMed] [Google Scholar]
- 137.Agrawal S, Raj MK, Kheruka SC, Das KM, Gambhir S. Utility of single photon emission computed tomography perfusion scans in radiation treatment planning of locally advanced lung cancers. Indian J Nucl Med 2012;27:10–15. [DOI] [PMC free article] [PubMed] [Google Scholar]
- 138.Ireland RH, Din OS, Swinscoe JA, et al. Detection of radiation-induced lung injury in non-small cell lung cancer patients using hyperpolarized helium-3 magnetic resonance imaging. Radiother Oncol 2010;97:244–248. [DOI] [PubMed] [Google Scholar]
- 139.Ireland RH, Bragg CM, McJury M, et al. Feasibility of image registration and intensity-modulated radiotherapy planning with hyperpolarized helium-3 magnetic resonance imaging for non-small-cell lung cancer. Int J Radiat Oncol Biol Phys 2007;68:273–281. [DOI] [PMC free article] [PubMed] [Google Scholar]
- 140.Huang P, Yan H, Hu Z, Liu Z, Tian Y, Dai J. Predicting radiation pneumonitis with fuzzy clustering neural network using 4DCT ventilation image based dosimetric parameters. Quant Imaging Med Surg 2021;11:4731–4741. [DOI] [PMC free article] [PubMed] [Google Scholar]
- 141.Kocak Z, Borst GR, Zeng J, et al. Prospective assessment of dosimetric/physiologic-based models for predicting radiation pneumonitis. Int J Radiat Oncol Biol Phys 2007;67:178–186. [DOI] [PMC free article] [PubMed] [Google Scholar]
- 142.Lind PA, Marks LB, Hollis D, et al. Receiver operating characteristic curves to assess predictors of radiation-induced symptomatic lung injury. Int J Radiat Oncol Biol Phys 2002;54:340–347. [DOI] [PubMed] [Google Scholar]
- 143.Bin L, Yuan T, Zhaohui S, et al. A deep learning-based dual-omics prediction model for radiation pneumonitis. Med Phys 2021;48:6247–6256. [DOI] [PubMed] [Google Scholar]
- 144.Hoover DA, Reid RH, Wong E, et al. SPECT-based functional lung imaging for the prediction of radiation pneumonitis: A clinical and dosimetric correlation. J Med Imaging Radiat Oncol 2013;58:214–222. [DOI] [PubMed] [Google Scholar]
- 145.Yamamoto T, Kabus S, Bal M, Keall P, Benedict S, Daly M. The first patient treatment of computed tomography ventilation functional image-guided radiotherapy for lung cancer. Radiother Oncol 2016;118:227–231. [DOI] [PubMed] [Google Scholar]
- 146.Matuszak MM, Matrosic C, Jarema D, et al. Priority-driven plan optimization in locally advanced lung patients based on perfusion SPECT imaging. Adv Radiat Oncol 2016;1:281–289. [DOI] [PMC free article] [PubMed] [Google Scholar]
- 147.Vinogradskiy Y, Castillo R, Castillo E, et al. Use of 4-dimensional computed tomography-based ventilation imaging to correlate lung dose and function with clinical outcomes. Int J Radiat Oncol Biol Phys 2013;86:366–371. [DOI] [PMC free article] [PubMed] [Google Scholar]
- 148.Yamamoto T, Kabus S, Bal M, et al. Changes in regional ventilation during treatment and dosimetric advantages of CT ventilation image guided radiation therapy for locally advanced lung cancer. Int J Radiat Oncol Biol Phys 2018;102:1366–1373. [DOI] [PMC free article] [PubMed] [Google Scholar]
- 149.Seppenwoolde Y, Engelsman M, De Jaeger K, et al. Optimizing radiation treatment plans for lung cancer using lung perfusion information. Radiother Oncol 2002;63:165–177. [DOI] [PubMed] [Google Scholar]
- 150.St-Hilaire J, Lavoie C, Dagnault A, et al. Functional avoidance of lung in plan optimization with an aperture-based inverse planning system. Radiother Oncol 2011;100:390–395. [DOI] [PubMed] [Google Scholar]
- 151.Doi Y, Kimura T, Nakashima T, et al. Functional image guided radiation therapy planning in volumetric modulated arc therapy for patients with malignant pleural mesothelioma. Adv Radiat Oncol 2017;2:183–191. [DOI] [PMC free article] [PubMed] [Google Scholar]
- 152.Farr KP, Kramer S, Khalil AA, Morsing A, Grau C. Role of perfusion SPECT in prediction and measurement of pulmonary complications after radiotherapy for lung cancer. Eur J Nucl Med Mol Imaging 2015;42:1315–1324. [DOI] [PubMed] [Google Scholar]
- 153.Woel RT, Munley MT, Hollis D, et al. The time course of radiation therapy-induced reductions in regional perfusion: A prospective study with >5 years of follow-up. Int J Radiat Oncol Biol Phys 2002;52:58–67. [DOI] [PubMed] [Google Scholar]
- 154.Farr KP, Khalil AA, Møller DS, et al. Time and dose-related changes in lung perfusion after definitive radiotherapy for NSCLC. Radiother Oncol 2018;126:307–311. [DOI] [PubMed] [Google Scholar]
- 155.Levinson B, Marks LB, Munley MT, et al. Regional dose response to pulmonary irradiation using a manual method. Radiother Oncol 1998;48:53–60. [DOI] [PubMed] [Google Scholar]
- 156.Seppenwoolde Y, Muller SH, Theuws JCM, et al. Radiation dose-effect relations and local recovery in perfusion for patients with non–small-cell lung cancer. Int J Radiat Oncol Biol Phys 2000;47:681–690. [DOI] [PubMed] [Google Scholar]
- 157.Zhang J, Ma J, Zhou S, et al. Radiation-induced reductions in regional lung perfusion: 0.1–12 Year data from a prospective clinical study. Int J Radiat Oncol Biol Phys 2010;76:425–432. [DOI] [PubMed] [Google Scholar]
- 158.Abratt RP, Willcox PA. Changes in lung function and perfusion after irradiation in patients with lung cancer. Lung Cancer 1994;11:61–69. [DOI] [PubMed] [Google Scholar]
- 159.Abratt RP, Willcox PA. The effect of irradiation on lung function and perfusion in patients with lung cancer. Int J Radiat Oncol Biol Phys 1995;31:915–919. [DOI] [PubMed] [Google Scholar]
- 160.Marks LB, Munley MT, Spencer DP, et al. Quantification of radiation-induced regional lung injury with perfusion imaging. Int J Radiat Oncol Biol Phys 1997;38:399–409. [DOI] [PubMed] [Google Scholar]
- 161.Marks LB, Spencer DP, Sherouse GW, et al. The role of three dimensional functional lung imaging in radiation treatment planning: The functional dose-volume histogram. Int J Radiat Oncol Biol Phys 1995;33:65–75. [DOI] [PubMed] [Google Scholar]
- 162.Marks LB, Spencer DP, Bentel GC, et al. The utility of SPECT lung perfusion scans in minimizing and assessing the physiologic consequences of thoracic irradiation. Int J Radiat Oncol Biol Phys 1993;26:659–668. [DOI] [PubMed] [Google Scholar]
- 163.Owen DR, Boonstra PS, Viglianti BL, et al. Modeling patient-specific dose-function response for enhanced characterization of personalized functional damage. Int J Radiat Oncol Biol Phys 2018;102:1265–1275. [DOI] [PMC free article] [PubMed] [Google Scholar]
- 164.Siva S, Hardcastle N, Kron T, et al. Ventilation/perfusion positron emission tomography—based assessment of radiation injury to lung. Int J Radiat Oncol Biol Phys 2015;93:408–417. [DOI] [PubMed] [Google Scholar]
- 165.King MT, Maxim PG, Diehn M, Loo BW, Xing L. Analysis of long-term 4-dimensional computed tomography regional ventilation after radiation therapy. Int J Radiat Oncol Biol Phys 2015;92:683–690. [DOI] [PubMed] [Google Scholar]
- 166.Fan M, Marks LB, Lind P, et al. Relating radiation-induced regional lung injury to changes in pulmonary function tests. Int J Radiat Oncol Biol Phys 2001;51:311–317. [DOI] [PubMed] [Google Scholar]
- 167.Mathew L, Gaede S, Wheatley A, Etemad-Rezai R, Rodrigues GB, Parraga G. Detection of longitudinal lung structural and functional changes after diagnosis of radiation-induced lung injury using hyper-polarized magnetic resonance imaging. Med Phys 2009;37:22–31. [DOI] [PubMed] [Google Scholar]
- 168.Sharifi H, Brown S, McDonald GC, Chetty IJ, Zhong H. 4-Dimensional computed tomography-based ventilation and compliance images for quantification of radiation-induced changes in pulmonary function. J Med Imaging Radiat Oncol 2019;63:370–377. [DOI] [PubMed] [Google Scholar]
- 169.Yuan ST, Frey KA, Gross MD, et al. Changes in global function and regional ventilation and perfusion on SPECT during the course of radiotherapy in patients with non-small-cell lung cancer. Int J Radiat Oncol Biol Phys 2012;82:e631–e638. [DOI] [PMC free article] [PubMed] [Google Scholar]
- 170.De Jaeger K, Seppenwoolde Y, Boersma LJ, et al. Pulmonary function following high-dose radiotherapy of non–small-cell lung cancer. Int J Radiat Oncol Biol Phys 2003;55:1331–1340. [DOI] [PubMed] [Google Scholar]
- 171.Ma J, Zhang J, Zhou S, et al. Association between RT-induced changes in lung tissue density and global lung function. Int J Radiat Oncol Biol Phys 2009;74:781–789. [DOI] [PMC free article] [PubMed] [Google Scholar]
- 172.Marks LB, Hollis D, Munley M, et al. The role of lung perfusion imaging in predicting the direction of radiation-induced changes in pulmonary function tests. Cancer 2000;88:2135–2141. [PubMed] [Google Scholar]
- 173.Abratt RP, Willcox PA, Smith JA. Lung cancer in patients with borderline lung functions - zonal lung perfusion scans at presentation and lung function after high dose irradiation. Radiother Oncol 1990;19:317–322. [DOI] [PubMed] [Google Scholar]
- 174.Gayed IW, Chang J, Kim EE, et al. Lung perfusion imaging can risk stratify lung cancer patients for the development of pulmonary complications after chemoradiation. J Thorac Oncol 2008;3:858–864. [DOI] [PMC free article] [PubMed] [Google Scholar]
- 175.Binkley MS, King MT, Shrager JB, et al. Pulmonary function after lung tumor stereotactic ablative radiotherapy depends on regional ventilation within irradiated lung. Radiother Oncol 2017;123:270–275. [DOI] [PubMed] [Google Scholar]
- 176.Dong Y, Kumar H, Tawhai M, et al. In silico ventilation within the dose-volume is predictive of lung function post-radiation therapy in patients with lung cancer. Ann Biomed Eng 2021;49:1416–1431. [DOI] [PMC free article] [PubMed] [Google Scholar]
- 177.Fan M, Marks LB, Hollis D, et al. Can we predict radiation-induced changes in pulmonary function based on the sum of predicted regional dysfunction? J Clin Oncol 2001;19:543–550. [DOI] [PubMed] [Google Scholar]
- 178.Bates EL, Bragg CM, Wild JM, Hatton MQF, Ireland RH. Functional image-based radiotherapy planning for non-small cell lung cancer: A simulation study. Radiother Oncol 2009;93:32–36. [DOI] [PMC free article] [PubMed] [Google Scholar]
- 179.Rodney Withers H, Taylor JMG, Maciejewski B. Treatment volume and tissue tolerance. Int J Radiat Oncol Biol Phys 1988;14:751–759. [DOI] [PubMed] [Google Scholar]
- 180.Yorke ED, Jackson A, Rosenzweig KE, et al. Dose-volume factors contributing to the incidence of radiation pneumonitis in non-small-cell lung cancer patients treated with three-dimensional conformal radiation therapy. Int J Radiat Oncol Biol Phys 2002;54:329–339. [DOI] [PubMed] [Google Scholar]
- 181.Seppenwoolde Y, Lebesque JV, de Jaeger K, et al. Comparing different NTCP models that predict the incidence of radiation pneumonitis. Int J Radiat Oncol Biol Phys 2003;55:724–735. [DOI] [PubMed] [Google Scholar]
- 182.Marks LB, Munley MT, Bentel GC, et al. Physical and biological predictors of changes in whole-lung function following thoracic irradiation. Int J Radiat Oncol Biol Phys 1997;39:563–570. [DOI] [PubMed] [Google Scholar]
- 183.Moola S, Munn Z, Tufanaru C, et al. Systematic reviews of etiology and risk. [Google Scholar]
- 184.Munn Z, Barker TH, Moola S, et al. Methodological quality of case series studies. JBI Evid Synth 2020;18:2127–2133. [DOI] [PubMed] [Google Scholar]
- 185.Tufanaru C, Munn Z, Aromataris E, Campbell J and Hopp L, Systematic reviews of effectiveness, In: Aromataris E and Munn Z, JBI Manual for Evidence Synthesis, 2020; 72–88, JBI. [Google Scholar]
- 186.Palma DA, Senan S, Tsujino K, et al. Predicting radiation pneumonitis after chemoradiation therapy for lung cancer: An international individual patient data meta-analysis. Int J Radiat Oncol Biol Phys 2013;85:444–450. [DOI] [PMC free article] [PubMed] [Google Scholar]
- 187.Aiad M, Fresco K, Prenatt Z, et al. Comparison of pneumonitis rates and severity in patients with lung cancer treated by immunotherapy, radiotherapy, and immunoradiotherapy. Cureus 2022;14:e25665. [DOI] [PMC free article] [PubMed] [Google Scholar]
- 188.Chen X, Zhang Z, Hou X, et al. Immune-related pneumonitis associated with immune checkpoint inhibitors in lung cancer: A network meta-analysis. J Immunother Cancer 2020;8 e001170. [DOI] [PMC free article] [PubMed] [Google Scholar]
- 189.Feigenberg S. Functional lung avoidance radiationtherapy using hyperpolarized xenon-129 MRI. ClinicalTrials.gov identifier: NCT05302817. https://clinicaltrials.gov/study/NCT05302817. Updated July 7, 2023. Accessed September 10, 2023.
- 190.Huang Y-S. Xenon-enhanced ventilation CT-guided radiotherapy for lung cancer treatment. ClinicalTrials.gov identifier: NCT05134558. https://clinicaltrials.gov/study/NCT05134558. Updated November 26, 2021. Accessed September 10, 2023.
- 191.Zeng J. FLARE RT for patients with stage IIB-IIIB non-small cell lung cancer: Personalizing radiation therapy using PET/CT and SPECT/CT imaging. ClinicalTrials.gov identifier: NCT02773238. https://clinicaltrials.gov/study/NCT02773238. Updated June 6, 2023. Accessed September 10, 2023.
- 192.Jolly S. A pilot study of response-driven adaptive radiation therapy for patients with locally advanced non-small cell lung cancer. ClinicalTrials.gov identifier: NCT02492867. https://clinicaltrials.gov/study/NCT02492867. Updated August 21, 2023. Accessed September 10, 2023.
Associated Data
This section collects any data citations, data availability statements, or supplementary materials included in this article.
Supplementary Materials
Data Availability Statement
All data used are from published projects and are available publicly or upon request.