

Abstract
Since its introduction in 1980, fatty liver disease (now termed metabolic dysfunction–associated steatotic liver disease [MASLD]) has grown in prevalence significantly, paralleling the rise of obesity worldwide. While MASLD has been the subject of extensive research leading to significant progress in the understanding of its pathophysiology and progression factors, several gaps in knowledge remain. In this pictorial review, the authors present the latest insights into MASLD, covering its recent nomenclature change, spectrum of disease, epidemiology, morbidity, and mortality. The authors also discuss current qualitative and quantitative imaging methods for assessing and monitoring MASLD. Last, they propose six unsolved challenges in MASLD assessment, which they term the proliferation, reproducibility, reporting, needle-in-the-haystack, availability, and knowledge problems. These challenges offer opportunities for the radiology community to proactively contribute to their resolution. The authors conclude with a call to action for the entire radiology community to claim a seat at the table, collaborate with other societies, and commit to advancing the development, validation, dissemination, and accessibility of the imaging technologies required to combat the looming health care crisis of MASLD.
© RSNA, 2024
See the invited commentary by Venkatesh in this issue.

Introduction
In 1980, researchers at Mayo Clinic (Fig 1) in Rochester, Minnesota, described a liver condition manifesting clinically with hepatomegaly and mildly abnormal liver enzymes in individuals without alcohol use disorder but with histologic features similar to thosAe of alcoholic hepatitis and that could progress to cirrhosis (1). Noting its association with obesity and obesity-related conditions such as type 2 diabetes mellitus, the Mayo investigators proposed the name nonalcoholic fatty liver disease (NAFLD), which gained widespread adoption. Since the initial description, extensive research has delved into various aspects of NAFLD, with an exponential increase in related publications (Fig 1), enhancing our understanding of its pathophysiology and prognosis, as well as advancing modalities for diagnosis and monitoring. In parallel with the global rise in obesity, the disease has grown in prevalence, creating an emerging crisis for health care systems.
Figure 1.
![History of MASLD literature. Graph shows the number of NAFLD (MASLD) publications per year from 1980 to 2023. Those highlighted are the first publication to describe NAFLD in 1980 (four authors from one institution) and the consensus paper in 2023 announcing the new MASLD nomenclature (236 contributors from 56 countries and representing seven scientific societies). (Embedded maps created with and adapted and reprinted under a CC BY-SA 4.0 license from MapChart [https://www.mapchart.net/].)](https://www.ncbi.nlm.nih.gov/core/lw/2.0/html/tileshop_pmc/tileshop_pmc_inline.html?title=Click%20on%20image%20to%20zoom&p=PMC3&id=11580021_rg.240048.fig1.jpg)
History of MASLD literature. Graph shows the number of NAFLD (MASLD) publications per year from 1980 to 2023. Those highlighted are the first publication to describe NAFLD in 1980 (four authors from one institution) and the consensus paper in 2023 announcing the new MASLD nomenclature (236 contributors from 56 countries and representing seven scientific societies). (Embedded maps created with and adapted and reprinted under a CC BY-SA 4.0 license from MapChart [https://www.mapchart.net/].)
In this pictorial review, the historical evolution of disease nomenclature is discussed and the disease spectrum, epidemiology, morbidity, and mortality are explored. Then, the current status of noninvasive tests, with an emphasis on imaging technologies for disease diagnosis and remaining challenges, is reviewed. The conclusion proposes a call to action for the house of radiology to come together, seize initiative, and address these gaps to forestall this looming health care crisis.
Nomenclature
Improved insights into disease pathophysiology and acknowledgment that NAFLD may occur concurrently with other liver diseases have incited persistent dissatisfaction with its nomenclature. In particular, the adjective nonalcoholic has been criticized for emphasizing what the disease is not rather than what it is, while the adjective fatty was thought by some to be disparaging. In 2020, a group of 22 experts proposed the replacement term metabolic dysfunction–associated fatty liver disease (MAFLD) to reflect the importance of metabolic abnormalities in disease pathogenesis (2) and to provide noninvasive criteria for its diagnosis. However, the name MAFLD was not adopted because it retained the stigmatizing term fatty and its criteria were overly inclusive.
In 2023, seven leading medical societies convened a collaborative initiative to overhaul the existing nomenclature, with input from academia, industry, regulatory agencies, and patient advocacy organizations spanning 56 countries (Fig 1). The new umbrella term steatotic liver disease (SLD) was developed with subcategories reflecting different causes for fat deposition in the liver, including the term metabolic dysfunction–associated steatotic liver disease (MASLD) as a substitute for the term NAFLD (3) (Fig 2). Importantly, the diagnosis for MASLD now requires the presence of at least one of five cardiometabolic risk factors (Fig 3), which was not required for NAFLD diagnosis (3). The new nomenclature also addresses alcohol-associated liver disease (ALD) and MASLD associated with increased alcohol intake (MetALD) (3). While MASLD may coexist with other liver diseases such as viral hepatitis, this article focuses on MASLD in the absence of other steatogenic conditions.
Figure 2.

SLD nomenclature. Steatotic liver disease is an umbrella term that encompasses various disorders associated with excess fat accumulation in the liver, including MASLD and MASLD with increased alcohol intake (MetALD). Although MASLD can coexist with other causes of SLD such as viral hepatitis, this article focuses on MASLD in the absence of other steatogenic conditions. (Reprinted under a CC BY-NC-ND license from reference 3.)
Figure 3.

MASLD cardiometabolic diagnostic criteria. ALD = alcohol-associated/related liver disease, BMI = body mass index, BP = blood pressure, CMRF = cardiometabolic risk factors, DILI = drug-induced liver disease, F = female, HbA1c = hemoglobin A1c, HDL = high-density lipoprotein, M = male, WC = waist circumference. (Reprinted under a CC BY-NC-ND license from reference 3.)
Disease Spectrum
MASLD represents a spectrum of histologic and clinical abnormalities. The mildest, earliest, and most common form of the disease is metabolic dysfunction–associated steatotic liver (MASL, formerly known as nonalcoholic fatty liver [NAFL]), which is characterized by steatosis (accumulation of lipid droplets within hepatocytes) without other histologic abnormalities (Fig 4). Steatosis and a complex interplay of other factors may incite hepatic inflammation, which in turn lead to hepatocyte injury (4).
Figure 4.
![MASLD spectrum. Conventional histologic images show steatosis with fat droplets within hepatocytes (*), steatohepatitis with ballooned hepatocytes (B), early-stage fibrotic liver with pericellular fibrosis (black arrow), and cirrhotic liver with fibrotic scars (yellow arrow) surrounding a regenerative nodule (N). MASL refers to steatosis without inflammation or cell injury. MASH refers to steatosis with inflammation and cell injury. Fibrosis refers to excess collagen deposition in the extracellular matrix and is a marker of cumulative liver damage. Cirrhosis is a late stage of disease in which fibrotic scars have carved the liver into regenerative nodules. At-risk MASH is defined by the combination of MASH, an NAFLD activity score of 4 or greater, and a fibrosis score of 2 or greater. NAFLD activity score is the sum of the steatosis grade (0–3), lobular inflammation grade (0–3), and ballooning score (0–2). (Hematoxylin-eosin stain [two left images] and trichrome stain [two right images].)](https://www.ncbi.nlm.nih.gov/core/lw/2.0/html/tileshop_pmc/tileshop_pmc_inline.html?title=Click%20on%20image%20to%20zoom&p=PMC3&id=11580021_rg.240048.fig4.jpg)
MASLD spectrum. Conventional histologic images show steatosis with fat droplets within hepatocytes (*), steatohepatitis with ballooned hepatocytes (B), early-stage fibrotic liver with pericellular fibrosis (black arrow), and cirrhotic liver with fibrotic scars (yellow arrow) surrounding a regenerative nodule (N). MASL refers to steatosis without inflammation or cell injury. MASH refers to steatosis with inflammation and cell injury. Fibrosis refers to excess collagen deposition in the extracellular matrix and is a marker of cumulative liver damage. Cirrhosis is a late stage of disease in which fibrotic scars have carved the liver into regenerative nodules. At-risk MASH is defined by the combination of MASH, an NAFLD activity score of 4 or greater, and a fibrosis score of 2 or greater. NAFLD activity score is the sum of the steatosis grade (0–3), lobular inflammation grade (0–3), and ballooning score (0–2). (Hematoxylin-eosin stain [two left images] and trichrome stain [two right images].)
The combination of steatosis, inflammation, and cellular injury is known as metabolic dysfunction–associated steatohepatitis (MASH, formerly known as nonalcoholic steatohepatitis [NASH]). MASH is a more advanced form of disease and is probably a necessary step for progression to fibrosis. However, it is important to note that MASH is potentially reversible. Episodes of hepatic inflammation and cell injury may develop and subside, possibly reflecting risk factor and lifestyle fluctuations (5) (Fig 4). However, if inflammation and cell injury during the MASH state heal with scar formation (fibrosis), reversibility becomes less likely and the disease may continue to progress, manifesting with greater and greater fibrosis (4).
A marker of cumulative liver damage, fibrosis is staged using several scoring systems, most commonly from 0 to 4, corresponding to none, perisinusoidal/pericellular or periportal fibrosis, perisinusoidal/pericellular and periportal/portal fibrosis, bridging fibrosis, and cirrhosis, respectively (6). To assist in clinical management, fibrosis staging is often simplified as significant fibrosis (stage 2 or greater) or advanced fibrosis (stage 3 or greater). To assist with research and clinical trials, a disease activity score (known as the NAFLD activity score) was developed, which is the sum of steatosis grade, lobular inflammation score, and ballooning score (6). Patients with MASH, an NAFLD activity score of 4 or greater, and significant fibrosis are labeled as having at-risk MASH (Fig 4), as this conveys a higher risk of adverse liver-related outcomes (7). Among patients with MASLD, it is thought that at any given time about 70% of patients have MASL, 20% of patients have MASH, and 10% of patients have at-risk MASH (8) (Fig 5). As fibrosis progresses beyond stage 3, liver fat content may decline. In end-stage disease, the steatosis may have resolved completely (9).
Figure 5.

Prevalence of MASLD, MASH, and at-risk MASH. Diagram shows the prevalence of the MASLD spectrum in the general population (left) and in patients with MASLD (right).
Epidemiology
The prevalence of MASLD is about 30% of the general population—a staggering 1.6 billion individuals worldwide (10). There is geographic variability, with Latin America having the highest MASLD prevalence, followed by the Middle East and South Asia (Fig 6). Alarmingly, the incidence of MASLD is increasing in nearly all countries (11) (Fig 7).
Figure 6.
![MASLD prevalence worldwide. South and Central America has the highest prevalence of MASLD (44%) and western Europe has the lowest (25%) (10). (Map created with and adapted and reprinted under a CC BY-SA 4.0 license from MapChart [https://www.mapchart.net/].)](https://www.ncbi.nlm.nih.gov/core/lw/2.0/html/tileshop_pmc/tileshop_pmc_inline.html?title=Click%20on%20image%20to%20zoom&p=PMC3&id=11580021_rg.240048.fig6.jpg)
MASLD prevalence worldwide. South and Central America has the highest prevalence of MASLD (44%) and western Europe has the lowest (25%) (10). (Map created with and adapted and reprinted under a CC BY-SA 4.0 license from MapChart [https://www.mapchart.net/].)
Figure 7.
![MASLD estimated annual percentage change worldwide. The four areas with the highest rate of increase are Oman (2.1%), Finland (1.7%), Equatorial Guinea (1.7%), and Nicaragua (1.6%). There are no areas in which the prevalence is decreasing. (Adapted and reprinted under a CC BY-NC 4.0 license from reference 11. Map created with and adapted and reprinted under a CC BY-SA 4.0 license from MapChart [https://www.mapchart.net/].)](https://www.ncbi.nlm.nih.gov/core/lw/2.0/html/tileshop_pmc/tileshop_pmc_inline.html?title=Click%20on%20image%20to%20zoom&p=PMC3&id=11580021_rg.240048.fig7.jpg)
MASLD estimated annual percentage change worldwide. The four areas with the highest rate of increase are Oman (2.1%), Finland (1.7%), Equatorial Guinea (1.7%), and Nicaragua (1.6%). There are no areas in which the prevalence is decreasing. (Adapted and reprinted under a CC BY-NC 4.0 license from reference 11. Map created with and adapted and reprinted under a CC BY-SA 4.0 license from MapChart [https://www.mapchart.net/].)
The incidence, prevalence, and severity of MASLD have been linked to racial, ethnic, and socioeconomic factors (12,13) (Fig 8). In the United States, MASLD prevalence is highest in the Hispanic and/or Latino population (23%), while the Black and/or African American population seems to be protected with the lowest prevalence (13%) (14) (see also the section “Knowledge Problem”), although the underlying reasons behind these differences are currently unknown. While there is racial and ethnic variability in genetic risk factors for MASLD (15), health disparities in MASLD are also multifactorial and encompass modifiable risk factors more common in underserved populations, such as socioeconomic deprivation, obesity, food insecurity, and disparate access to health care (13). Despite the high prevalence of MASLD, up to 94% of affected individuals, of all races and ethnicities, remain unaware of their condition due to its predominantly asymptomatic nature (16).
Figure 8.

Liver and systemic MASLD outcomes. Patients with at-risk MASH have the highest likelihood of developing liver-related outcomes (left), while all patients with MASLD have an increased likelihood for developing systemic outcomes (right).
MASLD is an important cause of chronic liver disease not only in adults but in children as well, with a prevalence of ~10% in pediatric populations (17). Furthermore, MASLD can affect children of almost all ages, with biopsy-proven steatohepatitis documented as early as 2 years of age (17). The impact of MASLD on children is particularly serious. The onset early in life may reflect unusual biologic or environmental susceptibility and exposes affected children to substantial risk of developing serious complications in young adulthood, which may lead to premature death (18).
Morbidity and Mortality
MASLD is linked to increased morbidity and mortality, which can be categorized into hepatic and extrahepatic causes. Liver-related events include liver failure, complications of portal hypertension, and development of hepatocellular carcinoma (HCC) and other primary liver cancers. Hepatic fibrosis is the single most important prognostic factor for hepatic-related morbidity and mortality, with the risk rising with each increase in stage of fibrosis (7) (Fig 9). The risk for liver-related events is negligible in patients with stage 1 fibrosis or less but becomes meaningful in patients with stage 2 fibrosis or greater, especially those with ongoing inflammation and cellular injury to drive further disease progression (ie, at-risk MASH) (Fig 8, left). The U.S. Food and Drug Administration (FDA) therefore has accepted at-risk MASH as an inclusion criterion in phase 3 clinical trials for MASLD (19).
Figure 9.

Survival is worse with development of hepatic fibrosis. Graph demonstrates all-cause (total) and liver-related (brown) mortality rates by hepatic fibrosis stage (7). As fibrosis stage increases, both liver and nonliver-related mortality rates increase. Note that nonliver-related mortality exceeds liver-related mortality at every stage until stage 4 (cirrhosis), when nonliver and liver-related mortality rates are about the same. PYF = patient years of follow-up.
The extrahepatic causes of morbidity and mortality are due in part to the association of MASLD with metabolic syndrome, which is a cluster of cardiometabolic risk factors, characterized by abdominal obesity, insulin resistance, hypertension, and dyslipidemia (20). MASLD is the hepatic component of metabolic syndrome and has complex bidirectional associations with other entities within this syndrome (Fig 10) (21). Patients with MASLD experience the comorbidities of metabolic syndrome more severely, at an earlier age, and with faster progression (22). These comorbidities include type 2 diabetes mellitus, cardiovascular disease, cerebrovascular disease, chronic kidney disease, sleep apnea, osteoporosis, and endocrine disorders such as hypothyroidism and polycystic ovary syndrome (23) (Fig 8, right). Beyond complications tied to metabolic syndrome, MASLD is also associated with an increased risk of extrahepatic cancers, particularly those from the gastrointestinal tract and breast (24) (Fig 8, right). It is important to understand that all patients with MASLD are at substantial risk for adverse cardiometabolic outcomes, and even those with at-risk MASH who have progressed to cirrhosis are more likely to die of cardiovascular disease than of liver-related events (25).
Figure 10.

MASLD is an integral component of metabolic syndrome, as shown on the diagram. Note the complex bidirectional relationships between all components of metabolic syndrome, including MASLD.
Assessment of SLD with Conventional Imaging
SLD is frequently discovered incidentally at radiologic examinations that include images of the liver, such as conventional US, CT with or without contrast material, and conventional MRI. In the following sections, the imaging criteria and pitfalls for the assessment of SLD using conventional imaging are briefly described. Here, the focus is on SLD rather than MASLD because the underlying cause is likely to be unknown by the radiologist who discovers SLD incidentally.
Conventional US
Fat droplets within hepatocytes are thought to scatter the ultrasound beam, resulting in a hyperechoic appearance of the liver. This hyperechoic liver appearance in conventional US, sometimes called a “bright liver,” suggests the diagnosis of SLD (Fig 11). However, this finding by itself has limited specificity as fibrosis can also manifest as a hyperechoic liver (26). In addition to scattering, fat droplets attenuate the ultrasound beam, resulting in other sonographic features such as blurring of hepatic vessels, signal loss in the far field, and—in cases of high fat content—incomplete visualization of the diaphragm. Assessing these other features can enhance specificity (27). The primary limitations of conventional US in diagnosing SLD are the subjective interpretation of imaging features, the inability to grade the degree of steatosis reliably (Fig 11), and operator and machine dependency.
Figure 11.

Chart shows conventional US images for SLD in four different pediatric patients (each column shows images in one patient), each with three B-mode US views. The corresponding PDFF percentage value for each patient’s liver is noted in the last row. In all three cases with steatosis, the liver is brighter than the kidney and there is blurring of the vessels. While qualitative assessment of B-mode US images can help identify patients with steatosis, it cannot discriminate the severity of steatosis. Bunny = bunny waveform.
Computed Tomography
Fat has lower intrinsic attenuation than do solid organs such as the liver. Hence, steatosis causes the liver to appear with less attenuation than normal. If the steatosis is severe, the unenhanced blood vessels exhibit higher attenuation than that of the hepatic parenchyma, resembling a contrast-enhanced appearance (28) (Fig 12). With noncontrast CT, two commonly used criteria for diagnosis of SLD are liver attenuation (a) lower than 40 HU or (b) lower than spleen attenuation (29,30). However, liver attenuation can be affected by factors such as iron deposition, which reduces sensitivity for SLD detection (31). Additionally, the second criterion requires a normal spleen for comparison, which may not be present in all patients.
Figure 12.
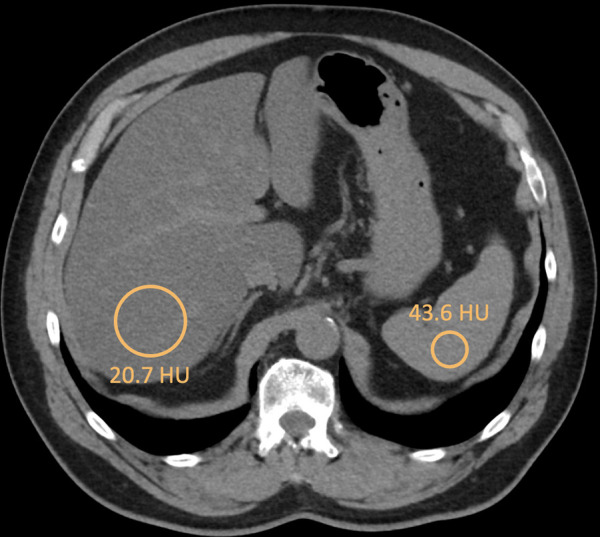
SLD by noncontrast CT in a 66-year-old man. Axial noncontrast CT image shows the liver with attenuation of 20.7 HU and the spleen with attenuation of 43.6 HU. Note that the vessels appear to have more attenuation than the liver due to elevated fat deposition within the liver tissue. In extreme cases, the vessels may appear so bright compared with the liver that it can resemble a contrast-enhanced image.
Contrast material administration causes variable enhancement of the liver and spleen due to differences in their blood supply (the liver receives dual blood supply while the spleen has only arterial blood supply), complicating the diagnosis of SLD using CT (32). While some investigators have proposed thresholds for liver-spleen attenuation difference for diagnosing SLD using CT after contrast material administration, this approach has low sensitivity (32) and should be applied with caution.
Conventional MRI
Fat and water protons precess in different frequencies, causing cancellation of fat and water signals on out-of-phase compared with in-phase MR images. With MRI, the diagnosis of SLD can be made if the liver is hypointense on out-of-phase images compared with in-phase images (30,33) (Fig 13). While this method is more accurate than the other conventional imaging methods, it has pitfalls. Most importantly, it can be confounded by the presence of iron, which shortens T2* decay and causes signal loss, usually in-phase echo time. Another pitfall is that in- and out-of-phase images are usually filtered to homogenize their signal intensity. Depending on the type of filter and acquisition settings, a different filter might be applied to each echo time. This can cause spurious signal loss in the liver on out-of-phase images, even in the absence of steatosis, leading to a false-positive diagnosis of SLD. Finally, a standardized cutoff for signal loss on out-of-phase compared with in-phase images has not been established, which introduces reader variability when signal loss on out-of-phase images is subtle.
Figure 13.

SLD by conventional MRI in a 59-year-old woman. Axial out-of-phase MR image (left) shows that the liver is hypointense compared with the liver on the in-phase MR image (right). Note that fat deposition is heterogeneous throughout the liver.
Radiologists should understand that none of the conventional imaging methods (US, CT, or MRI) provide reliable quantitative estimates of liver fat content (34). Hence, they are more useful for detection of SLD than for longitudinal monitoring. Conventional imaging also cannot reliably diagnose early-stage fibrosis, MASH, or at-risk MASH. However, it can suggest the diagnosis of advanced chronic liver disease and cirrhosis when structural abnormalities of the liver (eg, surface nodularity, redistribution of liver volume with areas of relative hypertrophy and atrophy) or signs of portal hypertension (eg, ascites, splenomegaly, varices) are present (35). In patients with advanced-stage disease, conventional imaging can also sometimes aid in the distinction between MASLD and ALD and MetALD; in particular, the presence of confluent fibrosis or right posterior hepatic notching favors ALD and MetALD (36).
Diagnosis and Quantitative Assessment of MASLD
Although biopsy remains the best means of integrating and assessing the individual components of MASLD, disease activity, and extent, there are limitations to the use of biopsy in some settings. Biopsy has associated risks to the patient and requires meticulous technical processing for optimal interpretation and value (37). To address the inherent limitations of histology, quantitative blood and imaging noninvasive tests have been developed as screening, adjunct, or replacement methods. The leading laboratory and quantitative imaging-based tests that are being used for clinical care are briefly discussed in the following sections, with a focus mainly on US and MRI as imaging modalities. A full discussion is beyond the scope of this article but can be found elsewhere (38).
Blood Tests
Various blood tests have been explored for diagnosis across the MASLD spectrum (39,40), including MASL, MASH, at-risk MASH, and fibrosis (Table 1). These include commonly tested aminotransferase levels for the initial workup of the disease to composite biomarker panels. The Fibrosis-4 (FIB-4) Index is perhaps the most widely used for detection of at-risk MASH and has been incorporated in the latest practice guideline by the American Association for the Study of Liver Disease (AASLD) for the clinical assessment and management of MASLD (41). Calculated from age, aspartate aminotransferase level, alanine aminotransferase level, and platelet count, the FIB-4 score stratifies patients with MASLD into low-, intermediate-, or high-likelihood categories for at-risk MASH (Fig 14) and informs management decisions. Patients with high likelihood for at-risk MASH (ie, FIB-4 >2.67) need additional workup and referral to a hepatologist. Patients with low likelihood (ie, FIB-4 <1.3) need regular reassessment of liver disease progression in a primary care setting, with subsequent hepatology consultation as needed. Irrespective of FIB-4 scores, however, all patients with MASLD require referral to a primary care provider for management of cardiometabolic risk factors.
Table 1:
Circulating Biomarkers for Assessment of the MASLD Spectrum

Figure 14.

Identification and management of at-risk MASH with FIB-4. Flowchart shows how patients with MASLD should be categorized and where they should follow up according to the FIB-4 score (41).
Although FIB-4 is useful for screening and triaging patients, it is not sufficiently accurate for diagnosis. Several investigational serum biomarkers for diagnosing MASH and at-risk MASH have shown promise when compared with FIB-4 (42) but are not yet available clinically.
Quantitative US Methods
Quantitative US techniques are currently being used clinically to evaluate both hepatic steatosis and fibrosis (Fig 15). The most basic quantitative US technique for assessing steatosis is the hepatorenal index (HRI), in which the brightness of the liver (in arbitrary units) is compared with that of the adjacent kidney (also in arbitrary units). While simple, this method has notable limitations, including the requirement for a normal kidney for comparison (43). Furthermore, the echogenicity of the liver and kidney might vary due to the anisotropy of ultrasound beam scattering, which is influenced by the angle at which the ultrasound beam interrogates these organs (43). More advanced methods use US radiofrequency data to measure quantitative parameters that relate to tissue microstructure. These parameters include the attenuation coefficient (AC), the backscatter coefficient (BSC), statistical parameters describing the distribution of the radiofrequency signal envelope, and the speed of sound in tissue (44). Among these, AC is the most commonly used and is available under various names using proprietary methods from virtually all major US vendors (45). Recently, efforts have been made to integrate AC with the other quantitative US parameters into multiparametric models to improve quantification of liver fat content (46,47). Despite the inherent advantages of US, such as safety, affordability, and accessibility, quantitative US methods do not directly measure liver fat. Instead, they infer its presence through the interaction of the ultrasound beam with tissue, rendering them vulnerable to confounders.
Figure 15.

Quantitative imaging biomarkers for the MASLD spectrum. On the MR elastographic images, the dashed white lines outline the liver. Classification of “clinical” or “investigational” reflects how these modalities are used at the authors’ institutions.
US-based elastography can be used to measure liver stiffness, which is an indirect marker of liver fibrosis (48). The two primary options are vibration-controlled transient elastography (VCTE) (FibroScan; Echosens) and shear-wave elastography (SWE), which is further divided into point and two-dimensional techniques (48). VCTE and SWE have similar performances and have complementary contexts of use. However, VCTE is mainly used as a point-of-care examination in hepatology clinics. It simplifies the workflow but is a purely quantitative tool and provides no structural imaging information. SWE is integrated into clinical US systems and can be performed as part of a diagnostic abdominal imaging examination in radiology, thereby providing a more comprehensive assessment. An in-depth discussion of these techniques is beyond the scope of this article and has been reviewed elsewhere (49).
The application of US-based methods for evaluating hepatic inflammation is an area of active research. Currently, there are no US methods clinically used to determine MASH or at-risk MASH. However, an update to the Society of Radiologists in Ultrasound liver elastography consensus has proposed cut-offs for “ruling in” and “ruling out” advanced chronic liver disease (50).
Quantitative MR Methods
Similar to quantitative US, MRI is currently used clinically for assessing hepatic steatosis and fibrosis (Figs 15–17), with ongoing research aimed at advancing MRI technologies for evaluating hepatic inflammation. Various MRI technologies have been explored for liver fat quantification, among which MRI proton-density fat fraction (PDFF) is now recognized as a viable alternative to liver biopsy for assessing liver steatosis, with PDFF values of ~5% or greater indicating the presence of steatosis (51). MRI PDFF is a direct measure of liver fat content, as it is based on the separation of fat and water MR signals based on physical properties (eg, chemical shift) and offers advantages such as the ability to assess multiple regions of interest, providing a continuous measurement rather than ordinal categories, and its suitability for longitudinal monitoring. The repeatability and reproducibility of MRI PDFF are excellent across different manufacturers and field strengths (52,53).
Figure 17.

MRI for assessment of hepatic steatosis and fibrosis in a 60-year-old woman with biopsy-proven at-risk MASH. Axial MRI PDFF map (left) shows a fat fraction of 12%, and axial 2D MRE stiffness map (right) shows a stiffness of 3.4 kPa. Cardiometabolic factors for MASLD diagnosis included elevated body mass index (26.9 kg/m2) and elevated fasting blood glucose levels. The patient’s alcohol use was less than one drink per week. Serum aspartate aminotransferase (AST) and alanine aminotransferase (ALT) levels were elevated, and the FIB-4 score was 2.0. Note that as fibrosis increases, steatosis can decrease (compared with Figure 16).
Figure 16.

MRI for assessment of hepatic steatosis and fibrosis in a 48-year-old woman with biopsy-proven nonfibrotic MASH. Axial MRI PDFF map (left) shows a fat fraction of 31.9%, and the axial two-dimensional (2D) MR elastography (MRE) stiffness map (right) shows a stiffness of 2.0 kPa. Note the visibility of the hepatic vessels on the MRI PDFF map due to elevated fat deposition within the liver. Cardiometabolic factors for MASLD diagnosis included elevated body mass index (39.8 kg/m2), elevated hemoglobin A1c levels, and hypertriglyceridemia. The patient’s alcohol use was less than one drink per week. Serum asparate aminotransferase (AST) and alanine aminotransferase (ALT) levels were elevated, and the FIB-4 score was 0.90.
MR elastography (MRE) has emerged as the most accurate noninvasive test for detecting and quantifying fibrosis, with a meta-analytical threshold value of 3.14 kPa indicating significant fibrosis (54). However, with one exception, all studies in this meta-analysis enrolled participants from hepatology clinics. Due to spectrum bias, the validity of this meta-analytic threshold for use in the general population or for patients seen in primary care settings remains uncertain. Like SWE and VCTE, MRE does not measure liver fibrosis directly but infers its presence and degree based on tissue stiffness. While based on the same physical parameter (stiffness), MRE has an advantage over VCTE and SWE due to its ability to assess a large liver volume, minimizing sampling error and enabling the assessment of stiffness distribution across the liver (55,56).
Current MRI methods have limited accuracy in differentiating simple steatosis from MASH or identifying patients with at-risk MASH. While emerging data suggest that MRI PDFF might be useful for the noninvasive diagnosis of MASH and at-risk MASH (57), the use of MRI PDFF for these purposes has not been validated. MRE also has limited utility in diagnosing MASH (58). However, a more advanced version of MRE known as three-dimensional MRE has shown promise in distinguishing inflammation from fibrosis (59). Some studies have also suggested that corrected T1 (cT1), a measure of T1 relaxation, might distinguish steatosis from MASH (60) and contribute to the diagnosis of at-risk MASH (61). Ultimately, a combination of imaging and circulating biomarkers may be needed to enable reliable diagnosis of these conditions noninvasively (62).
Future Directions and Challenges
In the following sections, six challenges are highlighted, with the recognition that they also represent opportunities for the field of radiology to lead in the creation of their solutions.
Proliferation Problem
For the assessment of MASLD, a plethora of diagnostic tests have been developed. According to a recent review (40), there are 11 imaging, 24 blood, and six “-omics” diagnostic tests (Fig 18), but those numbers reflect only the tests discussed in the article and do not capture the full magnitude. While the explosion of tests is a testament to innovation and technologic progress, it creates daunting challenges. In the assessment of MASLD, there is still no consensus on which diagnostic test should be used, when they should be implemented, or in what order. In making these decisions, factors such as cost, availability, accuracy, and precision should be considered. Importantly, the “most accurate” or “most precise” test may not be scalable for population level implementation. Achieving a consensus on a more streamline MASLD assessment will require scientific evidence and multidisciplinary perspectives with input from all relevant stakeholders, including patients, their families, and the primary care physicians and hepatologists that order the tests. Furthermore, given many of the tests are imaging based, input is critically needed from radiologists. Consensus guidelines are emerging but unfortunately have not yet included radiologists, a theme that is described later in the article.
Figure 18.
![Proliferation problem. Word cloud illustration shows the conglomeration of circulating- (orange), imaging- (black), and “-omics”- (brown) based diagnostic tests currently available for MASLD. In this figure, -omics refers to genomics, proteomics, metabolomics, and lipidomics. Radiomics are considered imaging biomarkers for the purpose of this figure. (Reprinted with permission from and generated using Wordclouds.com [https://www.wordclouds.com/.])](https://www.ncbi.nlm.nih.gov/core/lw/2.0/html/tileshop_pmc/tileshop_pmc_inline.html?title=Click%20on%20image%20to%20zoom&p=PMC3&id=11580021_rg.240048.fig18.jpg)
Proliferation problem. Word cloud illustration shows the conglomeration of circulating- (orange), imaging- (black), and “-omics”- (brown) based diagnostic tests currently available for MASLD. In this figure, -omics refers to genomics, proteomics, metabolomics, and lipidomics. Radiomics are considered imaging biomarkers for the purpose of this figure. (Reprinted with permission from and generated using Wordclouds.com [https://www.wordclouds.com/].)
Reproducibility Problem
When quantitatively assessing tissue properties, ensuring reproducibility is paramount. Outside of radiology, we take this for granted—scales for body weight, sphygmomanometers for blood pressure, or thermometers for temperature are expected to give similar values regardless of the vendor. However, the reproducibility of many imaging biomarkers used for characterizing liver tissue properties is still suboptimal. The Non-Invasive Biomarkers of Metabolic Liver Disease (NIMBLE) consortium is dedicated to enhancing and evaluating the diagnostic performance of imaging biomarkers (63). The NIMBLE 1.1 and NIMBLE 1.2 studies showed excellent agreement between MRI vendors and between field strengths for PDFF and MRE measures, but substantial variability between US vendors for SWE measures and other quantitative US parameters (64,65) (Fig 19). The cause for the variability in US-based biomarkers is not fully understood but may reflect differences in the proprietary acquisition and processing methods developed by different vendors. The lack of agreement between US vendors of measurements of the same physical property (attenuation coefficient, shear wave speed) creates profound clinical uncertainties, posing a significant obstacle in the routine clinical application of these quantitative imaging biomarkers for measuring various liver indices in MASLD. Until the reproducibility problem is satisfactorily resolved, many of these US-based biomarkers will not be practical for clinical use.
Figure 19.

Reproducibility problem. Reproducibility plots on the left show poor agreement among US vendors for measuring the same US-based biomarkers in adults with known or suspected MASLD (left) including attenuation coefficient (AC) (top left) and shear wave speed (bottom left) in a study by Pierce et al (65). Different colors correspond to paired comparison of values achieved from two different vendors for the same research participants. For AC, four leading vendors were compared, with an intraclass correlation coefficient (ICC) ranging from -0.04 to 0.49. For shear wave speed, five leading vendors were compared, with an ICC ranging from -0.09 to 0.68. For comparison, reproducibility plots on the right show good agreement among MRI vendors for measuring MRI-based biomarkers in adults with known or suspected MASLD including PDFF (top right) and two-dimensional (2D) MRE stiffness (bottom right) in a study by Fowler et al (64). For PDFF, three leading vendors were compared at two field strengths (3 T and 1.5 T), with ICC ranging from 0.97 to 0.98. For 2D MRE stiffness, three leading vendors were compared at two field strengths (3 T and 1.5 T), with ICC ranging from 0.96 to 0.99. Perfect agreement would be ICC of 1.0.
Reporting Problem
Liver steatosis is frequently discovered incidentally at MRI, CT, and US examinations that include images of the abdomen (66,67). Considering that only 4% of patients with MASLD are aware of their condition (16), radiologists can play a crucial role in communicating to patients the presence of disease and triggering appropriate clinical care pathways. However, the criteria used for making the incidental diagnosis of steatotic liver, the manner in which it should be reported and the workup or management recommendations that should be issued are not standardized (68). The absence of guidelines on the reporting and management of the incidental finding of liver steatosis is a challenge but also offers a significant opportunity for radiologists to proactively engage in the decision-making process. Notably, the American College of Radiology in 2023 convened a committee under the umbrella of the Incidental Findings Panel to develop such guidelines, which are still under development (69). Importantly, the committee is led by radiologists with active input from hepatologists.
Needle-in-the-Haystack Problem
MASLD is an increasingly common cause of HCC worldwide, with up to 38% of HCCs now attributable to MASLD, depending on the country and region (70) (Fig 20). Reducing global morbidity and mortality from MASLD-related HCC is a major challenge. Contributing factors include lack of disease awareness, low socioeconomic status, limited access to health care, and suboptimal performance of surveillance US among patients with MASLD, who commonly are overweight or have obesity.
Figure 20.
![Proportion of HCC attributable to MASLD worldwide. India has the highest proportion of HCC attributable to MASLD (38%) and China has the lowest (1%) (70). (Map created with and adapted and reprinted under a CC BY-SA 4.0 license from MapChart [https://www.mapchart.net/].)](https://www.ncbi.nlm.nih.gov/core/lw/2.0/html/tileshop_pmc/tileshop_pmc_inline.html?title=Click%20on%20image%20to%20zoom&p=PMC3&id=11580021_rg.240048.fig20.jpg)
Proportion of HCC attributable to MASLD worldwide. India has the highest proportion of HCC attributable to MASLD (38%) and China has the lowest (1%) (70). (Map created with and adapted and reprinted under a CC BY-SA 4.0 license from MapChart [https://www.mapchart.net/].)
Another, potentially more formidable, obstacle is the needle-in-the-haystack problem. While patients with cirrhosis are more likely to develop HCC than those without, about one-third of HCC cases in patients with MASLD occur in those without cirrhosis (71,72) (Fig 21). Reducing the total burden of HCC will require effective HCC early detection strategies in both populations, the tens of millions of people worldwide with cirrhotic MASLD (in itself a daunting problem) and the greater than 1 billion people worldwide with noncirrhotic MASLD (the needle in the haystack). It will be neither possible nor desirous to survey all individuals with noncirrhotic MASLD. Instead, it will be necessary to stratify HCC risk in patients with noncirrhotic MASLD, thereby identifying a suitable target subpopulation for surveillance. Risk stratification methods will need to be noninvasive, inexpensive, reasonably accurate, and widely available to be cost effective. Such methods do not yet exist, and until they are developed, we anticipate a growing epidemic of HCC-related suffering and death in patients with noncirrhotic MASLD. Many of the solutions will require input from radiologists, advances in imaging technology, and implementation of novel imaging-based opportunistic screening programs (73).
Figure 21.

In about one-third of HCC cases attributed to MASLD, patients do not have cirrhosis. Charts show the attributable proportion of HCC in patients with MASLD (left) versus other liver diseases (eg, viral hepatitis, alcohol-associated liver disease) (right) (71,72).
Availability Problem
There are multiple interrelated barriers to the use of imaging in the diagnosis and management of MASLD, which span societal, institutional, and individual levels (Fig 22). In the following paragraphs, these barriers are described, as well as emerging technologic solutions.
Figure 22.

Availability problem chart. Multiple interrelated barriers reduce the use of imaging in the diagnosis and management of MASLD, spanning from individual to institutional and societal levels.
At the societal level, access and affordability challenge the use of imaging in MASLD. Even in developed countries, there are not enough imaging systems to accommodate the millions of affected individuals. This disparity highlights the potentially transformative role of point-of-care devices such as handheld US probes deployable in primary care and community settings (74). Until recently, point-of-care US devices lacked quantitative capabilities, but advanced point-of-care tools are emerging that can compute attenuation and other sonographic parameters. One approach is illustrated in Figure 23A. This handheld device uses artificial intelligence (AI) to provide guidance feedback to nonexperts in acquiring cinematic sweeps of the liver. The data are then processed in the cloud to generate automated outputs for steatosis and fibrosis. Similarly, investigators are developing tabletop point-of-care MRI devices to measure liver fat and other properties of liver tissue (Fig 23B), offering a potential solution for patients without access to traditional MRI (75).
Figure 23.

Solutions to access and affordability barriers: point-of-care US and MRI. (A) Diagram shows point-of-care US with AI-assisted guidance for acquisition and AI-facilitated analysis of liver steatosis and fibrosis. QUS = quantitative US. (B) Illustration shows point-of-care MRI for liver PDFF measurement.
At the institutional level, centers may lack advanced quantitative imaging technology. To address this challenge, investigators have applied AI to estimate liver stiffness at the individual voxel level (76) (Fig 24 [bottom]) from routine MR images, thereby reducing the need for MRE. Other investigations have applied a similar approach to infer PDFF and R2* at a voxel level from routine in-phase and out-of-phase MRI (77) (Fig 24 [top]). With further development and validation, these AI-based advancements will enable more accurate estimations of these quantitative measurements and enhance diagnostic capabilities for institutions or scanners without the required pulse sequences and hardware.
Figure 24.

Solutions to site technology barrier: AI-derived liver fat and stiffness measurements obtained from other sequences. Diagram shows examples of AI-derived PDFF measurements from in-phase (IP) and out-of-phase (OP) MR images (top row) and AI-derived stiffness measurements from conventional MR images (T1- and T2-weighted MR images shown) (bottom row).
Site-specific experience is another potential barrier. Even when an institution has access to the requisite technologies, it may lack resources for appropriate quality control, data analysis, and reporting, which can be tedious and time consuming. Computer-based approaches are emerging to enable automated quality control, standardized analysis, and structured reporting for MRI PDFF and MRE stiffness (78) (Fig 25).
Figure 25.

Solutions to site experience barrier: automated PDFF and MRE analysis. Axial images show liver fat (outlines) PDFF (left) and liver stiffness from MRE (right) analyzed automatically from PDFF and MRE stiffness maps, respectively. IQR = interquartile range, ROI = region of interest. (Image courtesy of Richard Ehman, MD, Mayo Clinic, Rochester, Minnesota, and Resoundant.)
At the individual level, many people, especially children and adults in poor health, have difficulty with the breath-holding requirements of MRI and MRE, which limits their access to these potentially beneficial technologies. To overcome this hurdle, researchers are devising motion-robust approaches for PDFF and MRE stiffness estimation to enable free-breathing acquisitions (79–81) (Fig 26).
Figure 26.

Solutions to patient tolerance barrier: motion-robust PDFF acquisitions to enable free breathing. A child with MASLD was unable to hold their breath during a 15-second conventional PDFF acquisition (left). Repeat PDFF was performed using an investigational motion-robust sequence during free breathing (right). Image degradation by motion artifact on the axial conventional PDFF image is substantially improved on the axial motion-robust image.
Knowledge Problem
As the attentive reader may have noticed, there are inconsistencies in the basic epidemiology of MASLD. Earlier in this article, it was indicated that the prevalence of MASLD in the United States is about 30% and was then stated that the prevalence of MASLD ranges from about 10%–20% depending on the ethnic group. Similar inconsistencies and uncertainties permeate virtually the entire scientific literature on this disease, including its most basic epidemiology, natural history, pathogenesis, and progression. A few of the current unknowns are listed in Table 2.
Table 2:
Epidemiology and Management Knowledge Gaps in MASLD

A plethora of overlapping factors contributes to these fundamental gaps in knowledge. Among these are the following: (a) the disease is asymptomatic until advanced; (b) reliable and inexpensive screening and diagnostic tests are not available; (c) existing tests are either inaccurate, imprecise, or expensive; (d) noninvasive methods to assess inflammation, cell injury, and other pathogenic factors do not exist; (e) the reporting and workup of incidental fatty liver is not standardized; and (f) the optimal sequence of noninvasive tests, including imaging tests, is not established. Radiologists can and should play a role in overcoming these obstacles.
Conclusion
Until now, radiologists have been excluded from some of the most important health care decisions related to MASLD. Since 2010, 30 clinical practice guidelines and consensus statements on MASLD have been released. Of the 459 unique authors who have contributed to these important documents, only two have been radiologists based on the published affiliations (Fig 27), and no radiology societies have participated. This is unfortunate because imaging plays an essential role in the diagnosis, monitoring, and management of this disorder, and radiology perspectives are needed to integrate imaging properly into these guidelines. The growing prevalence of MASLD will present a major threat to our health care systems, economies, and societies in coming decades. Confronting this global threat will require rigorous research to address our gaps in knowledge, technologic improvements in screening and diagnostic tests, multidisciplinary guidelines to craft effective clinical pathways, and unprecedented cooperation between academia, industry, funding agencies, regulators, and policy makers to accelerate progress. We call on the entire house of radiology—radiologists, technologists, administrators, researchers, industry, and radiology societies—to take action, demand a seat at the table with other societies, and advance the development, validation, dissemination, and accessibility of the technologies needed to confront the looming crisis (Fig 28).
Figure 27.

Historical exclusion of radiologists and radiology societies from MASLD clinical practice guidelines and clinical consensus statements. Four hundred and fifty-nine unique authors have contributed to 30 clinical practice consensus statements since 2010. Only two were radiologists. No radiology society participated. NIH = National Institutes of Health.
Figure 28.

A call to action: moving forward, more active integration by the house of radiology with efforts by existing stakeholders is needed to advance the development, validation, dissemination, and accessibility of the technologies to improve clinical practice and research in MASLD.
Acknowledgments
Acknowledgments
We would like to acknowledge Alessandro Furlan, MD, MPH (University of Pittsburgh, Pittsburgh, Penn), Kayhan Batmanghelich, PhD (Boston University, Boston Mass), and Matthew Ragoza (University of Pittsburgh, Pittsburgh, Penn) for generating and providing images for the AI-derived stiffness measurements in Figure 24.
S.H.S. and V.F.M. contributed equally to this work.
Funding.—C.B.S. is supported by grants from the National Institute of Health (R01 DK088925), National Institute of Diabetes and Digestive and Kidney Disease (R43 DK135225, R01 DK106419, U01 DK130190, U01 DK061734, DK110096), Livivos Inc (R43 EB034626), U.S. Food and Drug Administration (U01 FD007773), and the Foundation for the National Institutes of Health (20192423).
Disclosures of conflicts of interest.—: C.B. Institutional service contracts with various entities for laboratory services (available on request); consulting fees from the Pathology Institute, Bryan, Tex; honoraria from Biomarker and drug development in Alpha-1-Antitrypsin; support for travel from AASLD Conference for presentation. V.C. Consulting fees from Giliad and Bayer. A.E.K. Owns Oncoustics company and receives funding from R21CA256708, R21EB029046, R01CA195443, and Conary foundation. A.A.B. Royalties from Elsevier; grant from Siemens Healthineers; honoraria for educational lectures from AstraZeneca; consults for AstraZeneca and Boston Scientific. A.H. Funding from R21EB032638, R01CA226528, R01HD089935, V Foundation for Cancer Research, Commonwealth Cyber Initiative Southwest Virginia, and Carilion Clinic Research Acceleration Program Awards. K.J.F. Grant support and institutional consulting from Bayer, Guerbet, Median, Ascelia, GE; honoraria from CME Science; payment for expert witness testimony; travel support for an educational series from Bayer: American College of Radiology panel chair, Radiology editorial board member; and LI-RADS Steering Committee co-chair. C.B.S. Grants to institution from ACR, Bayer, GE, Pfizer, Gilead, Philips, Siemens, V Foundation, OrsoBio, Enanta, ICON, Intercept, Nusirt, Shire, Synageva, Takeda; royalties from Medscape, Wolters Kluwer; personal consulting fees from Altimmune, Ascelia Pharma AB, Blade, Boehringer, Epigenomics, Guerbet, Livivos; institutional consultation agreements with AMRA, Exact Sciences, Pfizer; travel support from Fundacion Santa Fe Congreso Argentino de Diagnóstico por Imágenes, Stanford, Jornada Paulista de Radiologia, Ascelia Pharma AB, University of Cincinnati; Chief Medical Officer through June 28, 2023, and Principal Scientific Advisor to Livivos (unsalaried position with stock options and stock) since June 28, 2023; stock and stock options in Livivos; equipment loans to institution from GE and Siemens.
Abbreviations:
- AI
- artificial intelligence
- FIB-4
- fibrosis-4
- HCC
- hepatocellular carcinoma
- MAFLD
- metabolic dysfunction–associated fatty liver disease
- MASH
- metabolic dysfunction-associated steatohepatitis
- MASLD
- metabolic dysfunction–associated steatotic liver disease
- MRE
- MR elastography
- NAFLD
- nonalcoholic fatty liver disease
- PDFF
- proton-density fat fraction
- SLD
- steatotic liver disease
- SWE
- shear-wave elastography
- VCTE
- vibration-controlled transient elastography
References
- 1. Ludwig J , Viggiano TR , McGill DB , Oh BJ . Nonalcoholic steatohepatitis: Mayo Clinic experiences with a hitherto unnamed disease . Mayo Clin Proc 1980. ; 55 ( 7 ): 434 – 438 . [PubMed] [Google Scholar]
- 2. Eslam M , Sanyal AJ , George J ; International Consensus Panel . MAFLD: A Consensus-Driven Proposed Nomenclature for Metabolic Associated Fatty Liver Disease . Gastroenterology 2020. ; 158 ( 7 ): 1999 – 2014.e1 . [DOI] [PubMed] [Google Scholar]
- 3. Rinella ME , Lazarus JV , Ratziu V , et al. ; NAFLD Nomenclature consensus group . A multisociety Delphi consensus statement on new fatty liver disease nomenclature . Hepatology 2023. ; 78 ( 6 ): 1966 – 1986 . [DOI] [PMC free article] [PubMed] [Google Scholar]
- 4. Luedde T , Kaplowitz N , Schwabe RF . Cell death and cell death responses in liver disease: mechanisms and clinical relevance . Gastroenterology 2014. ; 147 ( 4 ): 765 – 783.e4 . [DOI] [PMC free article] [PubMed] [Google Scholar]
- 5. McPherson S , Hardy T , Henderson E , Burt AD , Day CP , Anstee QM . Evidence of NAFLD progression from steatosis to fibrosing-steatohepatitis using paired biopsies: implications for prognosis and clinical management . J Hepatol 2015. ; 62 ( 5 ): 1148 – 1155 . [DOI] [PubMed] [Google Scholar]
- 6. Kleiner DE , Brunt EM , Van Natta M , et al. ; Nonalcoholic Steatohepatitis Clinical Research Network . Design and validation of a histological scoring system for nonalcoholic fatty liver disease . Hepatology 2005. ; 41 ( 6 ): 1313 – 1321 . [DOI] [PubMed] [Google Scholar]
- 7. Dulai PS , Singh S , Patel J , et al . Increased risk of mortality by fibrosis stage in nonalcoholic fatty liver disease: Systematic review and meta-analysis . Hepatology 2017. ; 65 ( 5 ): 1557 – 1565 . [DOI] [PMC free article] [PubMed] [Google Scholar]
- 8. Payne JY , Alkhouri N , Le P , et al . Prevalence of at-risk NASH and its association with metabolic syndrome in US adults with NAFLD, 2017-2018 . Hepatol Commun 2023. ; 7 ( 1 ): e0019 . [DOI] [PMC free article] [PubMed] [Google Scholar]
- 9. Nakamura A , Yoshimura T , Asakura H . Clinical significance of hepatic fat loss in chronic liver disease: a study using MRI proton density fat fractionation . Eur J Clin Nutr 2023. ; 77 ( 2 ): 264 – 269 . [DOI] [PubMed] [Google Scholar]
- 10. Younossi ZM , Golabi P , Paik JM , Henry A , Van Dongen C , Henry L . The global epidemiology of nonalcoholic fatty liver disease (NAFLD) and nonalcoholic steatohepatitis (NASH): a systematic review . Hepatology 2023. ; 77 ( 4 ): 1335 – 1347 . [DOI] [PMC free article] [PubMed] [Google Scholar]
- 11. Ge X , Zheng L , Wang M , Du Y , Jiang J . Prevalence trends in non-alcoholic fatty liver disease at the global, regional and national levels, 1990-2017: a population-based observational study . BMJ Open 2020. ; 10 ( 8 ): e036663 . [DOI] [PMC free article] [PubMed] [Google Scholar]
- 12. Rich NE , Oji S , Mufti AR , et al . Racial and Ethnic Disparities in Nonalcoholic Fatty Liver Disease Prevalence, Severity, and Outcomes in the United States: A Systematic Review and Meta-analysis . Clin Gastroenterol Hepatol 2018. ; 16 ( 2 ): 198 – 210.e2 . [DOI] [PMC free article] [PubMed] [Google Scholar]
- 13. Golovaty I , Tien PC , Price JC , Sheira L , Seligman H , Weiser SD . Food Insecurity May Be an Independent Risk Factor Associated with Nonalcoholic Fatty Liver Disease among Low-Income Adults in the United States . J Nutr 2020. ; 150 ( 1 ): 91 – 98 . [DOI] [PMC free article] [PubMed] [Google Scholar]
- 14. Rich NE , Noureddin M , Kanwal F , Singal AG . Racial and ethnic disparities in non-alcoholic fatty liver disease in the USA . Lancet Gastroenterol Hepatol 2021. ; 6 ( 6 ): 422 – 424 . [DOI] [PubMed] [Google Scholar]
- 15. Walker RW , Belbin GM , Sorokin EP , et al . A common variant in PNPLA3 is associated with age at diagnosis of NAFLD in patients from a multi-ethnic biobank . J Hepatol 2020. ; 72 ( 6 ): 1070 – 1081 . [DOI] [PMC free article] [PubMed] [Google Scholar]
- 16. Alqahtani SA , Paik JM , Biswas R , Arshad T , Henry L , Younossi ZM . Poor Awareness of Liver Disease Among Adults With NAFLD in the United States . Hepatol Commun 2021. ; 5 ( 11 ): 1833 – 1847 . [DOI] [PMC free article] [PubMed] [Google Scholar]
- 17. Schwimmer JB , Deutsch R , Kahen T , Lavine JE , Stanley C , Behling C . Prevalence of fatty liver in children and adolescents . Pediatrics 2006. ; 118 ( 4 ): 1388 – 1393 . [DOI] [PubMed] [Google Scholar]
- 18. Simon TG , Roelstraete B , Hartjes K , et al . Non-alcoholic fatty liver disease in children and young adults is associated with increased long-term mortality . J Hepatol 2021. ; 75 ( 5 ): 1034 – 1041 . [DOI] [PMC free article] [PubMed] [Google Scholar]
- 19. U.S. Food and Drug Administration . Noncirrhotic Nonalcoholic Steatohepatitis With Liver Fibrosis: Developing Drugs for Treatment: Guidance for Industry . https://www.fda.gov/media/119044/download. Published December 2018. Accessed February 1, 2024 .
- 20. Cornier M-A , Dabelea D , Hernandez TL , et al . The metabolic syndrome . Endocr Rev 2008. ; 29 ( 7 ): 777 – 822 . [DOI] [PMC free article] [PubMed] [Google Scholar]
- 21. Ma J , Hwang S-J , Pedley A , et al . Bi-directional analysis between fatty liver and cardiovascular disease risk factors . J Hepatol 2017. ; 66 ( 2 ): 390 – 397 . [DOI] [PMC free article] [PubMed] [Google Scholar]
- 22. Ballestri S , Zona S , Targher G , et al . Nonalcoholic fatty liver disease is associated with an almost twofold increased risk of incident type 2 diabetes and metabolic syndrome. Evidence from a systematic review and meta-analysis . J Gastroenterol Hepatol 2016. ; 31 ( 5 ): 936 – 944 . [DOI] [PubMed] [Google Scholar]
- 23. Armstrong MJ , Adams LA , Canbay A , Syn W-K . Extrahepatic complications of nonalcoholic fatty liver disease . Hepatology 2014. ; 59 ( 3 ): 1174 – 1197 . [DOI] [PubMed] [Google Scholar]
- 24. Mantovani A , Petracca G , Beatrice G , et al . Non-alcoholic fatty liver disease and increased risk of incident extrahepatic cancers: a meta-analysis of observational cohort studies . Gut 2022. ; 71 ( 4 ): 778 – 788 . [DOI] [PubMed] [Google Scholar]
- 25. Ekstedt M , Hagström H , Nasr P , et al . Fibrosis stage is the strongest predictor for disease-specific mortality in NAFLD after up to 33 years of follow-up . Hepatology 2015. ; 61 ( 5 ): 1547 – 1554 . [DOI] [PubMed] [Google Scholar]
- 26. Saadeh S , Younossi ZM , Remer EM , et al . The utility of radiological imaging in nonalcoholic fatty liver disease . Gastroenterology 2002. ; 123 ( 3 ): 745 – 750 . [DOI] [PubMed] [Google Scholar]
- 27. Saverymuttu SH , Joseph AE , Maxwell JD . Ultrasound scanning in the detection of hepatic fibrosis and steatosis . BMJ 1986. ; 292 ( 6512 ): 13 – 15 . [DOI] [PMC free article] [PubMed] [Google Scholar]
- 28. Park HJ , Kim KW , Kwon HJ , et al . CT-based visual grading system for assessment of hepatic steatosis: diagnostic performance and interobserver agreement . Hepatol Int 2022. ; 16 ( 5 ): 1075 – 1084 . [DOI] [PubMed] [Google Scholar]
- 29. Pickhardt PJ , Park SH , Hahn L , Lee SG , Bae KT , Yu ES . Specificity of unenhanced CT for non-invasive diagnosis of hepatic steatosis: implications for the investigation of the natural history of incidental steatosis . Eur Radiol 2012. ; 22 ( 5 ): 1075 – 1082 . [DOI] [PubMed] [Google Scholar]
- 30. Bohte AE , van Werven JR , Bipat S , Stoker J . The diagnostic accuracy of US, CT, MRI and 1H-MRS for the evaluation of hepatic steatosis compared with liver biopsy: a meta-analysis . Eur Radiol 2011. ; 21 ( 1 ): 87 – 97 . [DOI] [PMC free article] [PubMed] [Google Scholar]
- 31. Reeder SB , Cruite I , Hamilton G , Sirlin CB . Quantitative Assessment of Liver Fat with Magnetic Resonance Imaging and Spectroscopy . J Magn Reson Imaging 2011. ; 34 ( 4 ): 729 – 749 . [DOI] [PMC free article] [PubMed] [Google Scholar]
- 32. Lawrence DA , Oliva IB , Israel GM . Detection of hepatic steatosis on contrast-enhanced CT images: diagnostic accuracy of identification of areas of presumed focal fatty sparing . AJR Am J Roentgenol 2012. ; 199 ( 1 ): 44 – 47 . [DOI] [PubMed] [Google Scholar]
- 33. Kim SH , Lee JM , Han JK , et al . Hepatic macrosteatosis: predicting appropriateness of liver donation by using MR imaging—correlation with histopathologic findings . Radiology 2006. ; 240 ( 1 ): 116 – 129 . [DOI] [PubMed] [Google Scholar]
- 34. Reeder SB , Sirlin CB . Quantification of liver fat with magnetic resonance imaging . Magn Reson Imaging Clin N Am 2010. ; 18 ( 3 ): 337 – 357 , ix. [DOI] [PMC free article] [PubMed] [Google Scholar]
- 35. Kudo M , Zheng RQ , Kim SR , et al . Diagnostic accuracy of imaging for liver cirrhosis compared to histologically proven liver cirrhosis. A multicenter collaborative study . Intervirology 2008. ; 51 ( suppl 1 ): 17 – 26 . [DOI] [PubMed] [Google Scholar]
- 36. Okazaki H , Ito K , Fujita T , Koike S , Takano K , Matsunaga N . Discrimination of alcoholic from virus-induced cirrhosis on MR imaging . AJR Am J Roentgenol 2000. ; 175 ( 6 ): 1677 – 1681 . [DOI] [PubMed] [Google Scholar]
- 37. Sumida Y , Nakajima A , Itoh Y . Limitations of liver biopsy and non-invasive diagnostic tests for the diagnosis of nonalcoholic fatty liver disease/nonalcoholic steatohepatitis . World J Gastroenterol 2014. ; 20 ( 2 ): 475 – 485 . [DOI] [PMC free article] [PubMed] [Google Scholar]
- 38. Pirmoazen AM , Khurana A , El Kaffas A , Kamaya A . Quantitative ultrasound approaches for diagnosis and monitoring hepatic steatosis in nonalcoholic fatty liver disease . Theranostics 2020. ; 10 ( 9 ): 4277 – 4289 . [DOI] [PMC free article] [PubMed] [Google Scholar]
- 39. Wattacheril JJ , Abdelmalek MF , Lim JK , Sanyal AJ . AGA Clinical Practice Update on the Role of Noninvasive Biomarkers in the Evaluation and Management of Nonalcoholic Fatty Liver Disease: Expert Review . Gastroenterology 2023. ; 165 ( 4 ): 1080 – 1088 . [DOI] [PubMed] [Google Scholar]
- 40. Martinou E , Pericleous M , Stefanova I , Kaur V , Angelidi AM . Diagnostic Modalities of Non-Alcoholic Fatty Liver Disease: From Biochemical Biomarkers to Multi-Omics Non-Invasive Approaches . Diagnostics (Basel) 2022. ; 12 ( 2 ): 407 . [DOI] [PMC free article] [PubMed] [Google Scholar]
- 41. Rinella ME , Neuschwander-Tetri BA , Siddiqui MS , et al . AASLD Practice Guidance on the clinical assessment and management of nonalcoholic fatty liver disease . Hepatology 2023. ; 77 ( 5 ): 1797 – 1835 . [DOI] [PMC free article] [PubMed] [Google Scholar]
- 42. Sanyal A , Shankar S , Yates K , et al . The Nimble Stage 1 Study Validates Diagnostic Circulating Biomarkers for Nonalcoholic Steatohepatitis . Res Sq 2023rs.3.rs-2492725. [Google Scholar]
- 43. Wear KA , Han A , Rubin JM , et al . US Backscatter for Liver Fat Quantification: An AIUM-RSNA QIBA Pulse-Echo Quantitative Ultrasound Initiative . Radiology 2022. ; 305 ( 3 ): 526 – 537 . [DOI] [PubMed] [Google Scholar]
- 44. Ozturk A , Kumar V , Pierce TT , et al . The Future Is Beyond Bright: The Evolving Role of Quantitative US for Fatty Liver Disease . Radiology 2023. ; 309 ( 2 ): e223146 . [DOI] [PMC free article] [PubMed] [Google Scholar]
- 45. Ferraioli G , Berzigotti A , Barr RG , et al . Quantification of Liver Fat Content with Ultrasound: A WFUMB Position Paper . Ultrasound Med Biol 2021. ; 47 ( 10 ): 2803 – 2820 . [DOI] [PubMed] [Google Scholar]
- 46. Labyed Y , Milkowski A . Novel Method for Ultrasound-Derived Fat Fraction Using an Integrated Phantom . J Ultrasound Med 2020. ; 39 ( 12 ): 2427 – 2438 . [DOI] [PubMed] [Google Scholar]
- 47. Han A , Zhang YN , Boehringer AS , et al . Assessment of Hepatic Steatosis in Nonalcoholic Fatty Liver Disease by Using Quantitative US . Radiology 2020. ; 295 ( 1 ): 106 – 113 . [DOI] [PMC free article] [PubMed] [Google Scholar]
- 48. Tang A , Cloutier G , Szeverenyi NM , Sirlin CB . Ultrasound Elastography and MR Elastography for Assessing Liver Fibrosis: Part 1, Principles and Techniques . AJR Am J Roentgenol 2015. ; 205 ( 1 ): 22 – 32 . [DOI] [PMC free article] [PubMed] [Google Scholar]
- 49. Zhang YN , Fowler KJ , Ozturk A , et al . Liver fibrosis imaging: A clinical review of ultrasound and magnetic resonance elastography . J Magn Reson Imaging 2020. ; 51 ( 1 ): 25 – 42 . [DOI] [PMC free article] [PubMed] [Google Scholar]
- 50. Barr RG , Wilson SR , Rubens D , Garcia-Tsao G , Ferraioli G . Update to the Society of Radiologists in Ultrasound Liver Elastography Consensus Statement . Radiology 2020. ; 296 ( 2 ): 263 – 274 . [DOI] [PubMed] [Google Scholar]
- 51. Cunha GM , Thai TT , Hamilton G , et al . Accuracy of common proton density fat fraction thresholds for magnitude- and complex-based chemical shift-encoded MRI for assessing hepatic steatosis in patients with obesity . Abdom Radiol (NY) 2020. ; 45 ( 3 ): 661 – 671 . [DOI] [PMC free article] [PubMed] [Google Scholar]
- 52. Kang GH , Cruite I , Shiehmorteza M , et al . Reproducibility of MRI-determined proton density fat fraction across two different MR scanner platforms . J Magn Reson Imaging 2011. ; 34 ( 4 ): 928 – 934 . [DOI] [PMC free article] [PubMed] [Google Scholar]
- 53. Artz NS , Haufe WM , Hooker CA , et al . Reproducibility of MR-based liver fat quantification across field strength: Same-day comparison between 1.5T and 3T in obese subjects . J Magn Reson Imaging 2015. ; 42 ( 3 ): 811 – 817 . [DOI] [PMC free article] [PubMed] [Google Scholar]
- 54. Liang JX , Ampuero J , Niu H , et al. ; LITMUS Consortium Investigators . An individual patient data meta-analysis to determine cut-offs for and confounders of NAFLD-fibrosis staging with magnetic resonance elastography . J Hepatol 2023. ; 79 ( 3 ): 592 – 604 . [DOI] [PMC free article] [PubMed] [Google Scholar]
- 55. Zhang YN , Fowler KJ , Boehringer AS , et al . Comparative diagnostic performance of ultrasound shear wave elastography and magnetic resonance elastography for classifying fibrosis stage in adults with biopsy-proven nonalcoholic fatty liver disease . Eur Radiol 2022. ; 32 ( 4 ): 2457 – 2469 . [DOI] [PMC free article] [PubMed] [Google Scholar]
- 56. Hsu C , Caussy C , Imajo K , et al . Magnetic Resonance vs Transient Elastography Analysis of Patients With Nonalcoholic Fatty Liver Disease: A Systematic Review and Pooled Analysis of Individual Participants . Clin Gastroenterol Hepatol 2019. ; 17 ( 4 ): 630 – 637.e8 . [DOI] [PMC free article] [PubMed] [Google Scholar]
- 57. Andersson A , Kelly M , Imajo K , et al . Clinical Utility of Magnetic Resonance Imaging Biomarkers for Identifying Nonalcoholic Steatohepatitis Patients at High Risk of Progression: A Multicenter Pooled Data and Meta-Analysis . Clin Gastroenterol Hepatol 2022. ; 20 ( 11 ): 2451 – 2461.e3 . [DOI] [PubMed] [Google Scholar]
- 58. Ajmera V , Loomba R . Can Elastography Differentiate Isolated Fatty Liver from Nonalcoholic Steatohepatitis? Semin Liver Dis 2018. ; 38 ( 1 ): 14 – 20 . [DOI] [PubMed] [Google Scholar]
- 59. Shi Y , Qi YF , Lan GY , et al . Three-dimensional MR Elastography Depicts Liver Inflammation, Fibrosis, and Portal Hypertension in Chronic Hepatitis B or C . Radiology 2021. ; 301 ( 1 ): 154 – 162 . [DOI] [PMC free article] [PubMed] [Google Scholar]
- 60. Pavlides M , Banerjee R , Tunnicliffe EM , et al . Multiparametric magnetic resonance imaging for the assessment of non-alcoholic fatty liver disease severity . Liver Int 2017. ; 37 ( 7 ): 1065 – 1073 . [DOI] [PMC free article] [PubMed] [Google Scholar]
- 61. Dennis A , Mouchti S , Kelly M , et al . A composite biomarker using multiparametric magnetic resonance imaging and blood analytes accurately identifies patients with non-alcoholic steatohepatitis and significant fibrosis . Sci Rep 2020. ; 10 ( 1 ): 15308 . [DOI] [PMC free article] [PubMed] [Google Scholar]
- 62. Kim BK , Tamaki N , Imajo K , et al . Head-to-head comparison between MEFIB, MAST, and FAST for detecting stage 2 fibrosis or higher among patients with NAFLD . J Hepatol 2022. ; 77 ( 6 ): 1482 – 1490 . [DOI] [PubMed] [Google Scholar]
- 63. Sanyal AJ , Shankar SS , Calle RA , et al . Non-Invasive Biomarkers of Nonalcoholic Steatohepatitis: the FNIH NIMBLE project . Nat Med 2022. ; 28 ( 3 ): 430 – 432 . [DOI] [PMC free article] [PubMed] [Google Scholar]
- 64. Fowler KJ , Venkatesh SK , Obuchowski N , et al . Repeatability of MRI Biomarkers in Nonalcoholic Fatty Liver Disease: The NIMBLE Consortium . Radiology 2023. ; 309 ( 1 ): e231092 . [DOI] [PMC free article] [PubMed] [Google Scholar]
- 65. Pierce T , Ozturk A , Sherlock SP , et al . Variablity of ultrasound-based methods to assess liver stiffness in NAFLD . https://www.postersessiononline.eu/173580348_eu/congresos/ILC2022/aula/-FRI_110_ILC2022.pdf. Published 2022. Accessed February 1, 2024 . [Google Scholar]
- 66. Cieszanowski A , Maj E , Kulisiewicz P , et al . Non-contrast-enhanced whole-body magnetic resonance imaging in the general population: the incidence of abnormal findings in patients 50 years old and younger compared to older subjects . PLoS One 2014. ; 9 ( 9 ): e107840 . [DOI] [PMC free article] [PubMed] [Google Scholar]
- 67. Kontrick AV , VanWagner LB , Yeh C , Courtney DM . Hepatic Steatosis: An Incidental Finding That Deserves Attention . Acad Emerg Med 2021. ; 28 ( 5 ): 578 – 581 . [DOI] [PMC free article] [PubMed] [Google Scholar]
- 68. Wright AP , Desai AP , Bajpai S , King LY , Sahani DV , Corey KE . Gaps in recognition and evaluation of incidentally identified hepatic steatosis . Dig Dis Sci 2015. ; 60 ( 2 ): 333 – 338 . [DOI] [PMC free article] [PubMed] [Google Scholar]
- 69. Incidental Findings . American College of Radiology . https://www.acr.org/Clinical-Resources/Incidental-Findings. Published 2024. Accessed February 1, 2024 .
- 70. Huang DQ , El-Serag HB , Loomba R . Global epidemiology of NAFLD-related HCC: trends, predictions, risk factors and prevention . Nat Rev Gastroenterol Hepatol 2021. ; 18 ( 4 ): 223 – 238 . [DOI] [PMC free article] [PubMed] [Google Scholar]
- 71. Piscaglia F , Svegliati-Baroni G , Barchetti A , et al. ; HCC-NAFLD Italian Study Group . Clinical patterns of hepatocellular carcinoma in nonalcoholic fatty liver disease: A multicenter prospective study . Hepatology 2016. ; 63 ( 3 ): 827 – 838 . [DOI] [PubMed] [Google Scholar]
- 72. Kanwal F , Kramer JR , Mapakshi S , et al . Risk of Hepatocellular Cancer in Patients With Non-Alcoholic Fatty Liver Disease . Gastroenterology 2018. ; 155 ( 6 ): 1828 – 1837.e2 . [DOI] [PMC free article] [PubMed] [Google Scholar]
- 73. Pickhardt PJ , Graffy PM , Perez AA , Lubner MG , Elton DC , Summers RM . Opportunistic Screening at Abdominal CT: Use of Automated Body Composition Biomarkers for Added Cardiometabolic Value . RadioGraphics 2021. ; 41 ( 2 ): 524 – 542 . [DOI] [PMC free article] [PubMed] [Google Scholar]
- 74. Ibrahim MN , Blázquez-García R , Lightstone A , et al . Automated fatty liver disease detection in point-of-care ultrasound B-mode images . J Med Imaging (Bellingham) 2023. ; 10 ( 3 ): 034505 . [DOI] [PMC free article] [PubMed] [Google Scholar]
- 75. Barahman M , Grunvald E , Prado PJ , et al . Point-of-care magnetic resonance technology to measure liver fat: Phantom and first-in-human pilot study . Magn Reson Med 2022. ; 88 ( 4 ): 1794 – 1805 [Published correction appears in Magn Reson Med 2023;89(3):1281.]. [DOI] [PMC free article] [PubMed] [Google Scholar]
- 76. Pollack BL , Batmanghelich K , Cai SS , et al . Deep Learning Prediction of Voxel-Level Liver Stiffness in Patients with Nonalcoholic Fatty Liver Disease . Radiol Artif Intell 2021. ; 3 ( 6 ): e200274 . [DOI] [PMC free article] [PubMed] [Google Scholar]
- 77. Wang K , Cunha GM , Hasenstab K , et al . Deep Learning for Inference of Hepatic Proton Density Fat Fraction From T1-Weighted In-Phase and Opposed-Phase MRI: Retrospective Analysis of Population-Based Trial Data . AJR Am J Roentgenol 2023. ; 221 ( 5 ): 620 – 631 . [DOI] [PMC free article] [PubMed] [Google Scholar]
- 78. Dzyubak B , Li J , Chen J , et al . Automated Analysis of Multiparametric Magnetic Resonance Imaging/Magnetic Resonance Elastography Exams for Prediction of Nonalcoholic Steatohepatitis . J Magn Reson Imaging 2021. ; 54 ( 1 ): 122 – 131 . [DOI] [PMC free article] [PubMed] [Google Scholar]
- 79. Armstrong T , Ly KV , Murthy S , et al . Free-breathing quantification of hepatic fat in healthy children and children with nonalcoholic fatty liver disease using a multi-echo 3-D stack-of-radial MRI technique . Pediatr Radiol 2018. ; 48 ( 7 ): 941 – 953 . [DOI] [PubMed] [Google Scholar]
- 80. Pooler BD , Hernando D , Ruby JA , Ishii H , Shimakawa A , Reeder SB . Validation of a motion-robust 2D sequential technique for quantification of hepatic proton density fat fraction during free breathing . J Magn Reson Imaging 2018. ; 48 ( 6 ): 1578 – 1585 . [DOI] [PMC free article] [PubMed] [Google Scholar]
- 81. Kafali SG , Armstrong T , Shih S-F , et al . Free-breathing radial magnetic resonance elastography of the liver in children at 3 T: a pilot study . Pediatr Radiol 2022. ; 52 ( 7 ): 1314 – 1325 . [DOI] [PMC free article] [PubMed] [Google Scholar]