Abstract
The advent of droplet-based single-cell RNA-sequencing (scRNA-seq) has dramatically increased data throughput, enabling the release of a diverse array of tissue cell atlases to the public. However, we will show that prominent initiatives such as the Human Cell Atlas [1], the Tabula Sapiens [2] and the Tabula Muris [3] contain a significant amount of contamination products (frequently affecting the whole organ) in their data portals due to suboptimal quality filtering. Our work addresses a critical gap by advocating for more stringent quality filtering, highlighting the imperative for a shift from existing standards, which currently lean towards greater permissiveness. We will show the importance of incorporating cell intronic fraction in quality control -or MALAT1 expression otherwise- showcasing its informative nature and potential to elevate cell atlas data reliability. In summary, here, we unveil the hidden intronic landscape of every tissue and highlight the importance of more rigorous single-cell RNA-sequencing quality assessment in cell atlases to enhance their applicability in diverse downstream analyses.
Supplementary Information
The online version contains supplementary material available at 10.1186/s12864-024-11015-5.
Keywords: Quality control, Nuclear fraction, Single-cell RNA-seq, MALAT1, Intronic content, Cell atlases
Introduction
With the rapid advancement of single-cell RNA-seq technologies and the launch of global collaborative initiatives that contributed to the release of the human and mouse reference cell atlases, there is an unprecedented surge in data production. These have contributed to the release of the human and mouse reference cell atlases. The Human Cell Atlas [1] (HCA), the Tabula Sapiens [2] and the Tabula Muris [3] comprise the transcriptome of millions of cells from most human and mouse organs. These atlases represent a new resource to molecularly define cell types, tissues and organs, and serve as an abundant asset to the single-cell research community.
However, our study reveals that a significant number of the available organs in these reference datasets include a substantial amount (up to 85%) of low-quality cells. These findings highlight a long-standing concern within the single-cell community that has not been adequately addressed until now: the difficulty of obtaining high-quality scRNA-seq samples from certain solid tissues [4]. The sample storage conditions, and tissue dissociation protocols usually impact cell viability, which results in different levels of contamination coming from damaged and dying cells [5].
Until we do not reach a solution to achieve improved sample dissociation or accurate enrichment of intact cells prior to sequencing, the current strategy is to bioinformatically filter out low-quality cells before conducting any subsequent analyses. Methods like EmptyDrops [6] followed by excluding cells based on low number of UMIs, low number of genes and high mitochondrial (MT) content (apoptotic cells) [7, 8] are commonly used to exclude empty droplets and compromised cells in scRNA-seq. This quality control procedure may be effective in easy-to-dissociate tissues or cell lines where cells do not undergo aggressive treatment. However, as demonstrated in this study, the procedure proves insufficient for obtaining high-quality cells from challenging tissues, such as heart, liver, or kidney, where typical treatments to dissociate tissue cells is highly aggressive, damaging most of the cells and releasing substantial amounts of RNA to the extracellular medium [5, 9]. While there are tools [10–12] that aim to remove the ambient RNA contained in droplets, any of these methods account for the presence of nuclear content in the cells.
To address this limitation, the nuclear fraction (based on the intronic content) was proposed as a quality metric to distinguish intact cells from cellular debris (cytosolic or nuclear) [9, 13, 14] or, in single-nucleus RNA sequencing (snRNA-seq), to differentiate intact nuclei from nuclei contaminated with cytoplasm [15]. Apart from very specific cell types such as erythrocytes and platelets, which do not possess a nucleus, all cells, once their mRNA is sequenced, should have a significant fraction of reads mapped to introns [16, 17]. Intron-absent cells likely represent empty droplets or other cytosolic debris. Similarly, cells with a very high proportion of intronic reads likely indicate lysed cells that still have nuclei but have lost the cytosol [9, 14]. Despite these advancements, the nuclear content calculation is still underused.
In this study, we use intronic fraction and MALAT1 expression to assess cell quality in several publicly available datasets from reference atlases. These include a kidney dataset from the Tabula Muris dataset [3], a liver and retina dataset from the Human Cell Atlas [18, 19], a mouse kidney cell atlas by Novella-Rausell et al. [20], the Tabula Muris Senis dataset [21], and the Tabula Sapiens dataset [2]. Altogether, we analysed data from 6 cell atlases, involving > 500 samples, > 150 cell types, and > 20 tissues from both humans and mice. We found a significant number of low-quality cells often misidentified as distinct cell subtypes, and in some cases, entire organs were compromised, emphasising the need for custom dissociation protocols. Our study challenges the common belief that high MALAT1 expression indicates degraded tissue samples [9, 13]. While we confirm its role as a nuclear marker, its absence indicates cells lacking a nucleus, making it a valuable quality metric to flag low-quality cells.
Materials and methods
Collecting raw data from different sources
The raw data for the kidney dataset from Tabula Muris (10x Genomics and Smart-seq2 subsets) were downloaded from SRA with accession numbers SRX3791768, SRX3791769, SRX3791776 and SRX3607047. For the liver dataset, the raw data were downloaded as bam files from SRA with accession numbers SRR7276474, SRR7276475, SRR7276476, SRR7276478 and SRR7276477. Raw data as bam files for the retina dataset were downloaded from the Human Cell Atlas data portal in the following link https://explore.data.humancellatlas.org/projects/8185730f-4113-40d3-9cc3-929271784c2b. The bam files of the kidney and retina datasets were converted to fastq files using the bamtofastq tool from the 10x Genomics Cell Ranger (v7.0.1) pipeline.
Processing of sequencing data
For the 10X Genomics data, the count tool from Cell Ranger was used to generate the gene expression matrix for each cell for every fastq file. The unfiltered count matrices for every dataset were loaded into R (v4.2.0) and only the barcodes used by the original authors after their quality control were kept. Then we merged the different matrices of the same dataset to generate a single Seurat [22] (v4.3.0) object for each dataset. To follow the Tabula Muris data processing, reads from Smart-seq2 technique were aligned to the gencode.vM19 mouse genome using STAR [23] (v2.7.9a). Gene counts were produced using HTSeq [24] (v2.0.2) with parameters “-t exon”, “-s no”, “-m intersersection-nonempty”,”-f bam” and “-i gene_name”. Finally, count matrices for each cell were merged into a single R data.frame and a Seurat object was created.
The expression values of each dataset were normalized with standard library size scaling and log transformation using Seurat’s NormalizeData() function with default parameters. The 3000 most variable genes were detected using the variance-stabilizing transformation selection method in Seurat (FindVariableFeatures() function). Then, we scaled the most variable genes using the ScaleData() function from Seurat with default parameters. From the standardized data, we calculated the principal components using the Seurat’s function RunPCA() and used the same number of principal components (pc) as the original authors if reported or based on the respective elbow plots to generate the UMAP coordinates for further visualization of the dataset. Specifically, we used the first 40 pcs in the 10X Genomics kidney dataset from Tabula Muris, the first 30 pcs in the liver dataset, the first 20 pcs in the retina dataset and the first 30 pcs in the Smart-seq2 kidney dataset.
The original cell annotations, as well as the barcodes used by the authors were taken from different sources depending on the dataset. For the Tabula Muris datasets, the Seurat object with the barcodes and annotations was downloaded following its web site instructions (https://tabula-muris.ds.czbiohub.org/). The annotations and barcodes used by the liver dataset’s authors were downloaded from GEO accession number GSE115469. Finally, the authors of the retina dataset kindly shared with us the cell metadata with the barcodes and cell annotations they used in their analysis.
Collecting Seurat objects from CELLxGENE
The Seurat R object of the kidney cell atlas dataset from Novella-Rausell et al. (2023), as well as the Tabula Muris Senis and the Tabula Sapiens were downloaded from CELLxGENE: https://cellxgene.cziscience.com/collections/92fde064-2fb4-41f8-b85c-c6904000b859 for the Novella-Rausella et al. (2023) kidney cell atlas dataset, https://cellxgene.cziscience.com/collections/0b9d8a04-bb9d-44da-aa27-705bb65b54eb for the Tabula Muris Senis dataset and https://cellxgene.cziscience.com/collections/e5f58829-1a66-40b5-a624-9046778e74f5 for the Tabula Sapiens dataset. We would have liked to be able to access the Tabula Sapiens raw data, which are supposed to be available upon request, but we never got an answer from the authors.
Calculation of the intronic content and MALAT1 metrics
For the droplet-based scRNA-seq datasets, the introns content for each cell was determined using the function nuclear_fraction_tags() from the DropletQC R package [9], which basically computes the proportion of intronic reads in each barcode. We also used the function identify_empty_drops() from the same package changing the parameters when needed based on the intron content density plot and the introns content vs. log10 UMIs scatter plot (for details on the selection of cutoff values, please refer to the project’s GitHub: https://github.com/funcgen/single_cell_atlases_quality_assessment). Based on these two metrics, this function classifies the cells as “empty droplet” or “cell”. In brief, it looks for two populations in the intronic content distribution to distinguish empty droplets from real cells. For the kidney Smart-seq2 dataset, we computed the introns content for each cell by parsing the output from Qualimap [25] (v2.2.1) using a custom Python script, available on the project’s GitHub.
Although we refer to these nuclei-free droplets as “empty droplets”, we recognise that they may reflect a range of possibilities in which the common denominator is that their nucleus transcripts are depleted. Classical empty droplets, empty droplets filled with ambient RNA from a specific cell type or partial lysed cells could well be among the scenarios that explain these observed droplets.
While exploring the MALAT1 expression in the Tabula Sapiens dataset, we classified the cells as “MALAT1-” if they did not have any MALAT1 count, and “MALAT1+” otherwise.
Calculation of the correlation between intronic content and genes
We computed the Pearson correlation coefficient between the intronic fraction and each gene. The most correlated gene in all the datasets analysed was MALAT1 (Supplementary Table 1).
Calculation of the mitochondrial percentage in single-cell and single-nucleus RNA-seq
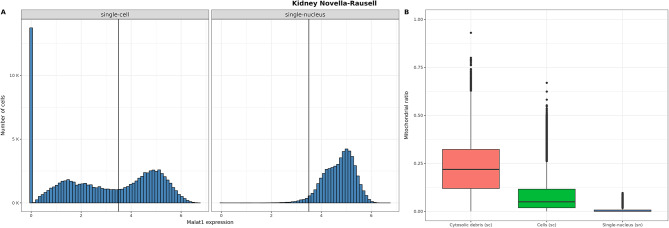
For the Novella-Rausell kidney dataset, we separated the single-cell and single-nucleus barcodes. For each technology, we analyzed the distribution of mitochondrial read percentages in relation to the level of MALAT1 expression in each cell. Cells with fewer than 3.5 normalized MALAT1 counts were classified as “cytosolic debris”, while the remaining cells were assigned to the “cells” group. This threshold was determined through visual inspection of the distribution.
Figures
All figures were created in R (v4.1.2) using Seurat [22] (v4.3.0), ggplot2 [26] (v3.4.2) and scCustomize [27] (v1.1.3).
Results
A significant proportion of cells with null intronic fraction in reference atlases
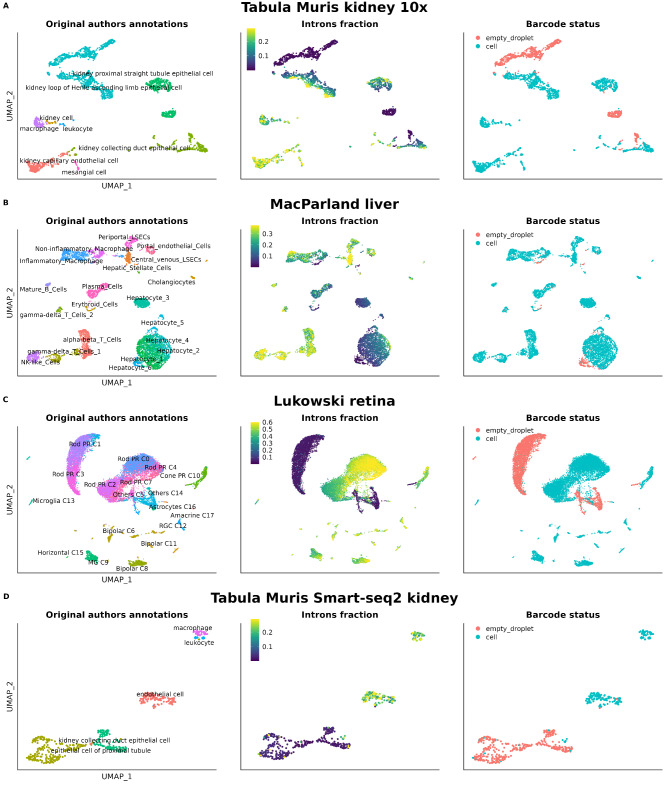
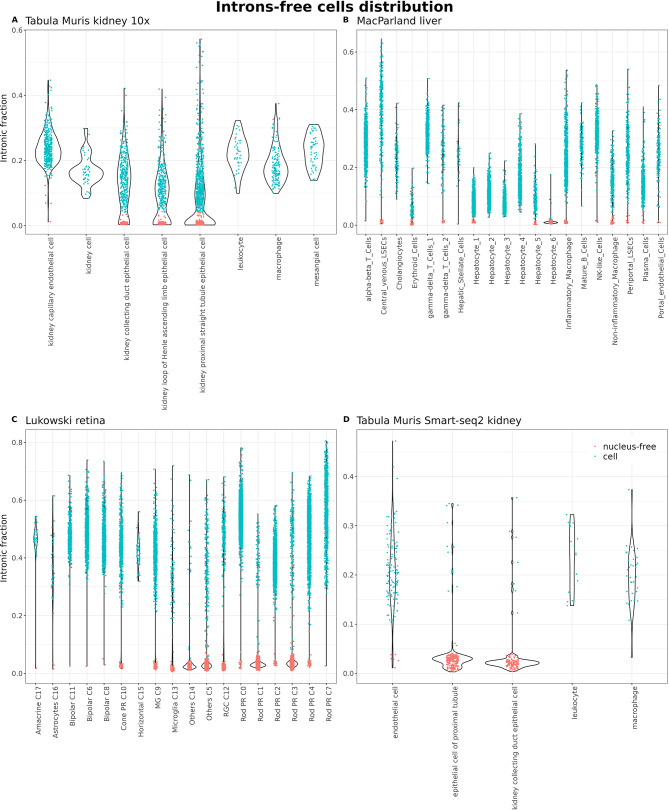
The first scRNA-seq dataset inspected belongs to the Tabula Muris project, specifically the dataset obtained from microfluidics (10x Genomics) of the kidney. The original data already processed by the authors can be interactively explored on the Tabula Muris data portal: https://tabula-muris.ds.czbiohub.org/. In the original study, they applied the standard quality control: cells with fewer than 500 genes (nFeatures) or fewer than 1000 captured UMIs (nUMIs) were discarded. In total, 2781 cells passed the filters and were deemed suitable for downstream analysis, where they were classified into 8 different cell types. In Fig. 1A, it can be observed that among the cells used by the authors for the analyses, 5 clusters with virtually zero nuclear fraction appear. Significantly, the epithelial cells of the proximal straight tubule are arranged in two nearly specular clusters, one with high and the other with null intron content. Cells with no intronic reads were labelled as empty droplets (Fig. 1A). At least, a total of 843 cells (precisely 30.31% of the cells in the dataset) from 4 different cell types (capillary endothelial cells, collecting duct epithelial cells, loop of Henle ascending limb epithelial cells and proximal straight tubule epithelial cells) should have been discarded or flagged during the initial quality control (Fig. 2A and Supplementary Table 2).
Fig. 1.
UMAPs showing cell type annotation, nuclear fraction and empty droplet/cell classification. (A) Kidney 10X Genomics, (B) Liver 10X Genomics, (C) Retina 10X Genomics, (D) Kidney Smart-Seq2
Fig. 2.
A-D) Distribution of intronic fraction for each cell type in each dataset
We also inspected the data from the first cell atlas of the human liver, which was published by MacParland et al. (2018) [18]. The quality control conducted in this study, once again, was the standard; cells with more than 1500 UMIs and less than 50% of UMIs mapped to mitochondrial genes passed the initial filtering. In total, 8444 cells, classified into 9 cell types and 20 different clusters, form this atlas. In this dataset, the majority of hepatocytes exhibit very low intronic content with their cluster showing a gradient in this regard. Interesting to note, the cluster annotated by the authors as “Hepatocyte_6” consists of cells with almost null intronic content and were classified as empty droplets (Figs. 1B and 2B). On the contrary, non-parenchymal cells show much higher contents. At least 188 hepatocytes, constituting 5.37% of all hepatocytes, should not have passed the quality control and be removed or flagged. Other small clusters (from endothelial cells, macrophages and erythroids) were also identified as empty droplets by the extremely reduced amount of intronic reads (Supplementary Table 2). Erythrocytes, as expected for anucleated cells, also appear as cells with a residual amount of intronic content.
Finally, we analyzed the single-cell atlas of the adult human retina published by Lukowski et al. in 2019 [19]. This atlas can be accessed on CELLxGENE by following this link: https://cellxgene.cziscience.com/e/d5c67a4e-a8d9-456d-a273-fa01adb1b308.cxg/. The authors of this study performed traditional quality control, classifying cells with fewer than 200 or more than 2500 detected genes and expressing more than 10% of mitochondrial genes as low-quality cells. A total of 20,009 cells passed these filters and constitute this atlas. In the publication, a total of 10 different cell types were reported across 18 clusters based on the transcriptional state of the cells. As observed in Fig. 1C, there are 4 clusters formed by droplets without immature mRNA, classified as empty droplets because of their extremely low intronic content (Fig. 2C). Interestingly enough, rod cells appear in two big clusters with high (C0, C2, C4, C7) and low intron content (C1, C3), and the cells classified as “Others” also have null intron content. Thus, at least 6351 cells from 9 different cell types, representing 31.74% of the cells in the dataset, should not have been included in the analyses (Supplementary Table 2).
The presence of cells with null intron content was also observed in the Smart-seq2 dataset of the Tabula Muris kidney, and also were flagged as “empty droplet” for that reason. Here, similar quality control as for the 10x Genomics data was applied by the original authors: cells with fewer than 500 genes or more than 50,000 reads were discarded. The most affected cells coincided with those from the same tissue obtained with the droplet-based technology from 10x Genomics (Figs. 1D and 2D).
MALAT1 can be used as a surrogate for cellular nuclear content
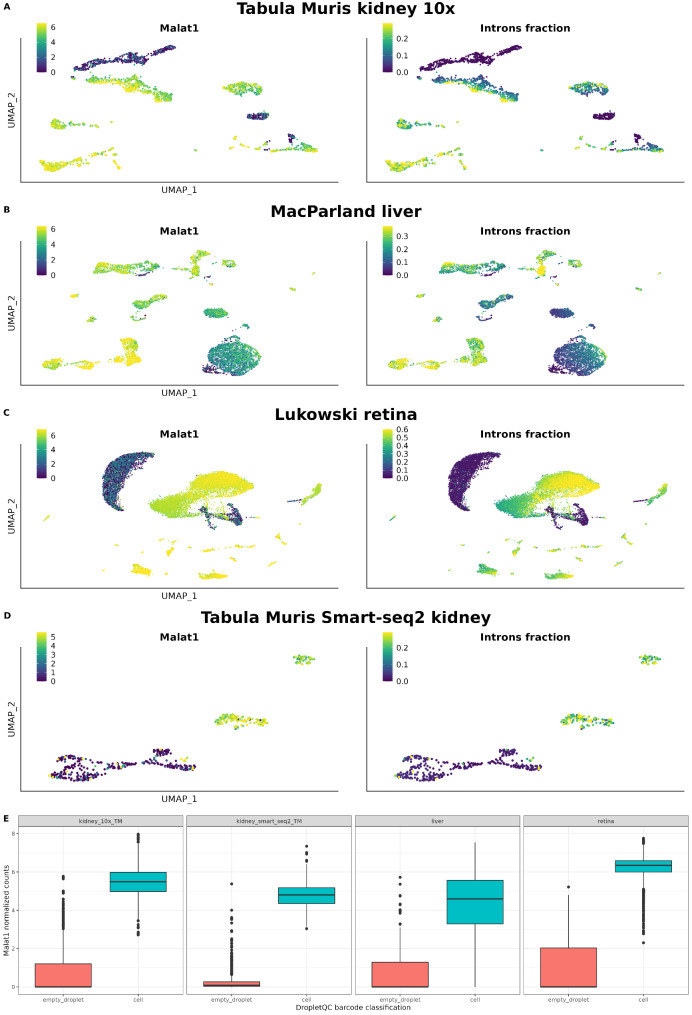
The cells without immature mRNA and flagged as empty droplets in the kidney, liver, and retina datasets, also exhibited very low or no expression of the long non-coding RNA MALAT1 (Fig. 3A-D). All cell types with a null content of immature mRNA (except for cells annotated as erythrocytes, which naturally should not contain introns) displayed this characteristic. Among all genes in the dataset, we found MALAT1 as the gene most correlated with the introns fraction in all four datasets (r = 0.83 for Tabula Muris kidney 10x Genomics; r = 0.78 for MacParland liver; r = 0.92 for Lukowski retina; and r = 0.91 for Tabula Muris kidney Smart-seq2, all p-values < 2.2 × 10− 16) (Supplementary Table 1).
Fig. 3.
A-D) UMAPs showing the relationship between intron content and MALAT1 expression. E) Boxplots of MALAT1 expression in empty droplets and cell subsets
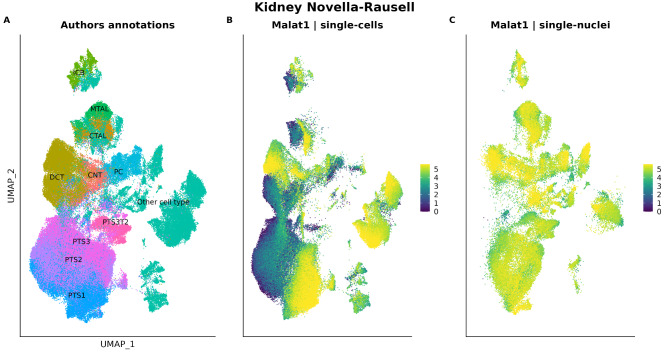
Using the MALAT1 expression as a proxy of the intron fraction, we explored a recent publicly available kidney atlas dataset from Novella-Rausell et al. (2023), where we only got access to the count matrix and we could not calculate the percentage of intronic reads per cell. In this study, the authors constructed a cell atlas from 59 public kidney datasets from 8 different studies. After filtering cells based on the number of UMIs and the percentage of reads mapped to the mitochondrial genome, a total of 141,401 cells were considered suitable for inclusion in the atlas and for conducting downstream analyses. This dataset can be interactively explored on CELLxGENE through this link: https://cellxgene.cziscience.com/e/42bb7f78-cef8-4b0d-9bba-50037d64d8c1.cxg/. It consists of samples obtained from both single-cell RNA-seq and single-nucleus RNA-seq techniques. Single-cell samples showed many MALAT1- cell clusters, as opposed to single-nucleus samples (Fig. 4A-C). This is consistent with the fact that MALAT1 is confined in the nucleus.
Fig. 4.
(A) Annotated cell types and Malat1 expression of the Novella-Rausell et al. (2023) kidney dataset (single-cells and single-nuclei). Cell types having Malat1 + and Malat- clusters are in colour, the rest of cell types (in grey) have been grouped as “Other cell type”. (B) Malat1 expression in the single-cell subset. (C) Malat1 expression in single-nucleus subset. ICB: Intercalated Cell Type B, PTS1: Proximal Tubule Segment 1, PTS2: Proximal Tubule Segment 2, PTS3: Proximal Tubule Segment 3, PTS3T2: Proximal Tubule Segment 3 Type 2, PC: Principal Cell, DCT: Distal Convoluted Tubule, CTAL: Thick Ascending Limb of Henle in Cortex, MTAL: Thick Ascending Limb of Henle in Medulla, CNT: Connecting Tubule, Podo: Podocyte
Of note, the distribution of MALAT1 expression in the single-cell subset showed a multimodal distribution. On the other hand, the single-nucleus subset showed a unimodal distribution (Fig. 5A). Given that the distribution of the single-nucleus subset overlaps one of the peaks of the single-cell distribution, we hypothesised that, in the single-cell subset, the amount of MALAT1 expression reflected nucleus-present fractions (MALAT1 high) and empty droplets/cytosolic debris (MALAT1 null or low), as proposed by Clarke and Badder (2024) [28].To further support this fact, we studied the mitochondrial percentage distribution of each droplet class found in the single-cell subset. As expected, the distribution of the mitochondrial percentage in the single-cell nucleus-present fraction was very moderate, while the single-cell empty droplets and cytosolic debris cells showed higher amounts of mitochondrial reads (Fig. 5B). These results support the fact that MALAT1 low cells are, indeed, poor-quality cells.
Fig. 5.
MALAT1 expression distribution in the single-cell and single-nucleus subsets and its relation with the percentage of mitochondrial mRNAs in the Novella-Rausell kidney cell atlas dataset. (A) Distribution of MALAT1 expression in the single-cell (left) and single-nucleus (right) subsets. The vertical line indicates the cutoff used to divide the two population of MALAT1 + cells. (B) Distribution of the percentage of mitochondrial mRNAs in the three different MALAT1 populations: cytosolic debris and cells (single-cell assay) and nuclei (single-nuclei assay)
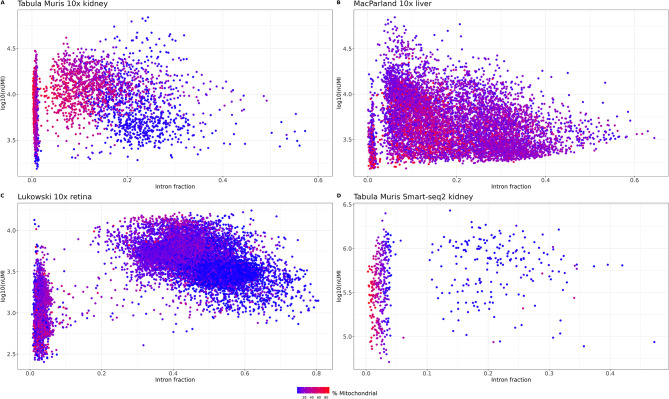
We then investigated whether the intron fraction of the four single-cell RNA-seq reanalyzed (Tabula Muris kidney 10x and Smart-seq2, MacParland liver and Lukowski retina) allowed us to distinguish between cytosolic debris, cells and bare nuclei or damaged cells, as mentioned in the literature [9, 14]. Two clear populations of barcodes could be easily identified. Those with extremely low introns fraction and the rest (Fig. 6A-D). The mitochondrial percentage varied among the low introns fraction, compatible with the fact that this subset may represent empty droplets and cytosolic debris droplets that can or cannot have encapsulated mitochondria. This is consistent with the classification of these cells done by Braun et al. [14] that they represent cytoplasm and mitochondrial debris.
Fig. 6.
Relationship between intronic fraction (x axis), total UMI (y axis) and mitochondrial content (color scale). (A) Kidney 10x Genomics. (B) Liver 10x Genomics. (C) Retina 10x Genomics. (D) Kidney Smart-Seq2
On the other hand, the fraction with extremely high intron fraction tended to have less mitochondrial percentage and, as already mentioned in the literature, low total UMIs. By plotting the intronic fraction against the total number of UMIs it is possible to identify potential bare nuclei. In Fig. 6A, there are a bunch of cells with extremely high intronic fraction and low total UMIs. However, as mentioned in Muskovic and Powell (2021) [9], it can be cell type specific. Table 1 summarizes the characterization of the different cell fractions depending on the relative amount of nUMI, mitochondrial percent and intron content (or MALAT1 expression).
Table 1.
Relative amount of intronic content (or MALAT1), mitochondrial and nUMIs of each type of droplet
| Type of droplet | Intronic/MALAT1 | Mitochondria | nUMIs |
|---|---|---|---|
| Empty droplet | null | variable | low |
| Mitochondrial debris | null | high | low |
| Cytosolic debris | null/low | high | variable |
| Bare nucleus | high | low | high |
| Damaged/dying cell | high | high | variable |
| Whole cell | intermediate | low/intermediate | high |
MALAT1- group of cells appears in all tissues from Tabula Sapiens
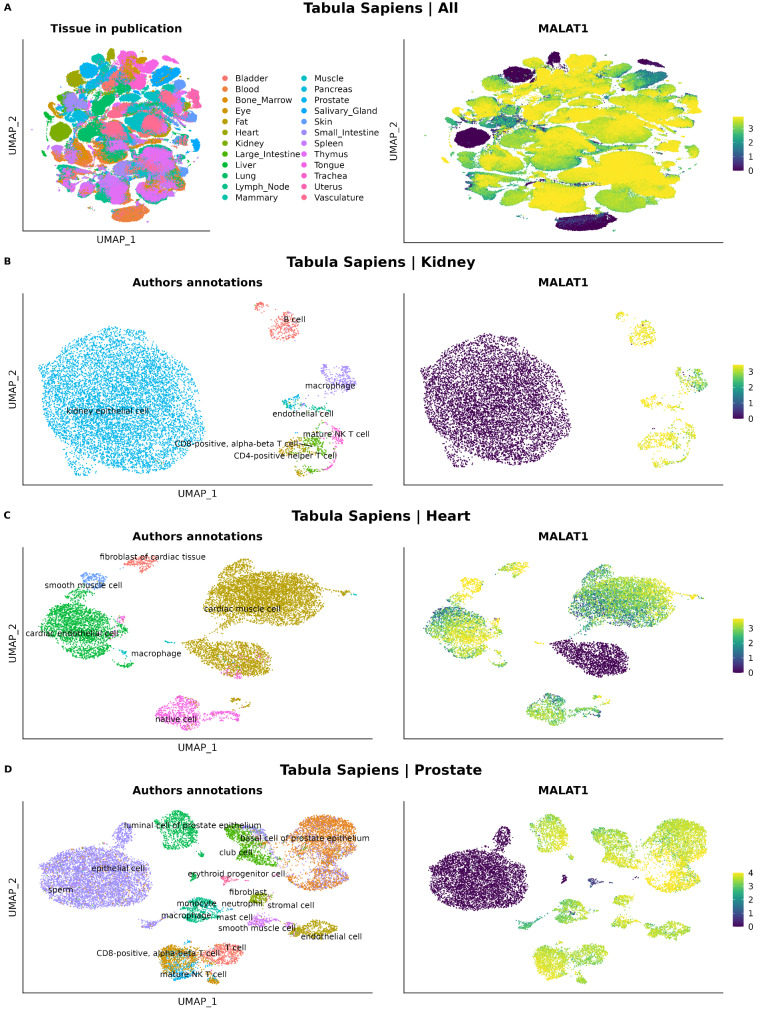
The Tabula Sapiens dataset allowed us to explore the presence of the MALAT1- group of cells from 28 different tissues and organs from the human body (Fig. 7A). In all of them, we identified MALAT1- cell clusters, being kidney, prostate and heart, the three tissues (excluding blood since it contains red blood cells which lack nucleus) with the highest proportion of MALAT1- cells (Table 2 and Supplementary Table 3). Among specific cell types, sperm, kidney epithelial cells, and slow muscle cells have the highest percentage of MALAT1- cells, once erythrocytes were excluded (100%, 99.412% and 78.528%, respectively) (Table 3 and Supplementary Table 3).
Fig. 7.
UMAPs showing tissues and their MALAT1 normalized counts in Tabula Sapiens datasets. (A) All tissues. (B) Kidney. (C) Heart. (D) Prostate
Table 2.
Absolute number of MALAT1-cells and their proportion in the top 5 tissues with more MALAT1-percentage of cells in the Tabula Sapiens dataset
| Tissue | MALAT1- | MALAT1+ | % MALAT1- |
|---|---|---|---|
| Kidney | 8301 | 1340 | 86,1 |
| Prostate | 6037 | 10338 | 36,87 |
| Blood | 9824 | 40291 | 19,63 |
| Heart | 1950 | 9555 | 16,95 |
| Tongue | 1990 | 13030 | 13,25 |
Table 3.
10 cell types with the highest percentage of MALAT1- cells in the Tabula Sapiens dataset
| Annotated cell type | MALAT1- | MALAT1+ | Sum | % MALAT1- |
|---|---|---|---|---|
| sperm | 11 | 0 | 11 | 100 |
| kidney epithelial cell | 8282 | 49 | 8331 | 99,41 |
| erythrocyte | 9735 | 1269 | 11004 | 88,47 |
| slow muscle cell | 128 | 35 | 163 | 78,53 |
| epithelial cell | 7083 | 2079 | 9162 | 77,31 |
| fast muscle cell | 167 | 185 | 352 | 47,44 |
| platelet | 103 | 165 | 268 | 38,43 |
| retinal pigment epithelial cell | 15 | 34 | 49 | 30,61 |
| cardiac muscle cell | 1782 | 5423 | 7205 | 24,73 |
| cell of skeletal muscle | 2 | 8 | 10 | 20 |
We further explored the MALAT1 expression of the kidney, prostate and heart datasets from the Tabula Sapiens atlas (Fig. 6B-D). MALAT1- cells can be observed as clusters in the UMAPs of the three tissues. In a similar way as in the Novella-Rausell et al. kidney atlas dataset, in the heart dataset the same annotated cell type (cardiac muscle cell) was divided in two clusters, one MALAT1- and another MALAT1+.
On the other hand, the Tabula Muris Senis dataset also revealed the presence of these cells. Among the tissues present in this dataset, pancreas, liver and kidney are those with higher percentage of Malat1- cells (14.6%, 11.8% and 6.1%, respectively) (Supplementary Table 4). The three cell types with the highest proportion of MALAT1- cells are pancreatic acinar cells, ependymal cells and cells of skeletal muscle (51.2%, 38.2% and 34.4%, respectively). Other cell types also affected are those from kidney (collecting duct epithelial cells, 30.2%, proximal straight tubule epithelial cells, 23.2%) and heart (cardiac muscle cells, 20.4%) (Supplementary Table 4).
In the same way as we did with the Tabula Sapiens dataset, we explored the UMAPs of the most affected tissues searching for Malat1 + and Malat1- clusters of cells. The original authors divide these datasets into the 10x Genomics and Smart-seq2 subsets. Thus, we explored these subsets separately. In these three tissues (pancreas, liver and kidney), Malat1- cells clustered in the same pattern as in the Tabula Sapiens dataset (Supplementary Fig. 1 and Supplementary Fig. 2).
Finally, we confirmed that the presence of MALAT1- cells does not depend on the technology used for sequencing. Both the 10x Genomics (3’ and 5’) and Smart-seq2 subsets showed similar percentages of MALAT1- cells. (Supplementary Tables 3 and 4).
Discussion
Tissue dissociation, a necessary step for acquiring samples suitable for scRNA-seq, subjects cells to traumatic conditions. Previous studies have highlighted the emergence of cell clusters exhibiting up-regulated genes associated with stress conditions [4, 29–31]. However, to date, the presence of cell clusters devoid of immature mRNA content has not been thoroughly investigated as an artifact. While the intronic content metric was initially introduced in 2021 to identify empty droplets in droplet-based scRNA-seq datasets [9], and later adopted for quality control in heart and brain tissues by, at least, three separate publications [13–15], no studies have demonstrated the widespread presence of cells with null intronic content in publicly available resources such as the human and mouse reference cell atlases. Surprisingly, these seminal findings have received limited attention within the single-cell community, as indicated by the low citation count of the initial study of Muskovic and Powell (2021) [9] proposing the use of this metric for quality control.
Our reanalysis of single-cell data downloaded from Human Cell Atlas and Tabula Muris, utilizing the percentage of reads mapped to introns as a quality metric, reveals that organs designated as ‘high-quality’ often harbor a variable number of cells with questionable viability. These cells, unnoticed by standard quality control metrics, are routinely incorporated into downstream analyses. Alternatively, we propose using MALAT1 expression level, given its strong correlation with intronic content, as a new quality control metric useful in scenarios where only the gene count matrix is available. Traditionally, MALAT1 has been associated with an inverse correlation to cell health, with higher expression levels observed in dead or dying cells (some tutorials even recommend excluding MALAT1 from analysis). However, our findings reveal an additional usage: negligible or low MALAT1 expression levels correspond to empty droplets or cytosolic debris. Cells with ineffective nuclear lysis could also match this scenario of low MALAT1 and low intronic content.
As used in Muskovic and Powell (2021) [9] and Braun, E. et al. (2023) [14], here we also showed that cells with an extremely high intronic content and relatively low total UMIs likely represent nucleus-enriched cells where the cytoplasmic content has leaked.
In the kidney and liver datasets, the cell types that showed clusters with no immature mRNA have been already described as difficult-to-dissociate cells. In the kidney dataset, the cells from the proximal tubule are the ones with a higher proportion of cells without immature mRNA. This fact aligns with what Jansen et al. [32] recently reported studying the effect of ambient RNA: cells from the proximal tubule are the most vulnerable to the tissue dissociation process. The authors of the liver dataset acknowledged that the cluster of cells labelled as “Hepatocyte_6”, the one with no unspliced mRNA, had the lowest amount of captured reads and that further investigations were needed to clarify the origin and role of these cells. This, combined with the recent work by Jin-Mi Oh et al. [33], where they found that hepatocytes are the liver cell type most affected by dissociation effects, seems to indicate that the reduced unspliced mRNA content, not only in this cluster but in all hepatocytes in this dataset, likely comes from cytosolic debris and is a result of the dissociation process.
Although in the publications associated with the kidney and liver datasets, the lack of MALAT1 expression in those cell clusters was not reported, the authors of the retina dataset study did report it and validated experimentally. They hypothesized that the appearance of rods with low MALAT1 expression (which are the same as those with no immature RNA) was due to their degeneration, as the proportion of those cells increased with the post-mortem time of the donor. However, we found that this was not an exclusive feature of rods, as we also found apparent degenerated cones, astrocytes, and microglial cells.
These facts align with the findings of our analysis of the Tabula Sapiens and Tabula Muris Senis datasets which revealed variations in the percentage of MALAT1- cells among different cell types within the same tissue. This variability suggests that the experimental methodologies employed for cell isolation and lysis might not uniformly impact all cell types.
The inadvertent inclusion of low-quality cells in the analysis can yield significant consequences for the outcomes. On the one hand, it may erroneously suggest the presence of specific cell subtypes within a sample, exemplified by the misidentification of the “Hepatocyte_6” cluster in the liver dataset. As we noted in this work, usually the same cell type is found in two different clusters, one with introns and the other without introns. This, in turn, may hamper the precise automatic annotation of cell types, and potentially impacts differential expression analysis within clusters of the same cell type or across different cell types. Of particular significance, methods reliant on the relative abundance of spliced (no-introns) versus unspliced (with introns) reads to infer developmental trajectories, such as RNA velocity [34, 35], may yield unreliable results if failing to account for the biases outlined in this study.
Our work aims to emphasize the importance of the unspliced mRNA fraction metric in the initial quality control of scRNA-seq datasets. As stated before, the use of this metric allows the identification of cells that are likely degraded due to experimental dissociation processes. However, although we showed that it is independent of the sequencing technology, we did not study the effect of different dissociation techniques on the generation of these cells. For example, Denisenko et al. (2020) [4] reported that the expression of stress-associated genes is much lower if dissociation is carried out in cold conditions. Denisenko et al. (2020) and Jin-Mi Oh et al. (2022) [4, 33] also reported that scRNA-seq and snRNA-seq techniques allow for the recovery of different proportions of each cell type from a tissue, something that agrees with our findings on MALAT1 expression pattern in the kidney dataset from Novella-Rausell et al. (2023). Other studies also evaluated the use of transcription inhibitors [36] or, more recently, advanced dissociated tissue preservation [37]. Thus far, the presence of stressed cells has been recognized as a significant artefact across various publicly available datasets. However, the quality assessment of these works did not inspect their datasets for the presence of cells with null intronic content.
In summary, our findings reveal that clusters of cells lacking immature mRNA or MALAT1 represent a prevalent artefact in both droplet-based and plate-based scRNA-seq datasets, underscoring the importance of addressing this issue to avoid bias in downstream analyses. Despite the rapid advancements in scRNA-seq technology, the recommended quality control measures have remained largely unchanged since the inception of the technique. With growing evidence suggesting the inadequacy of conventional quality control standards for certain tissue samples, the inclusion of metrics such as the unspliced mRNA fraction becomes imperative.
Future perspectives
Reference cell atlases, representing both human and mouse body organs, stand as invaluable resources for the single-cell community. However, they often contain numerous low-quality cells that have eluded detection. The presence of artefacts in reference single-cell datasets dampens their quality, potentially compromising the performance of emerging generative single-cell foundation models. These models, pretrained on a vast amount of data (e.g., scGPT [38] used more than 30 millions of cells from CELLxGENE) rely on the availability of high-quality data for accurate predictions and interpretations. While laboratory protocols strive to yield only high-quality cells, it is imperative that robust bioinformatics strategies are implemented to effectively flag and exclude low-quality cells from analyses. In this way, advancements in single-cell spatial technologies hold promise for mitigating cell loss and enabling the acquisition of whole transcriptome imaging at true single-cell resolution. Adopting these developments will be pivotal in advancing on the reliability of the single-cell genomics field.
Electronic supplementary material
Below is the link to the electronic supplementary material.
Acknowledgements
We would like to thank CNAG’s director Dr Ivo Gut for his support throughout this project. We appreciate the constructive feedback from the reviewers and editors at BMC Genomics.
Author contributions
T.M-A and A.E-C conceived the project. T.M-A performed the bioinformatic analyses. T.M-A and A.E-C wrote the manuscript. A.E-C supervised the project.
Funding
Institutional support to CNAG was provided by the Spanish Ministry of Science and Innovation through the Instituto de Salud Carlos III, and by the Generalitat de Catalunya through the Departament de Salut and the Departament de Recerca i Universitats.
Data availability
All single-cell and single-nuclei RNA-seq datasets used in this study are publicly available from different sources as described in Materials and Methods. The R and Python scripts used in this study can be found at https://github.com/funcgen/single_cell_atlases_quality_assessment.
Declarations
Ethics approval and consent to participate
“Not applicable”.
Consent for publication
“Not applicable”.
Competing interests
We declare no competing interests.
Footnotes
Publisher’s note
Springer Nature remains neutral with regard to jurisdictional claims in published maps and institutional affiliations.
References
- 1.Regev A et al. Hum Cell Atlas eLife 6, (2017). [DOI] [PMC free article] [PubMed]
- 2.THE TABULA SAPIENS CONSORTIUM. The Tabula Sapiens: a multiple-organ, single-cell transcriptomic atlas of humans. Science. 2022;376:eabl4896. [DOI] [PMC free article] [PubMed] [Google Scholar]
- 3.Schaum N, et al. Single-cell transcriptomics of 20 mouse organs creates a Tabula Muris. Nature. 2018;562:367–72. [DOI] [PMC free article] [PubMed] [Google Scholar]
- 4.Denisenko E, et al. Systematic assessment of tissue dissociation and storage biases in single-cell and single-nucleus RNA-seq workflows. Genome Biol. 2020;21:130. [DOI] [PMC free article] [PubMed] [Google Scholar]
- 5.Arceneaux D, et al. A contamination focused approach for optimizing the single-cell RNA-seq experiment. iScience. 2023;26:107242. [DOI] [PMC free article] [PubMed] [Google Scholar]
- 6.Lun ATL, et al. EmptyDrops: distinguishing cells from empty droplets in droplet-based single-cell RNA sequencing data. Genome Biol. 2019;20:63. [DOI] [PMC free article] [PubMed] [Google Scholar]
- 7.Luecken MD, Theis FJ. Current best practices in single-cell RNA-seq analysis: a tutorial. Mol Syst Biol. 2019;15:e8746. [DOI] [PMC free article] [PubMed] [Google Scholar]
- 8.Heumos L, et al. Best practices for single-cell analysis across modalities. Nat Rev Genet. 2023;24:550–72. [DOI] [PMC free article] [PubMed] [Google Scholar]
- 9.Muskovic W, Powell JE. DropletQC: improved identification of empty droplets and damaged cells in single-cell RNA-seq data. Genome Biol. 2021;22:329. [DOI] [PMC free article] [PubMed] [Google Scholar]
- 10.Young MD, Behjati S. SoupX removes ambient RNA contamination from droplet-based single-cell RNA sequencing data. GigaScience. 2020;9:giaa151. [DOI] [PMC free article] [PubMed] [Google Scholar]
- 11.Yang S, et al. Decontamination of ambient RNA in single-cell RNA-seq with DecontX. Genome Biol. 2020;21:57. [DOI] [PMC free article] [PubMed] [Google Scholar]
- 12.Fleming SJ, et al. Unsupervised removal of systematic background noise from droplet-based single-cell experiments using CellBender. Nat Methods. 2023;20:1323–35. [DOI] [PubMed] [Google Scholar]
- 13.Schmauch E et al. QClus: Robust and reliable preprocessing method for human heart snRNA-seq. 2022.10.21.513315 Preprint at 10.1101/2022.10.21.513315 (2022).
- 14.Braun E, et al. Comprehensive cell atlas of the first-trimester developing human brain. Science. 2023;382:eadf1226. [DOI] [PubMed] [Google Scholar]
- 15.Macnair W, Robinson M. SampleQC: robust multivariate, multi-cell type, multi-sample quality control for single-cell data. Genome Biol. 2023;24:23. [DOI] [PMC free article] [PubMed] [Google Scholar]
- 16.Interpreting Intronic and Antisense Reads in 10x Genomics Single Cell Gene Expression Data -. Official 10x Genomics Support. 10x Genomicshttps://www.10xgenomics.com/support/single-cell-gene-expression/documentation/steps/sequencing/interpreting-intronic-and-antisense-reads-in-10-x-genomics-single-cell-gene-expression-data
- 17.Full-length. RNA-seq from single cells using Smart-seq2 | nature protocols. https://www.nature.com/articles/nprot.2014.006#Abs1 [DOI] [PubMed]
- 18.MacParland SA, et al. Single cell RNA sequencing of human liver reveals distinct intrahepatic macrophage populations. Nat Commun. 2018;9:4383. [DOI] [PMC free article] [PubMed] [Google Scholar]
- 19.Lukowski SW, et al. A single-cell transcriptome atlas of the adult human retina. EMBO J. 2019;38:e100811. [DOI] [PMC free article] [PubMed] [Google Scholar]
- 20.Novella-Rausell C, Grudniewska M, Peters DJM, Mahfouz A. A comprehensive mouse kidney atlas enables rare cell population characterization and robust marker discovery. iScience. 2023;26:106877. [DOI] [PMC free article] [PubMed] [Google Scholar]
- 21.Tabula Muris Consortium. A single-cell transcriptomic atlas characterizes ageing tissues in the mouse. Nature. 2020;583:590–5. [DOI] [PMC free article] [PubMed] [Google Scholar]
- 22.Hao Y, et al. Integrated analysis of multimodal single-cell data. Cell. 2021;184:3573–e358729. [DOI] [PMC free article] [PubMed] [Google Scholar]
- 23.Dobin A, et al. STAR: ultrafast universal RNA-seq aligner. Bioinformatics. 2013;29:15–21. [DOI] [PMC free article] [PubMed] [Google Scholar]
- 24.Anders S, Pyl PT, Huber W. HTSeq—a Python framework to work with high-throughput sequencing data. Bioinformatics. 2015;31:166–9. [DOI] [PMC free article] [PubMed] [Google Scholar]
- 25.García-Alcalde F, et al. Qualimap: evaluating next-generation sequencing alignment data. Bioinformatics. 2012;28:2678–9. [DOI] [PubMed] [Google Scholar]
- 26.Wickham H. Ggplot2: elegant graphics for data analysis. New York: Springer-; 2016. [Google Scholar]
- 27.Marsh S, Salmon M, Hoffman P. scCustomize: custom visualizations & functions for streamlined analyses of single cell sequencing. Zenodo. 2023. 10.5281/zenodo.8169188. [Google Scholar]
- 28.Clarke ZA, Bader GD. MALAT1 expression indicates cell quality in single-cell RNA sequencing data. 2024.07.14.603469 Preprint at 10.1101/2024.07.14.603469 (2024).
- 29.Ascensión AM, Araúzo-Bravo MJ, Izeta A. The need to reassess single-cell RNA sequencing datasets: the importance of biological sample processing. F1000Research. 2022;10:767. [DOI] [PMC free article] [PubMed] [Google Scholar]
- 30.Marsh SE, et al. Dissection of artifactual and confounding glial signatures by single-cell sequencing of mouse and human brain. Nat Neurosci. 2022;25:306–16. [DOI] [PMC free article] [PubMed] [Google Scholar]
- 31.van den Brink SC, et al. Single-cell sequencing reveals dissociation-induced gene expression in tissue subpopulations. Nat Methods. 2017;14:935–6. [DOI] [PubMed] [Google Scholar]
- 32.Janssen P, et al. The effect of background noise and its removal on the analysis of single-cell expression data. Genome Biol. 2023;24:140. [DOI] [PMC free article] [PubMed] [Google Scholar]
- 33.Oh J-M, et al. Comparison of cell type distribution between single-cell and single-nucleus RNA sequencing: enrichment of adherent cell types in single-nucleus RNA sequencing. Exp Mol Med. 2022;54:2128–34. [DOI] [PMC free article] [PubMed] [Google Scholar]
- 34.La Manno G, et al. RNA velocity of single cells. Nature. 2018;560:494–8. [DOI] [PMC free article] [PubMed] [Google Scholar]
- 35.Bergen V, Lange M, Peidli S, Wolf FA, Theis FJ. Generalizing RNA velocity to transient cell states through dynamical modeling. Nat Biotechnol. 2020;38:1408–14. [DOI] [PubMed] [Google Scholar]
- 36.Neuschulz A, et al. A single-cell RNA labeling strategy for measuring stress response upon tissue dissociation. Mol Syst Biol. 2023;19:e11147. [DOI] [PMC free article] [PubMed] [Google Scholar]
- 37.Jiménez-Gracia L, et al. FixNCut: single-cell genomics through reversible tissue fixation and dissociation. Genome Biol. 2024;25:81. [DOI] [PMC free article] [PubMed] [Google Scholar]
- 38.Cui H, et al. scGPT: toward building a foundation model for single-cell multi-omics using generative AI. Nat Methods. 2024;1–11. 10.1038/s41592-024-02201-0. [DOI] [PubMed]
Associated Data
This section collects any data citations, data availability statements, or supplementary materials included in this article.
Supplementary Materials
Data Availability Statement
All single-cell and single-nuclei RNA-seq datasets used in this study are publicly available from different sources as described in Materials and Methods. The R and Python scripts used in this study can be found at https://github.com/funcgen/single_cell_atlases_quality_assessment.


