

Abstract
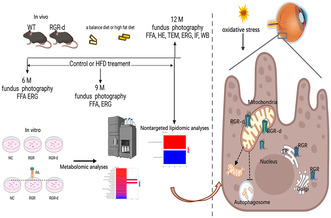
The intake of high dietary fat has been correlated with the progression of age‐related macular degeneration (AMD), affecting the function of the retinal pigment epithelium through oxidative stress. A high‐fat diet (HFD) can lead to lipid metabolism disorders, excessive production of circulating free fatty acids, and systemic inflammation by aggravating the degree of oxidative stress. Deletion of the retinal G‐protein‐coupled receptor (RGR‐d) has been identified in drusen. In this study, we investigated how the RGR‐d exacerbates AMD‐like changes under oxidative stress, both in vivo and in vitro. Fundus atrophy became evident, at 12 months old, particularly in the RGR‐d + HFD group, and fluorescence angiography revealed narrower retinal vessels and a reduced perfusion area in the peripheral retina. Although rod electroretinography revealed decreasing trends in the a‐ and b‐wave amplitudes in the RGR‐d + HFD group at 12 months, the changes were not statistically significant. Mice in the RGR‐d + HFD group showed a significantly thinner and more fragile retinal morphology than those in the WT + HFD group, with disordered and discontinuous pigment distribution in the RGR‐d + HFD mice. Transmission electron microscopy revealed a thickened Bruch's membrane along the choriocapillaris endothelial cell wall in the RGR‐d + HFD mice, and the outer nuclear layer structure appeared disorganized, with reduced nuclear density. Kyoto Encyclopedia of Genes and Genomes pathway analysis indicated significantly lower levels of 25(OH)‐vitamin D3 metabolites in the RGR‐d + HFD group. Under oxidative stress, RGR‐d localized to the mitochondria and reduced the levels of the PINK1–parkin pathway. RGR‐d mice fed an HFD were used as a new animal model of dry AMD. Under high‐fat‐induced oxidative stress, RGR‐d accumulated in the mitochondria, disrupting normal mitophagy and causing cellular damage, thus exacerbating AMD‐like changes both in vivo and in vitro.
Keywords: AMD, metabolomic, mitochondria, mitophagy, RGR‐d
Mice on a balanced diet or high‐fat diet were studied. At 12 months, fundus photography, fluorescein angiography, H&E staining, and transmission electron microscopy revealed retinal changes. Electroretinography assessed retinal function. ARPE‐19 cells were transfected with lentivirus carrying human RGR and RGR‐d genes. KEGG pathway analysis linked neurodegenerative signaling pathways to AMD‐like progression. Accumulated RGR‐d protein disrupts mitophagy and causes cellular damage. RGR‐d mice on HFD provide a new model for dry AMD, showing mitochondrial damage and aggravated AMD‐like features.
Abbreviations
- ADP
adenosine diphosphate
- AMD
age‐related macular degeneration
- BRB
blood–retina barrier
- DAPI
4‘,6‐diamidino‐2‐phenylindole
- ERG
electroretinography
- GCL
ganglion cell layer
- H&E
hematoxylin and eosin
- HFD
high‐fat diet
- HMDB
Human Metabolome Database
- INL
inner nuclear layer
- IPL
inner plexiform layer
- IS/OS
inner and outer segment
- KEGG
Kyoto Encyclopedia of Genes and Genomes
- MS
metabolite extraction and mass spectrometry
- NC
normal control
- ONL
outer nuclear layer
- OPL
outer plexiform layer
- PA
palmitic acid
- PBS
phosphate‐buffered saline
- POS
photoreceptor outer segment
- RGR
retinal G‐protein‐coupled receptor
- RGR‐d
retinal G‐protein‐coupled receptor
- RN
retinal neuroepithelium
- ROS
reactive oxygen species
- RPE
retinal pigment epithelium
- UHPLC–MS
ultra‐high‐performance liquid chromatography–MS
- WT
wild‐type
- ZO‐1
zonula occludens 1
1. INTRODUCTION
Age‐related macular degeneration (AMD) is a prevalent condition among the elderly, and its significance as a public health concern continues to grow in our aging populations. 1 As individuals grow older, oxidative‐stress‐induced damage gradually accumulates in several components of the eye, including the photoreceptors, the retinal pigment epithelium (RPE), Bruch's membrane, and the choriocapillaris. 2 A notable event in the early stage of AMD is the accumulation of lipofuscin in RPE cells, which leads to abnormalities in the deposition of the extracellular matrix and the disruption of cellular functions. 3 With increasing RPE dysfunction, lipid‐rich debris forms between the RPE basal lamina and the inner collagenous layer of Bruch's membrane, resulting in optical accumulations known as drusen—an important hallmark of AMD. 4 Complement activation is also believed to contribute to the loss of endothelial cells in the choriocapillaris, leading to its degeneration. 5 , 6 This loss of the choriocapillaris exacerbates oxidative damage to the overlying RPE and the outer retinal structures, triggers inflammation, and ultimately contributes to AMD. 2 This pathophysiological cascade culminates in the death of the photoreceptor cells. 7 Late‐stage AMD is commonly categorized as either geographic atrophy (referred to as “dry AMD”) or choroidal neovascularization (known as “wet AMD”).
The retina is a metabolically active tissue, and its activity is correlated with high dietary fat intake, elevated cholesterol levels, and the development and progression of dry AMD, as suggested in epidemiological studies. 8 , 9 Aging is accompanied by physiological changes in cholesterol metabolism and increased oxidative stress, both of which affect RPE function. 10 Previous research has indicated a potential link between hyperlipidemia and the development of AMD. 11 Elevated levels of total cholesterol in early middle age may play a role in the initial stages of AMD pathogenesis. 12 , 13 Disturbances in lipid metabolism can exacerbate oxidative stress and contribute to various diseases. In addition to these factors, researches have uncovered a fascinating finding involving the human gene responsible for encoding retinal G‐protein‐coupled receptor (RGR). 14 , 15 This gene produces a splice variant called G‐protein‐coupled receptor deletion (RGR‐d), consistently detected in both small and large drusen. 16 Notably, older mice with the RGR‐d variant showed a progressive ocular pathology characterized by degenerative changes in various retinal structures, including the photoreceptors, RPE, and choriocapillaris—similar to the defects observed in dry AMD. 16 In this study, we fed mice a high‐fat diet (HFD) and investigated the role of RGR‐d in exacerbating AMD‐like changes under oxidative stress.
2. MATERIALS AND METHODS
2.1. Ethics and animals
The study was conducted in compliance with the guidelines outlined in the Association for Research in Vision and Ophthalmology's Statement on the Use of Animals in Research. Approval for all animal experiments was obtained from the Institutional Animal Care and Use Committee of Peking University People's Hospital, Beijing, China. The mice were housed in a controlled environment on a 12‐h light/12‐h dark cycle at a temperature of 22–24°C, with ad libitum access to food and water. Wild‐type (WT) mice and homozygous RGR‐d mutant mice were included in the study. The RGR‐d mutant mice were generated by mutating the splice site at each end of exon VI of the mouse Rgr gene. 16 RGR‐d and WT mice were crossbred to obtain heterozygotes, which were then bred to generate RGR‐d homozygous mice. Fundus photography and fluoroscopy were performed to observe the fundus in the mice at 6 months of age. The mice were then divided into four groups: WT mice fed a balanced diet (WT group); WT mice fed an HFD (20% carbohydrate, 20% protein, 60% fat; #D12492, Research Diets Inc. Wuxi, China) (WT + HFD group); RGR‐d mice fed a balanced diet (RGR‐d group); and RGR‐d mice fed an HFD (RGR‐d + HFD group). All mice were maintained on their respective diets for 3 and 6 months, and their phenotypes were observed at 9 and 12 months of age (Figure 1A) and the nontargeted lipidomic analysis of mice at 12 months of age.
FIGURE 1.
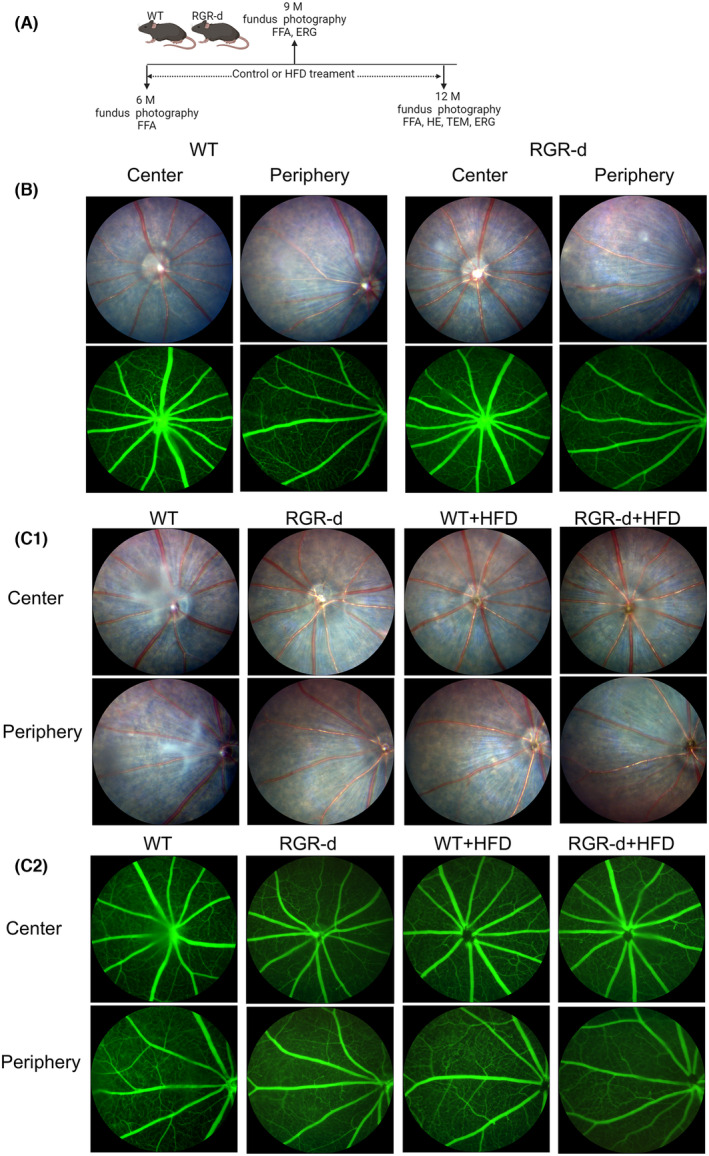
Summary of treatment and fundus examination in the animal groups. (A) Summary of the animal groups and treatment procedures. (B) Representative fundus imaging and fluorescein angiography of the central and peripheral regions in WT and RGR‐d mice at 6 months of age. (C) Representative fundus imaging (C1) and fluorescein angiography (C2) of the central and peripheral regions in the WT, RGR‐d, WT + HFD, and RGR‐d + HFD groups at 9 months of age.
2.2. Fundus photography and fundus fluorescein angiography
The mice were anesthetized with an intraperitoneal injection of 1.25% tribromoethyl alcohol, and their pupils were dilated with three applications of tropicamide phenylephrine eye drops (Santen Pharmaceuticals Co., Ltd., Osaka, Japan) administered at 5‐min intervals. Carbomer ophthalmic gel (Bausch & Lomb, Rochester, NY, USA) was applied to coat the cornea. To capture clear fundus photographs, the microscope lens of a small‐animal fundus imaging system (OPTO‐RIS, Optoprobe Science Ltd., UK) was gently adjusted to touch the cornea. Before fundus fluorescein angiography, the mice received an intraperitoneal injection of 1.7 mL/kg 2% fluorescein sodium. The retinal vasculature analysis was performed with AngioTool software. Mean E lacunarity inferred to mean lacunarity over all size boxes.
2.3. Electroretinography
The retinal function of mice in each group was evaluated with full‐field electroretinography (ERG; RETIport, Roland Consult, Brandenburg an der Havel, Germany). Before the procedure, the mice were dark‐adapted and anesthetized. Illumination was provided by a red light (>650 nm), and tropicamide phenylephrine eye drops (Santen Pharmaceuticals Co., Ltd.) were used for pupil dilation. The platinum ring electrodes were carefully positioned on the corneal surface, and subdermal grounding electrodes were placed. Rod‐ERG was recorded with a 5 cd s/m2 background white light. The stimulus parameters included a single pulse flash of 0.015 cd s/m2, a 1 Hz frequency, and 8 repetitions. Max‐ERG (maximal response ERG), which represents the combined response of both cone and rod systems from dark‐adapted eyes, was recorded with a 600 cd s/m2 background white light, a single pulse flash of 3.0 cd s/m2, a 1 Hz frequency, and 8 repetitions. Following 5 min of photopic adaptation (50 cd s/m2), cone‐ERG and flicker‐ERG were recorded separately. Cone‐ERG was recorded under 600 cd s/m2 background light with a single pulse flash of 3 cd s/m2, a 1 Hz frequency, and 8 repetitions. Flicker‐ERG used a 600 cd s/m2 background light with a continuous pulse flash of 3.0 cd s/m2, a 20 Hz frequency, and 16 repetitions. The a‐ and b‐wave amplitudes were recorded. The amplitude of the a‐waves was measured from baseline to the troughs of the a‐wave. The a‐wave is characterized by a negative deflection; in the amplitude plot, its axis represents negative values. A decrease in a‐wave amplitude is manifested by a reduction in the absolute value of the a‐wave amplitude. The negative sign on the ordinate indicates the direction of the a‐wave. Closer proximity to zero on the negative axis indicates positions displayed nearer to the horizontal axis in the graph. And the ERG a‐wave originates from photoreceptor cells. The b‐wave, which reflects the activity of the inner retina, was measured from the base of the negative a‐wave to the peak of the b‐wave. Quantitative results were derived as the averages of six independent experiments.
2.4. Retinal morphological changes
The eyes were cleaned, washed three times with phosphate‐buffered saline (PBS), and fixed in 10% paraformaldehyde. The retinal tissues were then dehydrated in a gradient of ethanol, cleared in xylene, embedded in paraffin wax, and sectioned with a microtome into 5‐μm‐thick slices crossing the optic nerve. The sections were stained with hematoxylin and eosin (H&E), and images were captured with an OLYMPUS BX41 microscope (Tokyo, Japan). For transmission electron microscopy (TEM), the eyes were fixed in 2.5% glutaraldehyde, the anterior segment was removed, and the eyecups were dehydrated in acetone solutions (50%, 70%, and 100% for 10 min × 3). After dehydration, the samples were gradually infiltrated with a mixture of Spurr embedding agent and acetone and then incubated with pure Spurr overnight at room temperature. Sagittal sections were prepared and imaged by TEM (JEM‐1400PLUS, JEOL, Tokyo, Japan).
2.5. Immunofluorescence and MitoTracker Red staining
Paraffin sections of retinal tissues (5 μm thick) were deparaffinized with xylene and ethanol. The sections were rinsed twice with PBS and incubated at 37°C for 1 h in a blocking buffer containing 0.3% Triton X‐100 and 3% goat serum. The sections were then incubated overnight incubation at 4°C with the primary rabbit monoclonal antibody (mAb) directed against CD31 (PECAM‐1) (#77699, Cell Signaling Technology). After washing the sections with PBS, they were incubated with the secondary antibody (goat anti‐rabbit IgG H&L [Alexa Fluor® 555], ab150078, Abcam, Cambridge, UK) at room temperature for 60 min, and then counterstained with 4′,6‐diamidino‐2‐phenylindole (DAPI; Sigma‐Aldrich, St. Louis, MO, USA) for 15 min. The retinal tissues were visualized with a Leica TCS SP8 WLL confocal microscope (Leica Microsystems). To label zonula occludens 1 (ZO‐1) immunofluorescently, the RPE–Bruch's membrane–choriocapillaris complex was fixed with 4% paraformaldehyde for 30 min and incubated with a blocking buffer. It was then incubated overnight at 4°C with the primary antibody, ZO‐1 polyclonal antibody (40‐2200, Thermo Fisher Scientific). The sections were then incubated with the secondary antibody (goat anti‐rabbit IgG H&L [Alexa Fluor® 488]; Abcam) and visualized with a laser confocal microscope (Leica Microsystems).
The cells subjected to experimental treatment were cultured in a 24‐well plate. The mitochondria were stained with Mito‐Tracker Deep Red FM (C1032, Beyotime Biotechnology, Beijing, China). Prewarmed staining solution containing MitoTracker Red (400 nM) was applied to the cells in the 24‐well plate, and incubated for 30 min under standard growth conditions in the dark. The cells were then rinsed with PBS and fixed for 15 min. Following fixation, they were rinsed with PBS and blocked at 37°C for 1 h with a blocking buffer consisting of 0.1% Triton X‐100 and 3% goat serum. The primary antibody, Anti‐DDDDK tag (Binds to FLAG® tag sequence) antibody [EPR20018‐251] (ab205606, Abcam), was applied and the samples were incubated overnight at 4°C. The sections were then treated with the secondary antibody (goat anti‐rabbit IgG H&L) (Alexa Fluor® 488) (ab150077, Abcam). MitoTracker Red shows approximate excitation and emission peaks at 579 and 599 nm, respectively.
For immunofluorescence staining of the ER marker (calnexin) and Golgi marker (GM130), cells were plated on coverslips in 24‐well plates. Following stimulation, ARPE‐19 cells were washed twice with PBS and fixed with 4% paraformaldehyde for 15 min. After fixation, the cells were incubated with a blocking buffer and then with the primary antibody overnight at 4°C (Anti‐DDDDK tag (binds to FLAG® tag sequence), diluted 1:200; ab205606, Abcam). They were co‐stained with ER and Golgi markers using Anti‐Calnexin antibody (ER marker, diluted 1:100; ab22595, Abcam) and Anti‐GM130 antibody [EP892Y] (Golgi marker, diluted 1:100; ab52649, Abcam). Following PBS washes, cells were incubated with secondary antibodies Goat Anti‐Mouse IgG H&L (Alexa Fluor® 488) (ab150133, Abcam) and Goat Anti‐Rabbit IgG H&L (Alexa Fluor® 647) (ab150079, Abcam), and counterstained with DAPI (Sigma‐Aldrich). Observations were made using a laser confocal microscope (Leica Microsystems).
2.6. In vitro experiments
A human retinal pigment epithelium cell line, ARPE‐19, was purchased from the cell bank of the Chinese Academy of Sciences, Shanghai, China, and used within passages 2–10. The ARPE‐19 cells were cultured in DMEM/F12 medium (lot 2235277, Gibco, Carlsbad, CA, USA) supplemented with 10% fetal bovine serum (FBS; lot 42F0282K, Gibco) and 1% streptomycin–penicillin. The cells were transferred to a six‐well cell culture plate and maintained at 37°C in a 5% CO2 environment. When the cells were approximately 30% confluent, they were transfected with lentivirus‐control, lentivirus‐CMV‐MCS‐RGR‐3FLAG‐SV40‐puromycin, and lentivirus‐CMV‐MCS‐RGR‐d‐3FLAG‐SV40‐puromycin (Shanghai Genechem Co., Ltd., Shanghai, China) (multiplicity of infection (MOI) = 5). Once the cells reached 80% confluence, puromycin solutions (2 μg/mL, 2 weeks) were used to select stable expression cell lines. Stable transformants of ARPE‐19 expressing RGR or RGR‐d, and normal control (NC) cells were cultured for the next in vitro experiment. The lentivirus control serves as an empty lentiviral vector for the normal control group. As a result of being transfected with this empty lentiviral vector, the normal control group does not express Flag. MG‐132, a proteasome inhibitor (ab141003, Abcam, Cambridge, UK) was used to block the degradation and induces an accumulation of the overexpressed protein. In this study, ARPE‐19 cells were treated with 2 μM MG‐132 for 24 h. The transcription and expression levels of RGR and RGR‐d using qPCR and Western blot analyses, as shown in Figure S1. Palmitic acid (PA; catalog no. P5585, Sigma‐Aldrich, St. Louis, MO, USA) was initially dissolved in dimethyl sulfoxide and subsequently added to complete cell culture growth medium containing 5% bovine serum albumin (catalog no. A8806, Sigma‐Aldrich) to achieve a final concentration of 0.2 mM. This preparation was designed to simulate the increased oxidative stress associated with early AMD. After 24 h, the cells were ready for subsequent experiments.
2.7. Nontargeted lipidomic and metabolomic analyses with LC–MS/MS
Metabolite extraction and mass spectrometry (MS) detection were performed with ultra‐high‐performance liquid chromatography–MS (UHPLC–MS) at Berry Genomics Corporation (Beijing, China). The LC–MS/MS system used for the metabolomic analysis consisted of an Acquity UPLC I‐Class PLUS ultra‐high‐performance liquid chromatograph (Waters) in tandem with a Xevo G2‐XS QTof high‐resolution mass spectrometer (Waters). A Waters Acquity UPLC CSH C18 Column (1.7 μm 2.1 × 100 mm) was used for chromatographic separation. The Xevo G2‐XS QTof high‐resolution mass spectrometer allowed the collection of primary and secondary MS data in MSe mode, under the control of the acquisition software MassLynx V4.2 (Waters). Each data acquisition cycle involved dual‐channel acquisition, with simultaneous low‐collision‐energy and high‐collision‐energy scans. The low collision energy was set to 2 V, and the high collision energy was in the range of 10–40 V, with a scanning frequency of 0.2 s per mass spectrum. The raw data collected with MassLynx V4.2 were processed using Progenesis QI software, which allowed peak extraction, alignment, and other data processing operations. Compound identification was based on the Progenesis QI software online METLIN database and Biomark's self‐built library, ensuring theoretical fragment identification, with mass deviation within 100 ppm. The compounds identified were cross‐referenced for classification and pathway information with the Kyoto Encyclopedia of Genes and Genomes (KEGG), Human Metabolome Database (HMDB), and Lipid Maps databases. Based on the grouping information, differential multiples were calculated and compared with a t test, which calculated the significance (p value) for each compound. The screening criteria included fold change (FC) > 1, p < .05, and variable importance in the projection (VIP) > 1. The significance of the differential metabolic pathways was calculated with the hypergeometric distribution test.
2.8. Measurement of vitamin D levels
The retinal neuroepithelium or RPE–Bruch's membrane–choriocapillaris complex was extracted from the mouse eyeballs and suspended in lysis buffer (Thermo Fisher Scientific, 89900). After ultrasonication and centrifugation, the vitamin D content was measured in the resulting supernatants. The cell culture supernatants were also collected. The levels of 25‐hydroxy (25[OH])‐vitamin D3 in the supernatants were measured using an enzyme‐linked immunosorbent assay (ELISA) (ab213966, Abcam).
2.9. Western blotting
For western blotting, samples were collected and suspended in lysis buffer (Thermo Fisher Scientific, 89900) containing Pierce Protease and Phosphatase Inhibitor Mini Tablets (Thermo Fisher Scientific, A32959). After ultrasonication and centrifugation, the supernatant was mixed with a loading buffer (Thermo Fisher Scientific, NP0007) to denature the proteins. The protein concentrations were determined with the BCA Protein Assay Kit (Beyotime Biotechnology), and sodium dodecyl sulfate–polyacrylamide gel electrophoresis (Thermo Fisher Scientific, NP0301) was used to separate the protein. The proteins were then transferred to polyvinylidene difluoride membranes (Millipore), which were blocked with Intercept® Blocking Buffer (LI‐COR) for 1 h and incubated with the primary antibody overnight. The membranes were then washed and incubated with the secondary antibody for 1 h at room temperature. The primary antibodies were PINK1 polyclonal antibody (23274‐1‐AP, Proteintech Group, Inc., USA) and PARK2/Parkin polyclonal antibody (14060‐1‐AP, Proteintech Group, Inc.), and anti‐LC3 rabbit mAb (#4108), anti‐beclin 1 (D40C5) anti‐rabbit mAb (#3495), anti‐ATG5 rabbit mAb (#12994), rabbit anti‐SQSTM1/P62 mAb (#39749), rabbit anti‐CD31 (PECAM1) mAb (#77699), and anti‐β actin antibody (#4967) purchased from Cell Signaling Technology, and ZO‐1 polyclonal antibody (40‐2200, Thermo Fisher Scientific). The immunoblots were visualized and quantified with the Odyssey CLx Infrared Imaging System (LI‐COR).
2.10. Statistical analysis
The data were analyzed with GraphPad Prism 8 (Dotmatics, Boston, MA, USA). Student's two‐tailed t test was used to compare differences between the two groups. The one‐way or two‐way ANOVA statistic tests were used to compare differences among three or more groups. Representative images are presented, and the quantitative results are mean values derived from 3 to 6 independent experiments. Statistical significance was defined as p < .05.
3. RESULTS
3.1. RGR‐d mice displayed more severe HFD‐induced fundus atrophy
Fundus photography and fluorescein angiography revealed the fundus was normal in 6‐month‐old WT and RGR‐d mice (Figure 1A,B), and there were no obvious changes in the fundus of the WT and RGR‐d mice fed with HFD at 9 months old (Figure 1C). However, fundus atrophy became evident, particularly in the RGR‐d + HFD group, at 12 months of age (Figure 2). Unlike the WT mice, mild vitreous opacities and concentration were observed in the WT + HFD group, together with the appearance of irregular pigmentary abnormalities. Dot‐like atrophy was visible in the peripheral retina of 12‐month‐old RGR‐d mice (Figure 2A), but not in age‐matched control mice with a normal fundus.
FIGURE 2.
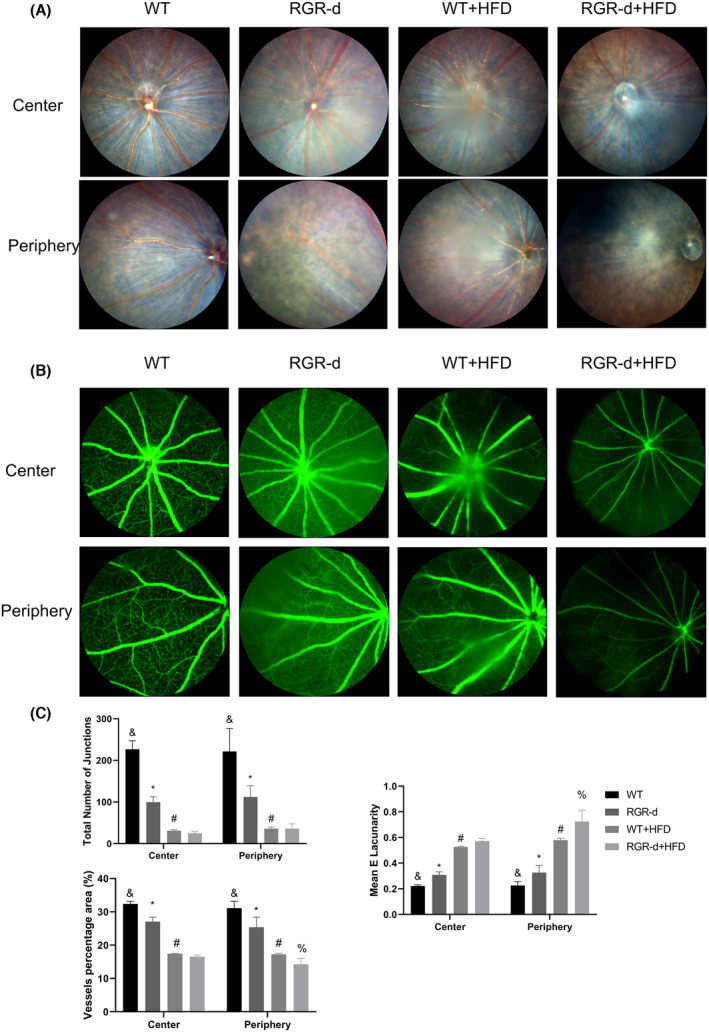
Fundus examination in each group at 12 months of age. (A) Representative fundus imaging of the central and peripheral regions in the WT, RGR‐d, WT + HFD, and RGR‐d + HFD groups at 12 months of age. Fundus atrophy became evident in the RGR‐d + HFD group, particularly at the periphery. (B) Representative fluorescein angiography of the central and peripheral regions in the WT, RGR‐d, WT + HFD, and RGR‐d + HFD groups at 12 months of age. (C) AngioTool analysis of retinal vasculature in central and peripheral regions. & p < .05 for RGR‐d versus WT; *p < .05 for RGR‐d versus RGR‐d + HFD; # p < .05 for WT + HFD versus WT; % p < .05 for WT + HFD versus RGR‐d + HFD. n = 3 biological repeats in each group.
In the WT + HFD group, fluorescence angiography revealed reduced retinal capillary filling, and a less extensive mid‐peripheral capillary network (Figure 2B). Notably, the RGR‐d + HFD group showed more pronounced patchy atrophy of the fundus in the central or peripheral retina, narrower retinal vessels, and a reduced perfusion area in the peripheral retina (Figure 2A,B). Analysis of the retinal vasculature of the peripheral regions indicated that the percentage area (%) of the vessels was significantly reduced in the RGR‐d + HFD group compared with that in the WT + HFD group. The mean E lacunarity was significantly greater in the peripheral regions in the RGR‐d + HFD than in the WT + HFD group (Figure 2C). We also observed pigmented keratic precipitates, peripheral pupil adhesion, and mild cataract in the RGR‐d + HFD group (Figure S2). Overall, these findings suggest that AMD‐like defects in the fundus were present in the 12‐month‐old RGR‐d mice and that HFD exacerbated their progression.
3.2. Assessment of retinal function in each group using full‐field ERG
Full‐field flash ERG was performed to evaluate the retinal function of mice. The ERG results for WT and RGR‐d at 6 months of age are shown in Figure S3. No significant difference in retinal function was observed between the WT and RGR‐d groups at this age. The retinal function for each group at 9 and 12 months is displayed in Figure 3. In the WT and RGR‐d mice, the amplitude of the a‐wave on cone ERG was smaller at 12 months than at 9 months. Representative rod ERG and cone ERG images at 12 months were recorded sequentially. Rod ERG revealed decreasing trends in the a‐ and b‐wave amplitudes in the RGR‐d + HFD group at 12 months (Figure A1–A3), but the trend was not significant. Cone ERG (Figure 3B) revealed no significant differences were detected in the a‐wave amplitudes among these four groups, but the b‐wave amplitude was smaller in the RGR‐d + HFD group than in the WT + HFD group (56.17 ± 25.01 and 28.55 ± 14.14 μV, respectively; p < .05) at 12 months of age. On maximum ERG (Figure 3C), the RGR‐d + HFD group had an average a‐wave amplitude of −101.85 μV, while the RGR‐d group had an average amplitude of −47.53 μV. The a‐wave, characterized by a negative deflection, is plotted with negative values on the amplitude axis. Thus, the maximum ERG results indicate that the a‐wave amplitude was significantly smaller in the RGR‐d + HFD group compared to the RGR‐d group (−101.85 ± 24.08 vs. −47.53 ± 17.37 μV, respectively; p < .05) at 12 months of age. The b‐wave amplitude of maximum ERG (Figure 3C3) and the amplitude of flicker ERG (Figure 3D) did not differ significantly between the groups at 12 months. Overall Figure 3 shows a decreasing trend in a‐wave amplitude which represents the damage of cone and rod in RGR‐d + HFD group and a decreasing trend in the b‐wave amplitude at 12 months in the different groups which represents bipolar cells in RGR‐d + HFD group. Therefore, HFD induced retinal dysfunction in the RGR‐d mice.
FIGURE 3.
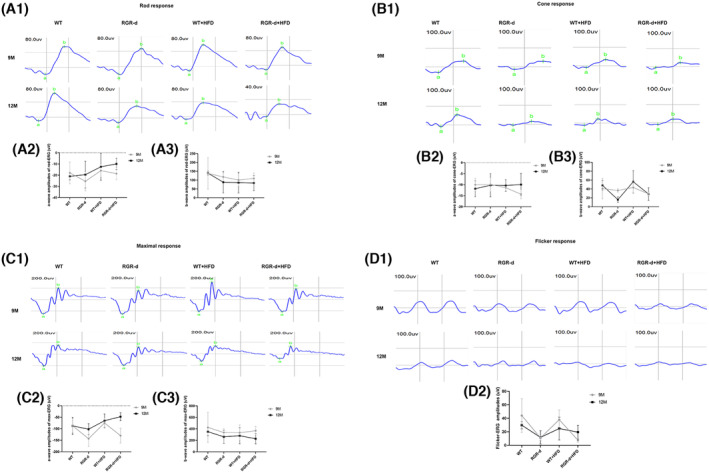
Retinal function assessment by full‐field ERG at 9 and 12 months of age. (A1–D1) Representative images of rod‐ERG, cone‐ERG, max‐ERG, and flicker‐ERG in each group at 9 and 12 months of age. (A2–C2) Statistical analysis of a‐wave amplitudes on rod ERG, cone ERG, and max ERG. (A3–C3) Statistical analysis of b‐wave amplitudes on rod ERG, cone ERG, and max ERG. (D2) Statistical analysis of the flicker ERG amplitudes. Data are means ± SD, n = 6 biological repeats in each group.
3.3. Characterization of the histological and ultrastructural changes in the retinas of 12‐month‐old mice
Histological analysis with H&E staining was performed to examine the structural changes in the retinas of the four groups. Figure 4A,B compare the thicknesses of the retinal neuroepithelium (RN) in the central and peripheral regions among the four groups. Remarkably, the mice in the RGR‐d + HFD group showed a significantly thinner and more fragile retinal morphology than those in the WT + HFD group (Figure 4A3,A4). The RN was thinner in the RGR‐d and WT + HFD groups than in the WT group (Figure 4A1–A3). To further clarify these findings, we quantified the thickness of each retinal layer (Figure 4C). There were notable reductions in the inner plexiform layer (IPL), inner nuclear layer (INL), outer plexiform layer (OPL), and outer nuclear layer (ONL) in the RGR‐d + HFD group relative to those in the WT + HFD group. At higher magnification, a reduction in pigment granules was observed in the RPE layer of the WT + HFD and RGR‐d groups compared with those in the WT group, and the pigment distribution appeared disordered and discontinuous in the RGR‐d + HFD mice (Figure 4A5–A8).
FIGURE 4.
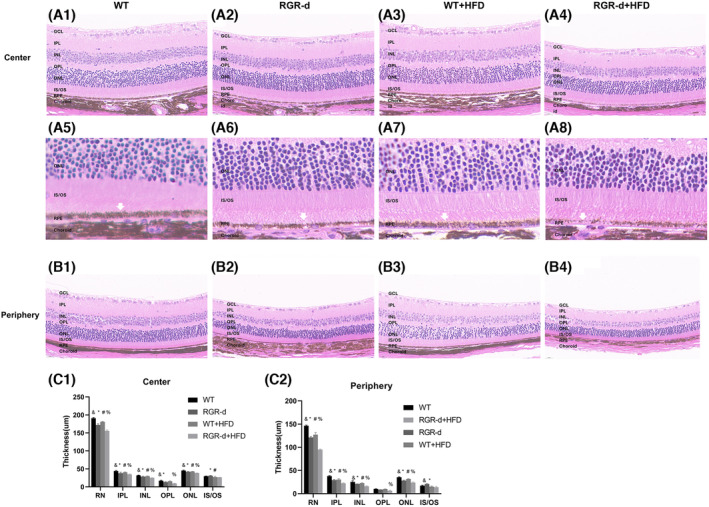
Characterization of the H&E staining. (A, B) H&E staining to visualize the progression of retinal degeneration in the retinal center (A1–A4) and periphery (B1–B4) at 12 months. The RGR‐d + HFD group showed significant thinning of the retinal structure, particularly in the IPL, INL, OPL, and ONL, compared with the WT + HFD group. (A5–A8) Partial enlarged detail of the retina in each group. White arrow: RPE layer. (C) Analysis of the thickness of each retinal layer in each group. GCL, Ganglion cell layer; INL, inner nuclear layer; IPL, inner plexiform layer; IS/OS, inner and outer segment; ONL, outer nuclear layer; OPL, outer plexiform layer. & p < .05 for RGR‐d versus WT; *p < .05 for RGR‐d versus RGR‐d + HFD; # p < .05 for WT + HFD versus WT; % p < .05 for WT + HFD versus RGR‐d + HFD.
AMD is also associated with the loss of endothelial cells in the choriocapillaris, leading to its degeneration. To evaluate the changes in the choriocapillaris in the experimental mice, we immunofluorescently stained it for CD31 (a marker of vascular endothelial differentiation), and observed reduced fluorescence intensity in the RGR‐d + HFD mice (Figure 5A,B). CD31 protein expression was lowest in the RGR‐d + HFD group (Figure 5C). The impact of HFD on the intercellular junctions of the RPE in the WT and RGR‐d mice was also investigated with western blotting and immunofluorescent labeling of ZO‐1. As shown in Figure 4D–G, the tight junctions of the RPE were slightly damaged in the WT + HFD group, whereas disruption of the tight junctions was observed in the RGR‐d + HFD group. Fluorescent signals and ZO‐1 protein levels were reduced in both groups.
FIGURE 5.
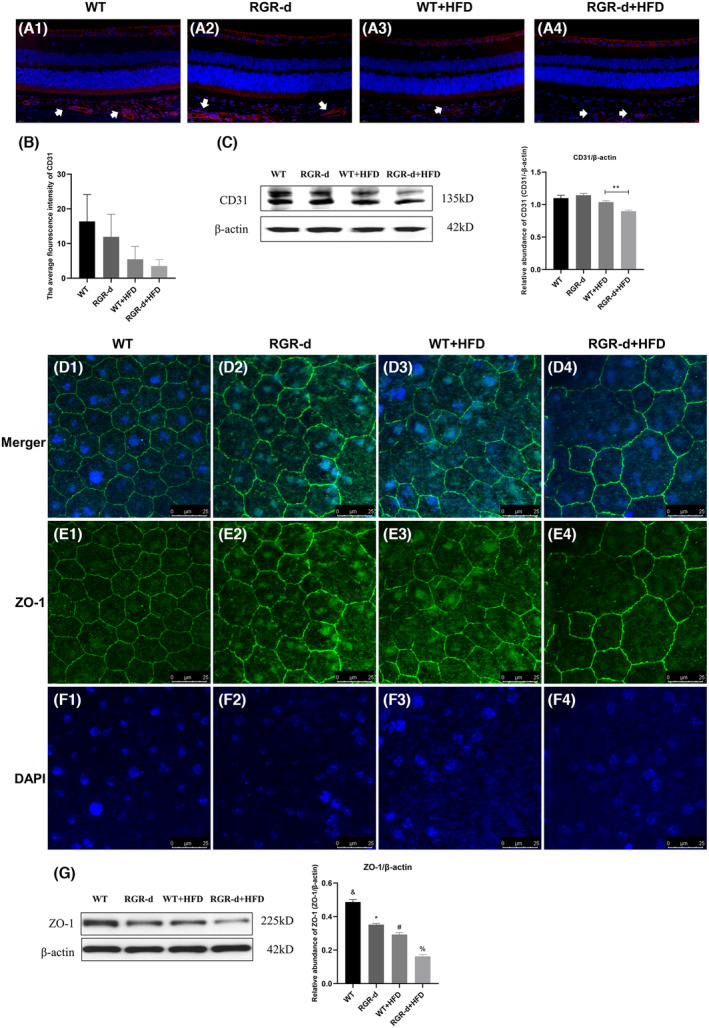
Detection of CD31 and ZO‐1. (A–C) Detection of CD31 protein in each group at 12 months of age. (A1–A4) Representative retinal sections from each group stained for CD31. Red: CD31; blue: 4′,6‐diamidino‐2‐phenylindole (DAPI); white arrow: Choroidal vessels. (B) Statistical analysis of the average fluorescence intensity of CD31 in each group. The intensity was reduced in the RGR‐d + HFD group, but not statistically significantly. (C) Western blotting analysis of CD31 protein levels in the RPE–Bruch's membrane–choriocapillaris complex in each group; **p < .01. (D–G) Immunofluorescent staining of ZO‐1 on RPE flat mounts from each group. ZO‐1 hexagonal grids were well organized in the RPE–choroid flat mounts of the WT mice (D1–F1). In those from the RGR‐d (D2–F2) and WT + HFD mice (D3–F3), they were mildly disordered, whereas irregular disorganization was observed in the RGR‐d + HFD mice (D4–F4). Green: ZO‐1; blue: DAPI. (G) Western blotting analysis of ZO‐1 protein levels in the RPE–Bruch's membrane–choriocapillaris complex in each group. & p < .05 for RGR‐d versus WT; *p < .05 for RGR‐d versus RGR‐d + HFD; # p < .05 for WT + HFD versus WT; % p < .05 for WT + HFD versus RGR‐d + HFD.
TEM was performed to further clarify the ultrastructural characteristics of the RPE–Bruch's membrane–choriocapillaris complex, and examine any morphological abnormalities in the photoreceptors. Abnormalities were detected in Bruch's membrane in all but the WT group. A thickened Bruch's membrane was evident along the choriocapillaris endothelial cell wall in the RGR‐d + HFD mice (Figure 6). The ONL structure in the RGR‐d + HFD mice appeared disorganized, with a reduced nuclear density (Figure S4A). Complete structural disorder of the photoreceptor outer segment (POS) was evident in the WT + HFD and RGR‐d + HFD groups (Figure S4B). At the RPE level, a reduction in the number of pigment particles and abnormal morphology were observed in the RGR‐d + HFD group (Figure S4C). Moreover, diffuse granular deposits protruded from Bruch's membrane into the choroid, and ruptures and discontinuities in Bruch's membrane were visible in the RGR‐d + HFD mice (white arrows in Figure S5). These ultrastructural changes indicate that HFD exacerbates the progression of AMD‐like defects.
FIGURE 6.
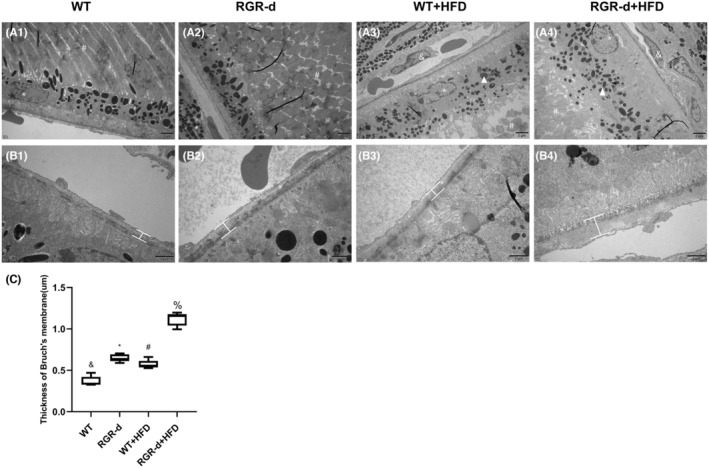
Characterization of the TME in each group at 12 months of age. (A) Ultrastructural changes in the RPE–Bruch's membrane–choriocapillaris complex in each group of mice at 12 months of age. A reduction in the number of pigment particles and abnormal morphology (white arrowheads) were observed in the WT + HFD (A3) and RGR‐d + HFD (A4) groups. *Nuclei of RPE cells; #Photoreceptor outer segment; &Choroidal capillary cells. (B) Amplified Bruch's membrane in each group. Thickening of Bruch's membrane was identified along the choriocapillaris endothelial cell wall in the RGR‐d + HFD mice (B4). (C) Statistical analysis of the average thickness of Bruch's membrane in each group. & p < .05 for RGR‐d versus WT; *p < .05 for RGR‐d versus RGR‐d + HFD; # p < .05 for WT + HFD versus WT; % p < .05 for WT + HFD versus RGR‐d + HFD.
3.4. Biomarkers associated with nontargeted lipidomics
Metabolomics analyses play crucial roles in understanding the mechanisms and discovering biomarkers and drugs for combating human diseases. Over the past decade, untargeted metabolomic analyses have been essential in addressing health challenges and emerging solutions for LC–MS/MS‐based untargeted metabolomics in diseases. Examining the connections between metabolites and AMD should extend our mechanistic understanding of the disease, with potential applications in precision medicine. In this study, we analyzed nontargeted lipidomic data from the retinal neuroepithelium and the RPE–choroid complex in mice.
In our lipidomics analysis of the retinal neuroepithelium, we identified 281 metabolites that were at their highest levels and 548 metabolites that were at their lowest levels in the RGR‐d + HFD group. Similarly, in the RPE–choroid complex, we identified 509 metabolites that were at their highest levels and 657 metabolites that were at their lowest levels of the RGR‐d + HFD group. We fed the mice with an HFD to simulate oxidative stress associated with aging. The KEGG pathway analysis of the RGR‐d + HFD and WT + HFD groups revealed associations with vitamin digestion and absorption, and biosynthesis of ubiquinone and other terpenoid quinones, which were related to the exacerbation of AMD‐like defects (Figure 7A1). Our systematic evaluation of vitamin metabolites identified two vitamin D3 metabolites (1β‐butyl‐1α,25‐dihydroxyvitamin D3 and 1α,25‐dihydroxy‐21‐nor‐20‐oxavitamin D3) that were significantly lower in the RGR‐d + HFD group than in the WT + HFD group (Figure 7A2). To further investigate the changes in vitamin D3 levels among the different groups, we used an ELISA to measure its levels in the RPE–choroid complex in mice and cell supernatants. As shown in Figure 7, the total 25(OH)‐vitamin D3 content was lowest in the retinal neuroepithelium and RPE–choroid complex of the RGR‐d + HFD group (Figure 7A3,A4). Based on the subsequent results from LC–MS/MS metabolomics, we investigated alterations in the PINK1–parkin signaling pathway, which is associated with mitophagy disruption in neurodegenerative diseases, in our experimental mice. The levels of PINK1 and parkin proteins were reduced in the RPE–choroid complex (Figure 8B1–B7) and retinal neuroepithelium (Figure S6) in the RGR‐d + HFD group. Consistent with previous research, the adaptor protein P62, which is involved in parkin‐directed mitophagy, showed a corresponding increase in the RGR‐d + HFD group. A western blotting analysis also indicated the reduced expression of PINK1 and parkin in the WT + HFD and RGR‐d groups, and the upregulation of P62 in both groups. Previous studies have suggested that activated LC3 acts as a reliable marker of completed autophagosomes. Our observations revealed significantly lower LC3II/I ratios in the retinal neuroepithelium and RPE‐choroid complex in the WT + HFD and RGR‐d groups, with the lowest ratio observed in the RGR‐d + HFD group. Beclin 1, one of the initial mammalian autophagy effectors identified, also showed reduced expression in both the retinal neuroepithelium and RPE–choroid complex in the WT + HFD, RGR‐d, and RGR‐d + HFD groups. As previously reported, damaged mitochondria can be eliminated by the canonical autophagy factor, ATG5. We found that the expression of ATG5 mirrored that of beclin 1, with the lowest level observed in the RGR‐d + HFD group.
FIGURE 7.
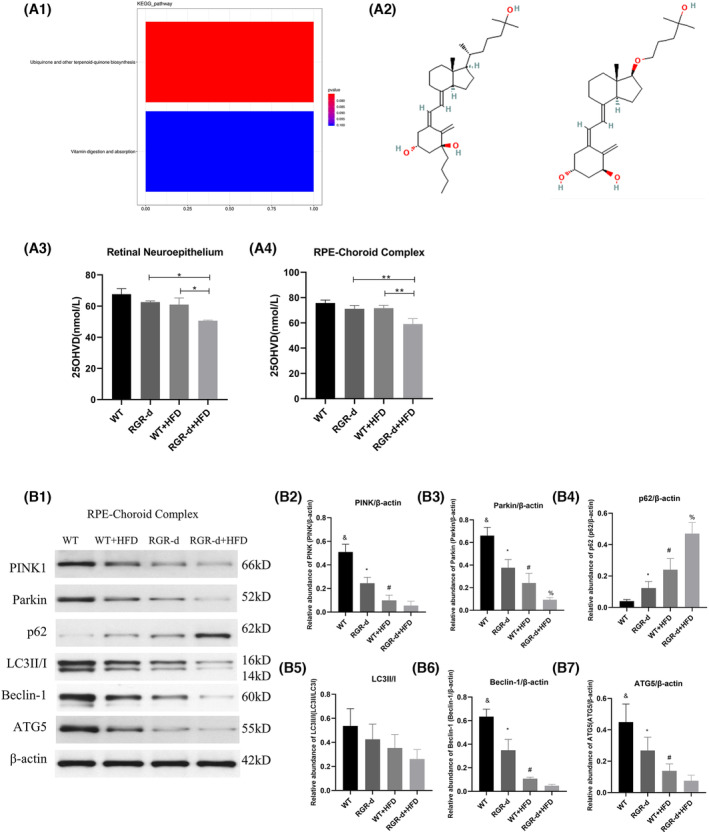
Nontargeted lipidomics revealed differential metabolites in the RGR‐d + HFD mice and WB investigated the activation of the PINK1–parkin signaling pathway. (A1) Bar plot shows the two principal pathways that differed between the WT + HFD group and RGR‐d + HFD group in a nontargeted lipidomic analysis of the RPE‐choroid complex, based on a KEGG pathway analysis. The x‐axis shows the names of the subpathways, and the y‐axis indicates the number of metabolites. (A2) Chemical structures of vitamin D3 metabolites: 1β‐butyl‐1α,25‐dihydroxyvitamin D3 (pos_5249) and 1α,25‐dihydroxy‐21‐nor‐20‐oxavitamin D3 (pos_11614). (A3–A4) Levels of 25(OH)‐vitamin D3 in the retinal neuroepithelium (A3), RPE‐Bruch's membrane‐choriocapillaris complex (A4). *p < .05, **p < .01. (B) Protein levels of PINK1 and parkin in the RPE‐choroid complex of each group of mice at 12 months of age. (B1) Representative western blots of PINK1, parkin, P62, LC3II/I, beclin 1, and ATG5. (B2–B7) Western blotting analyses of PINK1, parkin, P62, LC3II/I, beclin 1, and ATG5. & p < .05 for WT versus RGR‐d; *p < .05 for RGR‐d versus RGR‐d + HFD; # p < .05 for WT + HFD versus WT; % p < .05 for WT + HFD versus RGR‐d + HFD. n = 3 biological repeats in each group.
FIGURE 8.
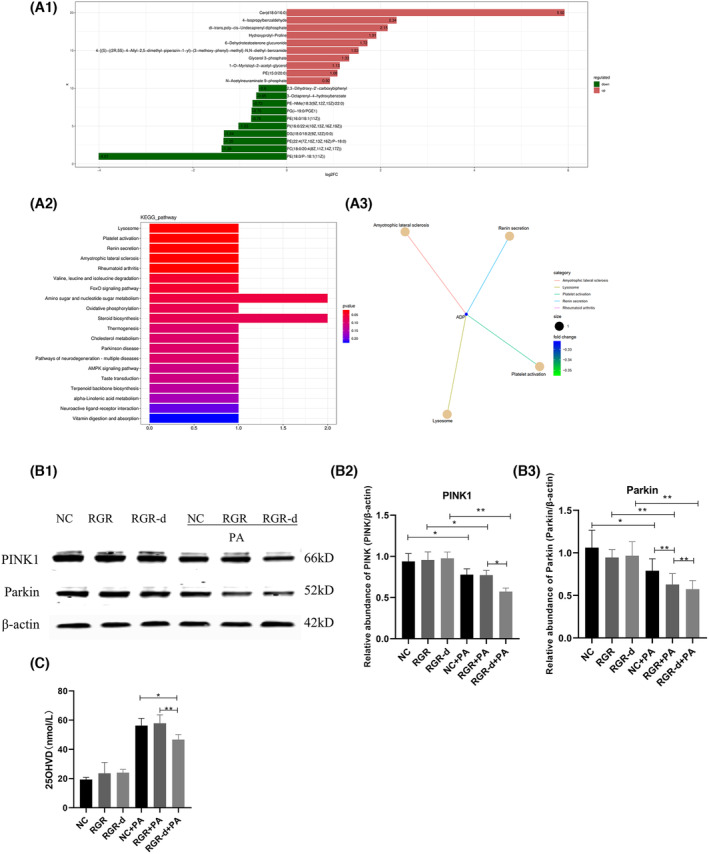
Nontargeted metabolomic analyses in the RGR‐d‐overexpressing cells stimulated with PA and the WB of the PINK1–parkin signaling pathway in cells. (A1) Summary of the top 20 metabolites altered in cells overexpressing RGR‐d protein compared with cells overexpressing RGR protein under PA stimulation. Labels on each column are the names of metabolites, distinguished by upregulation or downregulation. Upregulated metabolites are shown in red and downregulated metabolites in green. Length of the columns indicates log (fold change) (logFC). The top 10 upregulated and top 10 downregulated metabolites with the highest FC are shown. (A2) Bar plot shows the top 20 pathways that differed between the RGR‐d cells and RGR cells under PA stimulation, based on a KEGG pathway analysis. (A3) KEGG enrichment network diagram of differential metabolites. Pale yellow nodes in the graph represent pathways, and small nodes connected to them are specific metabolites annotated to that pathway. The size of the node indicates the number of differential metabolites annotated to that pathway, and the color depth represents the log2‐transformed FC values. (B) Protein levels of PINK1 and parkin in cells with or without PA stimulation. *p < .05, **p < .01. (C) The level of vitamin D in cells. *p < .05, **p < .01. n = 3 biological repeats in each group.
3.5. Metabolomics detected with LC–MS/MS and the PINK1–parkin signaling pathway are implicated in the progression of AMD‐like symptoms
To further investigate the link between the RGR‐d protein and the progression of AMD‐like defects in the context of age‐related oxidative stress, we overexpressed RGR or RGR‐d in ARPE‐19 cells and treated them with PA. We then performed a metabolomic analysis with LC–MS/MS, which identified 77 differentially regulated metabolites, consisting of 44 significantly upregulated and 33 significantly downregulated metabolites in RGR‐d‐expressing cells. Figure 8A1 shows the 10 most upregulated and the 10 most downregulated proteins. A KEGG pathway analysis comparing the RGR‐d + PA group with the RGR + PA group identified the 20 most strongly affected pathways, which included three pathways associated with neurodegenerative diseases: amyotrophic lateral sclerosis, Parkinson's disease, and neurodegeneration–multiple diseases (Figure 8A2). Further analysis of the metabolomics related to Parkinson's disease revealed the significant downregulation of the metabolite adenosine diphosphate (ADP) in Figure 8A3. Research indicates that maintaining mitochondrial homeostasis through PINK1/Parkin‐dependent mitochondrial quality control could potentially alleviate neurodegenerative diseases. 17 Increasing evidence supports the involvement of the classical PINK1–Parkin pathway in Parkinson's disease and its contribution to mitophagy impairment in AMD. 18 We then investigated the activation of the PINK1–parkin signaling pathway associated with Parkinson's disease in ARPE‐19 cells expressing RGR or RGR‐d in vitro. Under PA stimulation mimicking a high‐fat environment, the levels of PINK1 and parkin decreased in cells overexpressing RGR‐d compared with those in cells expressing RGR or in the control cells (Figure 8B1–B3). Moreover, stimulation with PA reduced the level of vitamin D in RGR‐d‐expressing cells compared with unstimulated RGR‐d‐expressing cells (Figure 8C).
To investigate the association between RGR‐d and mitochondria, we examined their localization with mitochondrial staining and immunofluorescent labeling of the Flag tag on recombinant RGR‐d. As shown in Figure 9, Flag was immunolocalized outside the mitochondria in the RGR‐overexpressing cells. Conversely, in the RGR‐d‐overexpressing group, Flag showed a dispersed pattern and localized within the mitochondria. In Figures S7 and S8, we examined the localization of RGR and RGR‐d in the ER and Golgi with or without PA stimulation. Immunofluorescence staining revealed that RGR was well‐colocalized with calnexin and GM130, whereas RGR‐d demonstrated a significantly weaker association. Collectively, these findings indicate a correlation between PINK1–parkin‐dependent mitophagy and the development of AMD‐like symptoms in RGR‐d mice.
FIGURE 9.
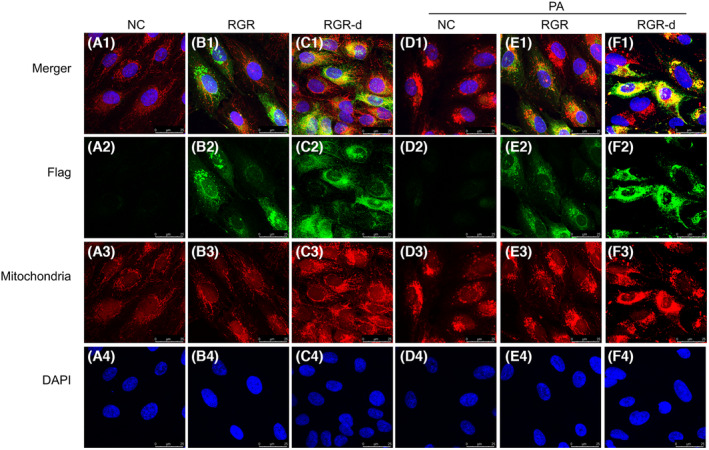
Immunofluorescent double‐labeling of Flag and mitochondria in ARPE‐19 cells of each group after treatment with or without PA. Flag (green) immunofluorescence was detected outside the mitochondria (red) in the RGR group. However, the Flag signal (green) was dispersed and localized in the mitochondria (red) in the RGR‐d group. Nuclei were labeled with 4‐,6‐diamidino‐2‐phenylindole (DAPI) (blue). n = 3 biological repeats in each group.
4. DISCUSSION
In a previous study, we identified early changes in aged RGR‐d mice, 16 prompting further investigation into whether HFD could worsen AMD‐like symptoms in RGR‐d mice and the associated signaling pathways. In this study, a 3‐month HFD caused no significant changes in the fundus, but mottled pigment changes were observed in WT mice after 6 months on an HFD. Conversely, RGR‐d mice displayed severe AMD‐like symptoms after 6 months on HFD, including focal atrophy resembling geographic atrophy and thinner retinal vessels. Fundus fluorescein angiography revealed a reduction in retinal and choroidal vessel fluorescence. The decline in visual function was most pronounced in the RGR‐d + HFD group. In the fluorescence angiography analysis, we observed a decrease in the total number of junctions in both the WT + HFD and RGR‐d + HFD groups compared to the WT and RGR‐d groups, respectively. However, there were no significant differences between the WT + HFD and RGR‐d + HFD groups regarding the total number of junctions and the percentage area of central vessels. We hypothesize that in late‐stage dry AMD, geographic atrophy is a significant feature, primarily characterized by the atrophy of the choriocapillaris and RPE. However, retinal vascular atrophy may not have further deteriorated in the late stages. Consequently, while fundus photography revealed atrophy, fluorescence angiography did not show significant differences in the total number of junctions or the percentage area of central vessels. An ultrastructural analysis showed thinning of the retinal neuroepithelium, reduced pigment in the RPE layer, and thickening of Bruch's membrane in the RGR‐d mice after 6 months on the HFD. Dotted and patchy drusen deposits were observed beneath Bruch's membrane, correlating with the development of atrophic lesions. To clarify the mechanisms underlying the progression of AMD, we conducted a nontargeted lipidomic analysis in the animal model and a metabolomic analysis in cell cultures, identifying potential associations between vitamin D levels and the PINK1–parkin signaling pathway.
RGR, a membrane protein expressed in RPE cells, plays a crucial role in synthesizing 11‐cis‐retinal under varying light conditions. 15 An aberrant splicing isoform of RGR, known as RGR‐d, is implicated in drusen formation, is deposited in Bruch's membrane, and is found in both hard and soft drusen in human eyes. 19 Our previous research suggested that RGR‐d contributes to the pathogenesis of AMD due to its abnormal folding pattern. 20 HFD creates an oxidative stress environment that may exacerbate the development of AMD, although the precise mechanism remains unclear. 21 Fatty acid oxidation primarily occurs in the mitochondria, leading to the release of reactive oxygen species (ROS) and toxic dicarboxylic acids, which trigger inflammation and oxidative stress. 22 The retina is metabolically active and undergoes outer segment shedding, and it relies on cholesterol from hepatic sources via the bloodstream for membrane synthesis because the lipid turnover in the photoreceptor outer segments is slow. 23 We observed thinning of the retinal neuroepithelium in the central and peripheral retinas of RGR‐d mice after HFD treatment.
The degeneration of the choriocapillaris is a hallmark of AMD. 24 A previous study indicated that the loss of the choriocapillaris occurs in early AMD, with greater loss in geographic atrophy, whereas the lumen/stroma ratio in the outer choroid shows no significant change. 25 In the present study, we observed a reduction in the fluorescence intensity of CD31 in the RGR‐d + HFD group, and the protein level was also downregulated in the RPE–Bruch's membrane–choriocapillaris complex in these mice. However, we only tested the whole choroid layer. In our next study, we will assess the vascular loss in the choriocapillaris during disease progression. The RPE is the outer blood–retina barrier (BRB) and is a critical target tissue in AMD. 26 RPE barrier dysfunction may result from the disruption of the intercellular tight junctions. 26 ZO‐1 is a major structural protein of intercellular junctions. Dysfunction of the RPE–cell barrier was observed in the RGR‐d mice, and this disorder was aggravated by treatment with HFD. Bruch's membrane anchors the RPE and choriocapillaris and is thought to induce cell polarity and the formation of tight junctions. It is degraded by matrix metalloproteinases and continuously replenished and renewed by the RPE and choroid. 27 A hallmark of AMD is the thickening of Bruch's membrane with sub‐RPE deposits, similar to those found in early AMD. 28 In this study, we observed a thickened Bruch's membrane and some diffuse granular deposits in the choroid and Bruch's membrane, which even ruptured and became discontinuous in the RGR‐d + HFD mice. Bruch's membrane is a semipermeable membrane that allows typical biomolecules to diffuse across it, including lipids, nutrients, metabolites, pigment precursors, vitamins, and various plasma constituents. 29 , 30 , 31 Age‐related changes in Bruch's membrane can affect the health of the RPE and the neurosensory retina, thus contributing to the etiology of AMD. 32 The pathology underlying the thickening of Bruch's membrane and these sub‐RPE deposits is not entirely clear. The effects of this pathology warrant investigation in future research. Previous studies have noted that the ERG a‐wave originates from photoreceptor cells, and the b‐wave from bipolar cells. 33 , 34 Flicker ERG may originate from the cone system, but this has not been confirmed. 35 Cone bipolar cells and rod bipolar cells are secondary neurons mainly located in the INL. The cone a‐wave and maximum a‐wave were reduced after 6 months on the HFD in the RGR‐d mice, indicating dysfunction of the photoreceptor cells.
In recent years, metabolomics has gained significant importance for its ability to characterize and simultaneously quantify biomolecules on a large scale in high‐throughput analyses. 36 Metabolomics provides a comprehensive understanding of cellular metabolism, signaling pathways, and energy regulation, extending our knowledge in these areas. 36 , 37 The retina is a metabolically active tissue and undergoes outer segment shedding. 38 In the present study, we used nontargeted lipidomics to identify biomarkers of the retinal neuroepithelium and RPE–choroid complex in animals. We also used metabolomics to investigate the pathways involved in the development of AMD in cells overexpressing RGR or RGR‐d. In the nontargeted lipidomic analysis, the level of vitamin D was lower in the RGR‐d + HFD mice than in the RGR‐d or WT + RGR‐d mice. The biologically active form of vitamin D, 1,25‐(OH)2D3, is a multifunctional steroid hormone that modulates many transcriptional processes and has a broad range of cellular functions. 39 Vitamin D is known to protect mitochondria from damage by regulating ROS, calcium signaling, and the transcription of BCL2 protein. 40 As reported in previous studies, increased serum vitamin D concentrations are associated with a reduced likelihood of early AMD. 1 , 41 Research has shown that vitamin D protects the RPE from oxidative damage and that vitamin D deficiency contributes to the development of AMD. 42 The potential causal association between vitamin D and AMD encourages future clinical research.
A comprehensive KEGG metabolic pathway analysis revealed disruptions in the orchestration of multiple metabolites in pathways associated with neurodegenerative diseases, such as Parkinson's disease, when RGR‐d‐overexpressing cells were exposed to PA. There is increasing evidence implicating mitochondrial damage in Parkinson's disease. 43 , 44 The roles of PINK1 and parkin in selectively tagging damaged mitochondria for mitophagy in Parkinson's disease have been described. 45 , 46 PINK1 accumulates on the outer membrane of damaged mitochondria, activates, and recruits Parkin to dysfunctional mitochondria. Parkin then ubiquitinates outer mitochondrial membrane proteins to initiate mitophagy. 45 Furthermore, recent studies have identified dysregulated mitophagy in certain AMD mouse models. 47 , 48 Enhancing PINK1/Parkin‐dependent mitophagy has been shown to improve mitochondrial and photoreceptor homeostasis, thereby preserving visual function in AMD mouse models. 49 Hence, we investigated the classical PINK1–Parkin pathway, known to be involved in Parkinson's disease 45 to explore mitophagy in RGR‐d mice under HFD treatment. Our findings showed the downregulation of PINK1 and parkin, with the corresponding upregulation of P62, in the retinal neuroepithelium and RPE‐choroid complex of the RGR‐d + HFD group compared with those in the RGR‐d and WT + HFD groups. PA stimulation decreased the levels of PINK1 and parkin in the RGR‐d cells. The PINK1 and parkin proteins, which are mutated in familial Parkinsonism, collaborate to efficiently eliminate damaged mitochondria through mitophagy, a specific type of autophagy. 50 Mitochondrial dysfunction plays an important role in inducing oxidative stress and promoting energy crises. 51 Mitophagy, a crucial cellular process, mediates the selective removal of defective mitochondria and plays a key role in maintaining cellular homeostasis. Dysfunctional mitophagy can lead to the accumulation of damaged mitochondria, contributing to cellular dysfunction and neurodegeneration. 52 In the present study, we observed that the splicing variant of RGR, RGR‐d, was deposited in the mitochondria, whereas the normal RGR protein was distributed in the cytoplasm, without accumulating in the mitochondria. Combining the above results, we hypothesize that under normal conditions, the deposition of RGR‐d occurs in functional mitochondria and is subsequently metabolized. However, with increasing age, oxidative stress within the body increases, leading to a decline in mitochondrial function. The accumulation of RGR protein in the mitochondria promotes mitophagy. However, the RGR‐d protein loses its normal function, and generates protein toxicity, impeding mitophagy, resulting in cellular damage, and potentially contributing to the development of AMD. In the RGR + PA group, we observed no significant decrease in PINK1 levels. We hypothesize that the accumulation of RGR protein in the cytoplasm promotes mitophagy and and may inhibit the occurrence of severe progression. Future studies will focus on investigating RGR as a potential treatment target in the early stages of AMD progression.
Feeding mice with an HFD for 6 months exacerbated the progression of AMD‐like features in RGR‐d mice compared with those in age‐matched RGR‐d mice fed a normal diet, or in WT mice fed the HFD. We also investigated potential biomarkers and signaling pathways associated with AMD‐like features. However, this study had several limitations. First, although the wave amplitudes of ERG indicated dysfunction of the photoreceptor cells in the RGR‐d mice after 6 months of HFD, TEM revealed disorder of the POS. Second, choroidal atrophy primarily affected the choriocapillaris, but we only assessed the levels of CD31 in the entire choroid layer. Future studies should focus on evaluating vascular loss specifically in the choriocapillaris during disease progression. Third, reduced mitophagy indicated mitochondrial dysfunction, which warrants further investigation. In subsequent studies, we will investigate this mitochondrial dysfunction in greater detail.
In summary, RGR‐d mice exposed to HFD for 6 months can be used as a valuable animal model to study the aggregation of AMD‐like features and the progression of AMD, which is associated with mitochondrial dysfunction and downregulation of the PINK1–parkin pathway. This insight should facilitate the identification of potential therapeutic targets for severe AMD. Further research is required to fully clarify the underlying mechanisms and to investigate potential therapeutic strategies targeting the PINK1–parkin pathway to alleviate the impact of oxidative stress in AMD.
AUTHOR CONTRIBUTIONS
Yue Guo, Lvzhen Huang, and Mingwei Zhao contributed to the study design and performed the experiments. Henry K. W. Fong contributed to the study design. Sitong Chen and Wenxue Guan performed the data analysis. Ningda Xu, Li Zhu, Wei Du, Zhiming Liu revised the paper.
FUNDING INFORMATION
This work was supported by the National Natural Science Foundation of China (Grant No. 82171060) and the National Key Research and Development Program of China (No. 2020YFC2008200; No. 2020YFC2008203). The funders had no role in the study design, data collection and analysis, decision to publish, or preparation of the manuscript.
DISCLOSURES
The authors declare no conflicts of interest.
ETHICS APPROVAL AND CONSENT TO PARTICIPATE
The study has been performed in accordance with the Declaration of Helsinki. The study was approved by the Ethics Committee of Peking University People's Hospital (Approval no. 2019PHC027) and the experiments complied with the Association for Research in Vision and Ophthalmology's Statement on the Use of Animals in Research.
Supporting information
Data S1.
ACKNOWLEDGMENTS
Not applicable.
Guo Y, Chen S, Guan W, et al. Retinal G‐protein‐coupled receptor deletion exacerbates AMD‐like changes via the PINK1–parkin pathway under oxidative stress. The FASEB Journal. 2024;38:e70135. doi: 10.1096/fj.202401160RR
Contributor Information
Lvzhen Huang, Email: huanglvzhen@126.com.
Mingwei Zhao, Email: zhaomingwei64@163.com.
DATA AVAILABILITY STATEMENT
The data that support the findings of this study are available from the corresponding author upon reasonable request.
REFERENCES
- 1. Guymer RH, Campbell TG. Age‐related macular degeneration. Lancet. 2023;401(10386):1459‐1472. [DOI] [PubMed] [Google Scholar]
- 2. Datta S, Cano M, Ebrahimi K, Wang L, Handa JT. The impact of oxidative stress and inflammation on RPE degeneration in non‐neovascular AMD. Prog Retin Eye Res. 2017;60:201‐218. [DOI] [PMC free article] [PubMed] [Google Scholar]
- 3. Sparrow JR, Boulton M. RPE lipofuscin and its role in retinal pathobiology. Exp Eye Res. 2005;80(5):595‐606. [DOI] [PubMed] [Google Scholar]
- 4. Khan KN, Mahroo OA, Khan RS, et al. Differentiating drusen: drusen and drusen‐like appearances associated with ageing, age‐related macular degeneration, inherited eye disease and other pathological processes. Prog Retin Eye Res. 2016;53:70‐106. [DOI] [PubMed] [Google Scholar]
- 5. Toomey CB, Johnson LV, Bowes RC. Complement factor H in AMD: bridging genetic associations and pathobiology. Prog Retin Eye Res. 2018;62:38‐57. [DOI] [PMC free article] [PubMed] [Google Scholar]
- 6. Kim JT, Jun JH, Lee SC, Lee MW. Retinal microvasculature and choriocapillaris impairments according to the stage of dry age‐related macular degeneration. Clin Experiment Ophthalmol. 2023;51(1):36‐43. [DOI] [PubMed] [Google Scholar]
- 7. Elbaz‐Hayoun S, Rinsky B, Hagbi‐Levi S, Grunin M, Chowers I. CCR1 mediates Müller cell activation and photoreceptor cell death in macular and retinal degeneration. elife. 2023;12:12. [DOI] [PMC free article] [PubMed] [Google Scholar]
- 8. Wu J, Cho E, Giovannucci EL, et al. Dietary intake of α‐linolenic acid and risk of age‐related macular degeneration. Am J Clin Nutr. 2017;105(6):1483‐1492. [DOI] [PMC free article] [PubMed] [Google Scholar]
- 9. Nordestgaard LT, Tybjærg‐Hansen A, Frikke‐Schmidt R, Nordestgaard BG. Elevated apolipoprotein A1 and HDL cholesterol associated with age‐related macular degeneration: 2 population cohorts. J Clin Endocrinol Metab. 2021;106(7):e2749‐e2758. [DOI] [PubMed] [Google Scholar]
- 10. Handa JT, Cano M, Wang L, Datta S, Liu T. Lipids, oxidized lipids, oxidation‐specific epitopes, and age‐related macular degeneration. Biochim Biophys Acta Mol Cell Biol Lipids. 2017;1862(4):430‐440. [DOI] [PMC free article] [PubMed] [Google Scholar]
- 11. Chen CH, Lin HC, Lin HL, Keller JJ, Wang LH. Association between antihyperlipidemic agent use and age‐related macular degeneration in patients with hyperlipidemia: a population‐based retrospective cohort study. Biomedicines. 2023;11(6):1508. [DOI] [PMC free article] [PubMed] [Google Scholar]
- 12. Kananen F, Strandberg T, Loukovaara S, Immonen I. Early middle age cholesterol levels and the association with age‐related macular degeneration. Acta Ophthalmol. 2021;99(7):e1063‐e1069. [DOI] [PubMed] [Google Scholar]
- 13. Vassilev ZP, Ruigomez A, Soriano‐Gabarro M, Garcia Rodriguez LA. Diabetes, cardiovascular morbidity, and risk of age‐related macular degeneration in a primary care population. Invest Ophthalmol Vis Sci. 2015;56(3):1585‐1592. [DOI] [PubMed] [Google Scholar]
- 14. Kochounian H, Zhang Z, Spee C, Hinton DR, Fong HK. Targeting of exon VI‐skipping human RGR‐opsin to the plasma membrane of pigment epithelium and co‐localization with terminal complement complex C5b‐9. Mol Vis. 2016;22:213‐223. [PMC free article] [PubMed] [Google Scholar]
- 15. Tworak A, Kolesnikov AV, Hong JD, et al. Rapid RGR‐dependent visual pigment recycling is mediated by the RPE and specialized Müller glia. Cell Rep. 2023;42(8):112982. [DOI] [PMC free article] [PubMed] [Google Scholar]
- 16. Bao X, Zhang Z, Guo Y, et al. Human RGR gene and associated features of age‐related macular degeneration in models of retina‐choriocapillaris atrophy. Am J Pathol. 2021;191(8):1454‐1473. [DOI] [PMC free article] [PubMed] [Google Scholar]
- 17. Huang Z, Ren S, Jiang Y, Wang T. PINK1 and Parkin cooperatively protect neurons against constitutively active TRP channel‐induced retinal degeneration in Drosophila. Cell Death Dis. 2016;7(4):e2179. [DOI] [PMC free article] [PubMed] [Google Scholar]
- 18. Quinn P, Moreira PI, Ambrósio AF, Alves CH. PINK1/PARKIN signalling in neurodegeneration and neuroinflammation. Acta Neuropathol Commun. 2020;8(1):189. [DOI] [PMC free article] [PubMed] [Google Scholar]
- 19. Fong HK, Lin MY, Pandey S. Exon‐skipping variant of RGR opsin in human retina and pigment epithelium. Exp Eye Res. 2006;83(1):133‐140. [DOI] [PubMed] [Google Scholar]
- 20. Ren C, Cui H, Bao X, et al. Proteopathy linked to exon‐skipping isoform of RGR‐opsin contributes to the pathogenesis of age‐related macular degeneration. Invest Ophthalmol Vis Sci. 2023;64(13):41. [DOI] [PMC free article] [PubMed] [Google Scholar]
- 21. Sterling JK, Baumann B, Foshe S, et al. Inflammatory adipose activates a nutritional immunity pathway leading to retinal dysfunction. Cell Rep. 2022;39(11):110942. [DOI] [PMC free article] [PubMed] [Google Scholar]
- 22. Kaarniranta K, Uusitalo H, Blasiak J, et al. Mechanisms of mitochondrial dysfunction and their impact on age‐related macular degeneration. Prog Retin Eye Res. 2020;79:100858. [DOI] [PMC free article] [PubMed] [Google Scholar]
- 23. Albert A, Alexander D, Boesze‐Battaglia K. Cholesterol in the rod outer segment: a complex role in a “simple” system. Chem Phys Lipids. 2016;199:94‐105. [DOI] [PubMed] [Google Scholar]
- 24. Lipecz A, Miller L, Kovacs I, et al. Microvascular contributions to age‐related macular degeneration (AMD): from mechanisms of choriocapillaris aging to novel interventions. GeroScience. 2019;41(6):813‐845. [DOI] [PMC free article] [PubMed] [Google Scholar]
- 25. Sohn EH, Flamme‐Wiese MJ, Whitmore SS, et al. Choriocapillaris degeneration in geographic atrophy. Am J Pathol. 2019;189(7):1473‐1480. [DOI] [PMC free article] [PubMed] [Google Scholar]
- 26. Obert E, Strauss R, Brandon C, et al. Targeting the tight junction protein, zonula occludens‐1, with the connexin43 mimetic peptide, αCT1, reduces VEGF‐dependent RPE pathophysiology. J Mol Med (Berl). 2017;95(5):535‐552. [DOI] [PMC free article] [PubMed] [Google Scholar]
- 27. Fields MA, del Priore LV, Adelman RA, Rizzolo LJ. Interactions of the choroid, Bruch's membrane, retinal pigment epithelium, and neurosensory retina collaborate to form the outer blood‐retinal‐barrier. Prog Retin Eye Res. 2020;76:100803. [DOI] [PubMed] [Google Scholar]
- 28. Ramkumar HL, Zhang J, Chan CC. Retinal ultrastructure of murine models of dry age‐related macular degeneration (AMD). Prog Retin Eye Res. 2010;29(3):169‐190. [DOI] [PMC free article] [PubMed] [Google Scholar]
- 29. Del PL, Tezel TH, Kaplan HJ. Maculoplasty for age‐related macular degeneration: reengineering Bruch's membrane and the human macula. Prog Retin Eye Res. 2006;25(6):539‐562. [DOI] [PubMed] [Google Scholar]
- 30. Lee Y, Hussain AA, Seok JH, Kim SH, Marshall J. Modulating the transport characteristics of Bruch's membrane with steroidal glycosides and its relevance to age‐related macular degeneration (AMD). Invest Ophthalmol Vis Sci. 2015;56(13):8403‐8418. [DOI] [PubMed] [Google Scholar]
- 31. Cankova Z, Huang JD, Kruth HS, Johnson M. Passage of low‐density lipoproteins through Bruch's membrane and choroid. Exp Eye Res. 2011;93(6):947‐955. [DOI] [PMC free article] [PubMed] [Google Scholar]
- 32. Guymer R, Luthert P, Bird A. Changes in Bruch's membrane and related structures with age. Prog Retin Eye Res. 1999;18(1):59‐90. [DOI] [PubMed] [Google Scholar]
- 33. Hood DC. Assessing retinal function with the multifocal technique. Prog Retin Eye Res. 2000;19(5):607‐646. [DOI] [PubMed] [Google Scholar]
- 34. Rosner M, Bobak P, Lam TL. Corneal electrode for recording electroretinograms in rats. Doc Ophthalmol. 1993;83(2):175‐180. [DOI] [PubMed] [Google Scholar]
- 35. Crevier DW, Meister M. Synchronous period‐doubling in flicker vision of salamander and man. J Neurophysiol. 1998;79(4):1869‐1878. [DOI] [PubMed] [Google Scholar]
- 36. Wang R, Li B, Lam SM, Shui G. Integration of lipidomics and metabolomics for in‐depth understanding of cellular mechanism and disease progression. J Genet Genomics. 2020;47(2):69‐83. [DOI] [PubMed] [Google Scholar]
- 37. Zhang GF, Sadhukhan S, Tochtrop GP, Brunengraber H. Metabolomics, pathway regulation, and pathway discovery. J Biol Chem. 2011;286(27):23631‐23635. [DOI] [PMC free article] [PubMed] [Google Scholar]
- 38. Mazzoni F, Safa H, Finnemann SC. Understanding photoreceptor outer segment phagocytosis: use and utility of RPE cells in culture. Exp Eye Res. 2014;126:51‐60. [DOI] [PMC free article] [PubMed] [Google Scholar]
- 39. Layana AG, Minnella AM, Garhöfer G, et al. Vitamin D and age‐related macular degeneration. Nutrients. 2017;9(10):1120. [DOI] [PMC free article] [PubMed] [Google Scholar]
- 40. Berridge MJ. Vitamin D cell signalling in health and disease. Biochem Biophys Res Commun. 2015;460(1):53‐71. [DOI] [PubMed] [Google Scholar]
- 41. Millen AE, Voland R, Sondel SA, et al. Vitamin D status and early age‐related macular degeneration in postmenopausal women. Arch Ophthalmol. 2011;129(4):481‐489. [DOI] [PMC free article] [PubMed] [Google Scholar]
- 42. Tohari AM, Alhasani RH, Biswas L, et al. Vitamin D attenuates oxidative damage and inflammation in retinal pigment epithelial cells. Antioxidants (Basel). 2019;8(9):341. [DOI] [PMC free article] [PubMed] [Google Scholar]
- 43. Chen Z, Rasheed M, Deng Y. The epigenetic mechanisms involved in mitochondrial dysfunction: implication for Parkinson's disease. Brain Pathol. 2022;32(3):e13012. [DOI] [PMC free article] [PubMed] [Google Scholar]
- 44. Qi R, Sammler E, Gonzalez‐Hunt CP, et al. A blood‐based marker of mitochondrial DNA damage in Parkinson's disease. Sci Transl Med. 2023;15(711):eabo1557. [DOI] [PMC free article] [PubMed] [Google Scholar]
- 45. Pickrell AM, Youle RJ. The roles of PINK1, parkin, and mitochondrial fidelity in Parkinson's disease. Neuron. 2015;85(2):257‐273. [DOI] [PMC free article] [PubMed] [Google Scholar]
- 46. Imberechts D, Vandenberghe W. Defects in PINK‐PRKN‐PARK7/DJ‐1‐dependent mitophagy and autosomal recessive Parkinson disease. Autophagy. 2023;19(6):1872‐1873. [DOI] [PMC free article] [PubMed] [Google Scholar]
- 47. Kaarniranta K, Blasiak J, Liton P, Boulton M, Klionsky DJ, Sinha D. Autophagy in age‐related macular degeneration. Autophagy. 2023;19(2):388‐400. [DOI] [PMC free article] [PubMed] [Google Scholar]
- 48. Sridevi GI, Viiri J, Koskela A, et al. Mitophagy in the retinal pigment epithelium of dry age‐related macular degeneration investigated in the NFE2L2/PGC‐1α(−/−) mouse model. Int J Mol Sci. 2020;21(6):1976. [DOI] [PMC free article] [PubMed] [Google Scholar]
- 49. Jiménez‐Loygorri JI, Viedma‐Poyatos Á, Gómez‐Sintes R, Boya P. Urolithin a promotes p62‐dependent lysophagy to prevent acute retinal neurodegeneration. Mol Neurodegener. 2024;19(1):49. [DOI] [PMC free article] [PubMed] [Google Scholar]
- 50. Li J, Yang D, Li Z, et al. PINK1/parkin‐mediated mitophagy in neurodegenerative diseases. Ageing Res Rev. 2023;84:101817. [DOI] [PubMed] [Google Scholar]
- 51. Jurcau A. Insights into the pathogenesis of neurodegenerative diseases: focus on mitochondrial dysfunction and oxidative stress. Int J Mol Sci. 2021;22(21):11847. [DOI] [PMC free article] [PubMed] [Google Scholar]
- 52. Lou G, Palikaras K, Lautrup S, Scheibye‐Knudsen M, Tavernarakis N, Fang EF. Mitophagy and neuroprotection. Trends Mol Med. 2020;26(1):8‐20. [DOI] [PubMed] [Google Scholar]
Associated Data
This section collects any data citations, data availability statements, or supplementary materials included in this article.
Supplementary Materials
Data S1.
Data Availability Statement
The data that support the findings of this study are available from the corresponding author upon reasonable request.