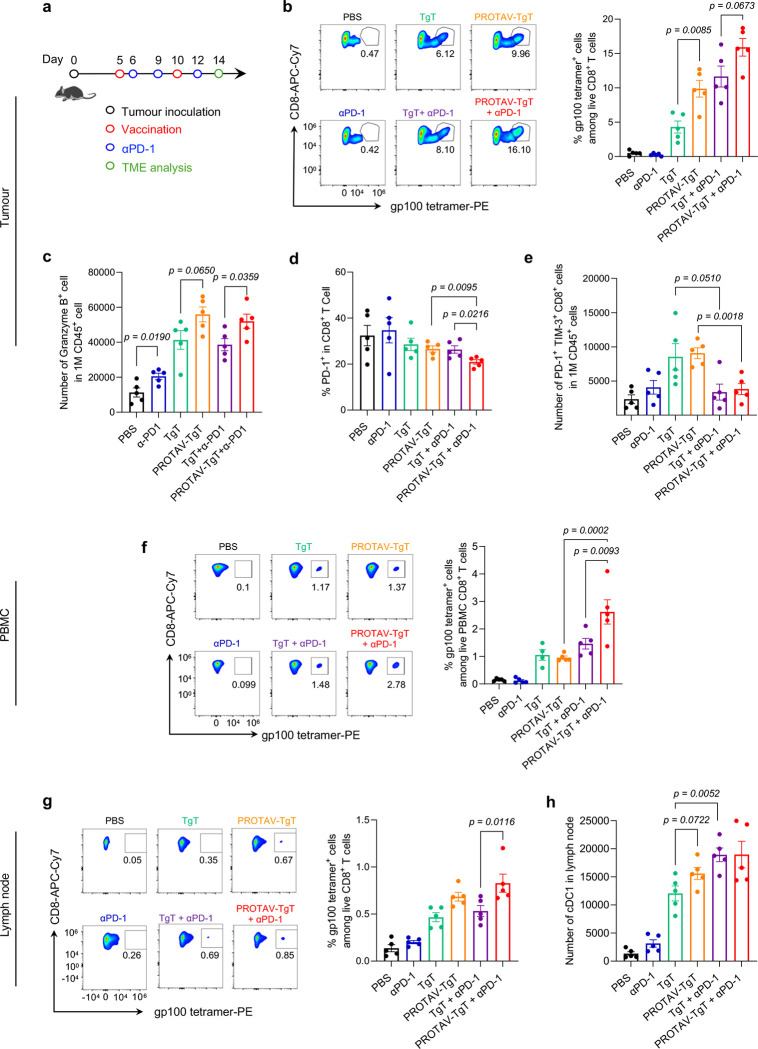
Fig. 5 |. PROTAV-TgT, in combination with αPD-1, reduced immunosuppression in tumor microenvironment.
a Timeline for the study of systemic and TME immunomodulation by PROTAV-TgT, alone or combined with αPD-1, in C57BL/6 mice with B16F10 melanoma. b, Representative flow cytometry graphs (left) and quantified flow cytometry results (right) of gp100/H-2Db tetramer staining of intratumoral gp100-specific CD8+ T cells. Relative to TgT, PROTAV-TgT, alone or combined with αPD-1, promoted the tumor infiltration of antitumor CD8+ T cells, as shown by gp100-specific CD8+ T cells analyzed as an example by tetramer staining. c, Flow cytometry results showing the fractions of granzyme B-producing CD8+ T cells among total live CD8+ T cells from as-treated tumors. Relative to TgT + aPD-1, PROTAV-TgT + aPD-1 promoted the fraction of granzyme B-producing CD8+ T cells among total CD8+ T cells in melanoma. d-e Flow cytometry results showing the fractions of PD-1 expression on the CD8+ T cells (d) and the number of PD-1+ TIM-3+ CD8+ T cells in 1M CD45+ cell (e), f, Representative flow cytometry graphs (left) and quantified flow cytometry results (right) of gp100/H-2Db tetramer staining of PBMC gp100-specific CD8+ T cells from mice treated as above. Relative to TgT, PROTAV-TgT, alone or combined with αPD-1, promoted the fraction of gp100-specific CD8+ T cells among total live PBMC CD8+ T cells. g, Representative flow cytometry graphs (left) and quantified flow cytometry results (right) of gp100/H-2Db tetramer staining of gp100-specific CD8+ T cells among lymph node total live CD8+ T cells. h, Quantified flow cytometry results showing the numbers of cDC1 in lymph nodes. Relative to TgT, PROTAV-TgT, alone or combined with αPD-1, promoted the lymph node infiltration of gp100-specific CD8+ T cells (g) and cDC1 cells (h). Data represents s.e.m. (n = 5); statistical analysis was conducted using one-way ANOVA with Bonferroni post-test.

