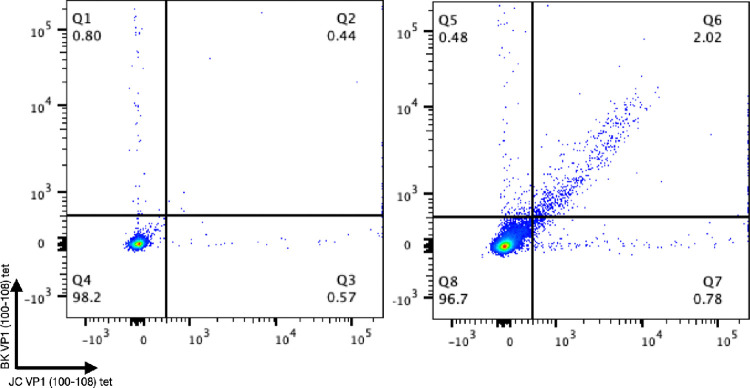
Figure 4: Patient response to JCV and BKV VP1 (100–108).
Flow cytometry data of live CD8+ T cells stained with HLA-A2:BK VP1 (100–108) and HLA-A2:JV VP1 (100–108) at 1:50 tetramer dilution with an HLA-A2 positive JCV antibody negative healthy donor on the left and an HLA-A2 confirmed PML survivor on the right.

