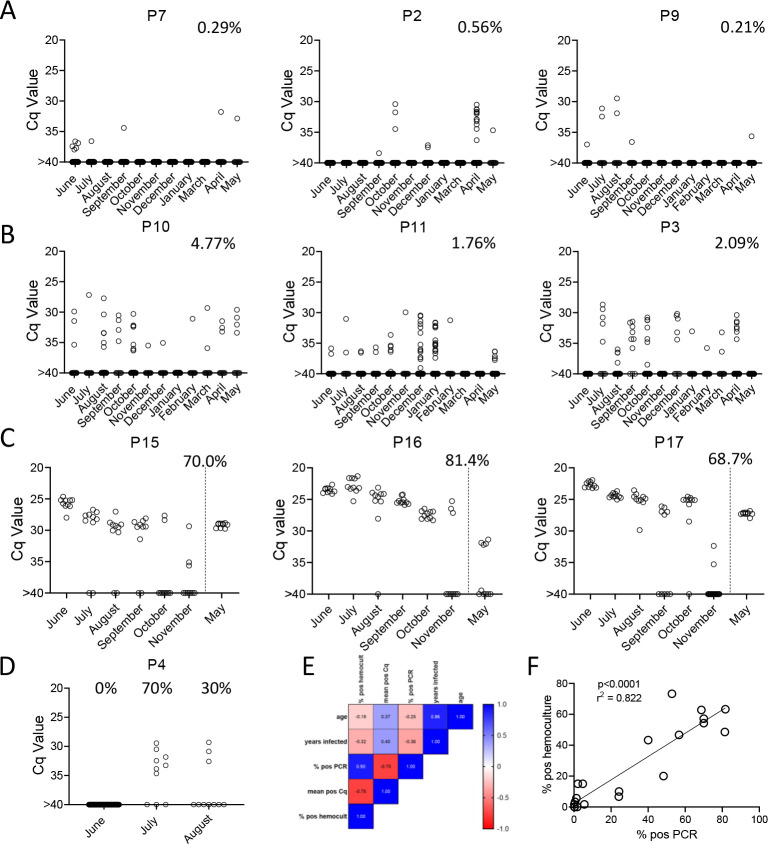
Figure 3.
Monthly tally of representative macaques with A) rarely, B) variably or C) frequently positive PCR reactions over the one year of sampling. Animals in groups A) and B) were sampled all 12 months while those in C) were sampled only for the first 6 months then in the 12th month. Percentages indicate the overall percentage of positive PCR reactions over all sampling points. D) Macaque P4 switched from 100% negative to 50% positive PCR reactions coincident with a change in health status. E) and F) Pearson correlation analysis indicated a strong positive correlation between the overall frequencies of positive PCRs and hemocultures and a negative correlation between these frequencies and Cq values, but no significant correlation between age or length of infection with any of the three parasite parameters.

