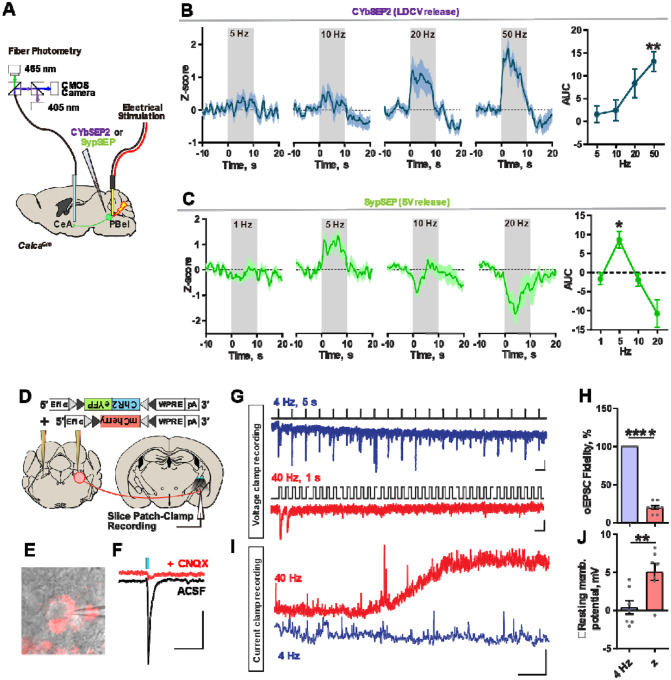
Figure 3. SV and LDCV release from CGRPPBel neurons are driven by differing frequencies.
(A) Schematic of monitoring LDCV and SV releases from the CGRPPBel→CeAl terminals in vivo. PBel neurons were stimulated using a bipolar tungsten electrode.
(B) LDCV release signals during electrical stimulation of the PBel area (left) and quantification of AUC data (right). (N = 4 mice, average of 3–4 repeats).
(C) SV release signals during electrical stimulation of the PBel area (left) and quantification of AUC data (right). (N = 4 mice, average of 3 repeats).
(D) Schematic of experiment.
(E) Image of a patch-clamped CeAl neuron, surrounded by perisomatic mCherry signals. Scale?
(F) Optically evoked EPSCs are abolished by CNQX treatment. Scale bar, 50 μs, 50 pA.
(G) Post-synaptic current responses evoked by a train of photostimulation at 4 Hz or 40 Hz. Scale bar: 100 ms, 20 pA (top); 20 ms, 20 pA (bottom).
(H) Fidelity of oEPSCs in response to 4-Hz and 40-Hz photostimulation.
(I) Example trace of a CeAl neurons membrane potential in response to 4-Hz or 40-Hz photostimulation. Scale bar: 30 s, 2 mV.
(J) Quantification of membrane potential responses to 4-Hz or 40-Hz photostimulation.
****P < 0.0001, **P < 0.01, *P < 0.05. Data are presented as mean ± s.e.m.

