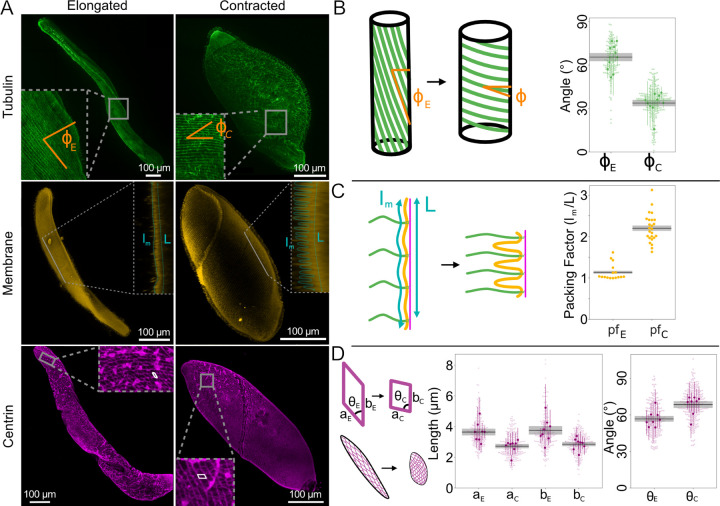
FIG. 1.
Changes in Spirostomum cortex in elongated (e) vs. contracted (c) cells quantified by immunofluorescence. A Representative example maximum intensity projections of confocal fluorescence microscopy z-stacks of Spirostomum stained via TAP952 (anti-tubulin, green, top), Cellmask Orange (membrane, yellow, middle), and 20H5 (anti-centrin, magenta, bottom). Membrane insets show single slices projected in the perpendicular plane. For space, elongated and contracted cells are shown at different scales. B-D Quantification of image features, as shown in cartoons. Black lines and gray bars show mean and SEM (over N=number of cells in each measurement). B and D Larger, darker markers show means from individual cells with standard deviation (as colored lines) and lighter, smaller markers show beeswarm plots of all individual measurements. B Microtubule pitch angle ϕ, N = 10 cells for each condition. C Packing factor due to membrane buckling, N=10 cells for each condition. D Length and angle of myoneme mesh segments, N=8 cells for each condition.

