Abstract
Sphingosine-1-phosphate (S1P) is a ubiquitous lipid mediator, acting via specific G-protein-coupled receptors (GPCR) and intracellularly. Previous work has shown that deletion of S1P lyase caused a chronic elevation of cytosolic [Ca2+]i and enhanced Ca2+ storage in mouse embryonic fibroblasts. Here, we studied the role of sphingosine kinase (SphK)-1 in Ca2+ signaling, using two independently generated EA.hy926 cell lines with stable knockdown of SphK1 (SphK1-KD1/2). Resting [Ca2+]i and thapsigargin-induced [Ca2+]i increases were reduced in both SphK1-KD1 and -KD2 cells. Agonist-induced [Ca2+]i increases, measured in SphK1-KD1, were blunted. In the absence of extracellular Ca2+, thapsigargin-induced [Ca2+]i increases declined rapidly, indicating enhanced removal of Ca2+ from the cytosol. In agreement, plasma membrane Ca2+ ATPase (PMCA)-1 and -4 and their auxiliary subunit, basigin, were strongly upregulated. Activation of S1P-GPCR by specific agonists or extracellular S1P did not rescue the effects of SphK1 knockdown, indicating that S1P-GPCR were not involved. Lipid measurements indicated that not only S1P but also dihydro-sphingosine, ceramides, and lactosylceramides were markedly depleted in SphK1-KD2 cells. SphK2 and S1P lyase were upregulated, suggesting enhanced flux via the sphingolipid degradation pathway. Finally, histone acetylation was enhanced in SphK1-KD2 cells, and the histone deacetylase inhibitor, vorinostat, induced upregulation of PMCA1 and basigin on mRNA and protein levels in EA.hy926 cells. These data show for the first time a transcriptional regulation of PMCA1 and basigin by S1P metabolism. It is concluded that SphK1 knockdown in EA.hy926 cells caused long-term alterations in cellular Ca2+ homeostasis by upregulating PMCA via increased histone acetylation.
Keywords: Basigin, Ca2+ signaling, Plasma membrane Ca2+ ATPase, Sphingosine kinase, Sphingosine-1-phosphate, Sphingosine-1-phosphate lyase
Introduction
Sphingosine-1-phosphate (S1P) is a bioactive lipid that regulates diverse cellular processes, including cell survival, proliferation, differentiation, and migration [6]. S1P is produced from sphingosine by the action of sphingosine kinases (SphK), SphK1 and SphK2. SphK1 is predominantly localized in the cytosol and can translocate to the plasma membrane upon activation, whereas SphK2 is found in nucleus, cytosol, mitochondria, and endoplasmic reticulum (ER) [34, 10]. The degradation of S1P occurs through reversible dephosphorylation back to sphingosine or irreversibly via S1P lyase (SGPL1), which represents the sole exit point of sphingolipid metabolism [36]. Extracellularly, S1P exerts its effects through five G-protein coupled receptors (GPCR), designated S1P1-5, which differentially couple to Gi, Gq, and G12/13 proteins. These receptors regulate for example lymphocyte trafficking, angiogenesis, vascular barrier function, and inflammation [6, 4, 30]. However, S1P also has intracellular functions independent of these receptors, which remain incompletely understood [41]. Notably, nuclear S1P produced by SphK2 interacted with histone deacetylases (HDAC)-1 and -2, inhibiting their enzymatic activity and thus contributing to the regulation of epigenetic mechanisms [16]. Other reported intracellular actions comprise for example stabilization of telomerase reverse transcriptase, or regulation of mitochondrial respiration via interaction with prohibitin-2, among others [42, 32].
Intracellular Ca2+ is a universal and versatile signal that is essential for cellular function [3]. The extensive Ca2+ signaling toolkit provides mechanisms for cell type-specific generation of spacial and temporal Ca2+ signals, which comprise “on” and “off” mechanisms [3]. In non-excitable cells, the key regulators that maintain low intracellular Ca2+ concentrations ([Ca2+]i) are plasma membrane Ca2+ ATPase (PMCA), which exports Ca2+ from the cytosol to the extracellular space, sarco-/endoplasmic reticulum Ca2+ ATPase (SERCA), which pumps Ca2+ from the cytosol into the ER, and secretory pathway Ca2+ ATPase (SPCA) [46, 45, 47]. In mammals, there are four isoforms of PMCA, of which PMCA1 and 4 are ubiquitously expressed, whereas PMCA2 and 3 are predominantly expressed in sensory cells and neurons [47, 40]. Interestingly, genome-wide association studies have associated the ATP2B1 gene, encoding PMCA1, with hypertension (for review, see [40]). Studies in mice with knockout of ATP2B1 in vascular smooth muscle cells showed that these mice had elevated systolic blood pressure and enhanced phenylephrine-induced vasoconstriction, most likely due to the increased [Ca2+]i that was measured in cultured vascular smooth muscle cells of these mice [23]. Furthermore, heterozygous deletion of ATP2B1 proved that decreased PMCA1 activity promoted vascular remodeling in mice, which then developed hypertension at higher age [25]. Additionally, gene polymorphisms in ATP2B1 have been linked to other cardiovascular diseases such as coronary artery disease, myocardial infarction, and coronary artery calcifications in chronic kidney disease (reviewed in [40]). Also PMCA4 is widely expressed in the cardiovascular system, where it suppressed NO production and angiogenesis (reviewed in [40]). Furthermore, mutations in the ATP2B4 gene, encoding PMCA4, were protected against severe forms of malaria [43].
The influence of S1P on cellular Ca2+ homeostasis is highly complex. Early studies suggested that S1P was able to release Ca2+ directly from the ER [12] and probably acted as a second messenger mediating agonist-induced [Ca2+]i increases [27]. Later, these studies were questioned by the discovery of the G-protein-coupled S1P receptors, which are able to induce [Ca2+]i increases via classical G-protein pathways (for example [31]; reviewed in [48]). Nevertheless, by using the photolysis of caged S1P, we showed that intracellular S1P was able to mobilize Ca2+ from thapsigargin-sensitive stores independently of G-protein-coupled S1P receptors [49]. A potential involvement of the SphK/S1P pathway in agonist-induced [Ca2+]i increases has been studied using the SphK inhibitors, N,N-dimethylsphingosine, and D,L-threo-dihydrosphingosine, which however are non-selective and unspecific [22, 9]. Further work has shown that S1P metabolism also can have a long-term influence on cellular Ca2+ homeostasis, for example, Sgpl1-deficient mouse embryonic fibroblasts had elevated basal cytosolic [Ca2+]i and enhanced Ca2+ storage in ER and lysosomes [7, 50].
The aim of the present study was to re-investigate the putative role of the SphK1/S1P pathway in agonist-induced [Ca2+]i increases by using SphK1-depleted cells. For this, we used two independently generated lines of EA.hy926 cells with stable, shRNA-mediated knockdown of SphK1, SphK1-KD1 [39], and SphK1-KD2 [51]. We show that depletion of SphK1 caused a marked decrease in basal cytosolic [Ca2+]i and attenuated the overall [Ca2+]i response to thapsigargin in both cell lines. Analysis of SphK1-KD2 cells revealed that this phenotype went along with a > 20-fold upregulation of PMCA1 protein expression, which was not due to signaling of S1P-GPCR but rather involved enhanced histone acetylation. In summary, by regulating PMCA, SphK1 exerts a profound long-term influence on cellular Ca2+ homeostasis and, in consequence, on Ca2+-dependent cellular functions.
Materials and methods
Materials
S1P, thapsigargin, K6PC-5, A971432, CYM5520, Gö6983, and vorinostat were purchased from Sigma-Aldrich (Taufkirchen, Germany). CYM5541 and CYM5442 were obtained from Cayman Chemical Company (Ann Arbor, USA). CYM50308 was purchased from Tocris Bioscience (Bristol, UK). Gö6976 was obtained from Selleckchem (Houston, USA). All other materials were from previously described sources [52].
Cell culture
EA.hy926 cells were cultured in RPMI-1640 medium (Gibco/Thermo Fisher Scientific) supplemented with 10% fetal calf serum, 100 U/ml penicillin G and 0.1 mg/ml streptomycin, 10 mM HEPES, and 1.5 µg/ml puromycin in a humidified atmosphere of 5% CO2 and 95% air at 37 °C. EA.hy926 SphK1 knockdown cell line 1 (SphK1-KD1) has been generated by Drs. Andrea Huwiler and Stephanie Schwalm [39], while SphK1 knockdown cell line 2 (SphK1-KD2) has been generated by Dr. Gergely Imre [51]. For microscopy, the cells were seeded onto poly-L-lysine-coated 8-well slides (μ-slide; ibidi GmbH, Martinsried, Germany). Before experiments, the cells were kept in serum-free medium overnight.
[Ca2+]i measurements
[Ca2+]i was determined using the ratiometric dye fura-2 in a Hitachi F2500 spectrofluorometer as described before [5]. Briefly, monolayer of EA.hy926 cells were detached with trypsin, resuspended in Hank’s balanced salt solution (HBSS; 118 mM NaCl, 5 mM KCl, 1 mM CaCl2, 1 mM MgCl2, 5 mM glucose and 15 mM HEPES, pH 7.4) and loaded with 1 µM fura-2/AM for 1 h at room temperature. After washing the cells twice with HBSS, they were resuspended at a density of ∼ 1 × 10⁶ cells/ml. Thereafter, fura-2 fluorescence was monitored. The excitation switched between 340 and 380 nm while emission was recorded at 510 nm. [Ca2+]i was calculated after determination of maximum and minimum fluorescence according to Grynkiewicz et al. [14]. For measurements in the absence of extracellular Ca2+, the cells were resuspended in Ca2+-free HBSS, 50 µM EGTA was added shortly before stimulation with agonists or thapsigargin, and 1 mM CaCl2 was readded thereafter.
Inositol phosphate production
Inositol phosphate production was measured in cells labeled with [3H]inositol as described before [5]. Briefly, stimulation of [3H]inositol-labeled cells with agonists was performed for 20 min at 37 °C in the presence of LiCl. [3H]inositol phosphates were collected by ion exchange chromatography and quantified by liquid scintillation counting.
Quantitative real-time PCR
RNA was isolated using RNeasy plus mini kit (QIAGEN, Hilden, Germany), quantified using a NanoDrop spectrophotometer (Thermo Fisher Scientific, Dreieich, Germany), and transcribed into cDNA using a RevertAid First Strand cDNA Synthesis Kit (Applied Biosystems/Thermo Fisher Scientific) according to the manufacturer’s instructions. Quantitative real-time PCR was performed with the Applied Biosystems Quant Studio 3 Real-Time PCR System (Applied Biosystems/Thermo Fisher Scientific). The following TaqMan probes were used: ATP2B1 (Hs01001490_m1), ATP2B4 (Hs00608066_m1), S1PR1 (Hs01922614_s1), S1PR2 (ARRWEXF), S1PR3 (Hs00245464_s1), S1PR4 (Hs02330084_s1), and S1PR5 (Hs_00258220_s1), all labeled with FAM on the 5′ end. For the following probes, an individually designed TaqMan Array was used: 18S (Hs99999901_s1), SGPL1 (Hs00187407_m1), SPHK1 (Hs00184211_m1), SPHK2 (Hs00219999_m1), SPNS2 (Hs01390449_g1), ATP2A1 (Hs01092295_m1), ATP2A2 (Hs00544877_m1), ATP2A3 (Hs01024558_m1), ATP2B1 (Hs00155949_m1), ATP2B2 (Hs01090453_m1), ATP2B3 (Hs05016448_s1), ATP2B4 (Hs00608066_m1), ATP2C1 (Hs00995930_m1), and ATP2C2 (Hs00939492_m1). All PCR materials were obtained from ThermoFisher Scientific.
Western blotting and antibodies
Cells grown near to confluence on 6-cm dishes were lysed; the proteins were separated by SDS gel electrophoresis and blotted onto polyvinylidene difluoride membranes. Anti-SphK1 (10,670–1-AP) and anti-SphK2 (17,096–1-AP) antibodies were from Proteintech (Manchester, UK). Anti-PMCA1 (ab190355) and anti-CD147 (ab212057) antibodies were from Abcam (Cambridge, UK). For PMCA4, the antibody (MA1-914) from Invitrogen (Carlsbad, California, USA) was used. Anti-SGPL1 antibody (AF5535) was from R&D systems (Wiesbaden, Germany). Anti-histone H3-acetyl-lysine-9 (H3K9ac; 9649S) antibody and anti-phosphoserine protein kinase C (PKC) substrate (#2261) were purchased from Cell Signaling Technology (Danvers, Massachusetts, USA). Anti-β-actin (A5441) was from Sigma-Aldrich Chemie GmbH (Taufkirchen, Germany) and anti-GAPDH (GTX100118) antibody was from Genetex (Irvine, California, USA). HRP-conjugated secondary antibodies were from GE Healthcare (Freiburg, Germany), and the enhanced chemiluminescence system was from Millipore Corporation (Billerica, MA, USA).
Immunocytochemistry
EA.hy926 cells grown on 8-well slides were fixed with 4% paraformaldehyde for 1 h on ice, washed with phosphate-buffered saline (PBS), and permeabilized with 0.1% Triton X-100 in PBS for 5 min at room temperature. Between each of the following steps, the cells were washed with PBS. First, they were blocked with 5% milk in PBS for 1 h at room temperature. Then, they were stained with anti-PMCA1 antibody (1:100, ab190355, Abcam, Cambridge, UK), anti-PMCA4 antibody (1:50, MA1-914, Invitrogen, Carlsbad, USA), or anti-CD147 antibody (1:100, ab21205, Abcam, Cambridge, UK) for 1 h at room temperature, followed by AlexaFluor 488-conjugated anti-rabbit secondary antibody (1:1000) for 1 h at room temperature in the dark. Thereafter, cells were stained with DAPI (1 µg/ml) for 90 s at room temperature in the dark. Finally, confocal laser scanning microscopy was performed with a Zeiss LSM510 Meta system equipped with an inverted Observer Z1 microscope and a Plan-Apochromat 63x/1.4 oil immersion objective (Carl Zeiss MicroImaging GmbH, Göttingen, Germany). The following excitation (ex) laser lines and emission (em) filter sets were used: DAPI: ex 405 nm, em band pass 420–480 nm, AlexaFluor 488: ex: 488 nm, and em: long pass 505 nm.
High-performance liquid chromatography tandem mass spectrometry
Concentrations of S1P, sphingosine, ceramides, glucosylceramides, and lactosylceramides were determined by high-performance liquid chromatography tandem mass spectrometry (LC–MS/MS) essentially as described before [52]. Divergently, the instrumental setup used here was composed of an Agilent Infinity II LC System (Agilent Technologies, Waldbronn, Germany) coupled to a mass spectrometer QTRAP6500 + (Sciex, Darmstadt, Germany).
Data analysis and presentation
Averaged data are expressed as means ± SEM from the indicated number (n) of independent experiments. Statistical analysis was performed as indicated in the figure legends. Graphical presentations and statistical analyses were performed with GraphPad Prism (software version 9, GraphPad Software, San Diego, USA). Fluorescence images were edited with the ZEN software (Carl Zeiss MicroImaging GmbH, Göttingen, Germany). mRNA data were evaluated using the ∆∆Ct method, normalized to 18 s and expressed as fold of control cells. Western blot data were quantified using the iBright Analysis Software (ThermoFisher Scientific, Rockford, Illinois, USA), normalized to ß-actin or GAPDH as indicated, and expressed as fold of controls. For quantification of [Ca2+]i increases, area under the curve (AUC) measurements were performed by integrating the area of thapsigargin-induced [Ca2+]i above basal [Ca2+]i at all time points up to 120 s by using GraphPad Prism.
Results
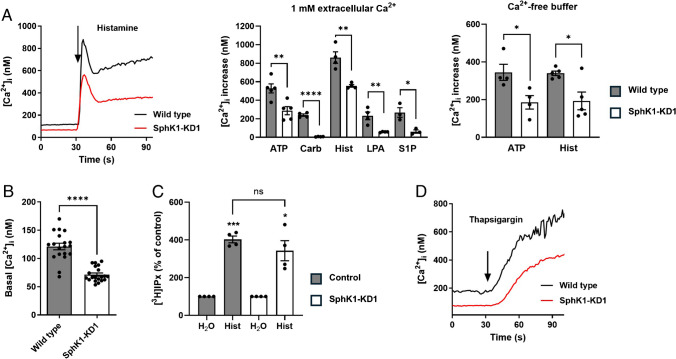
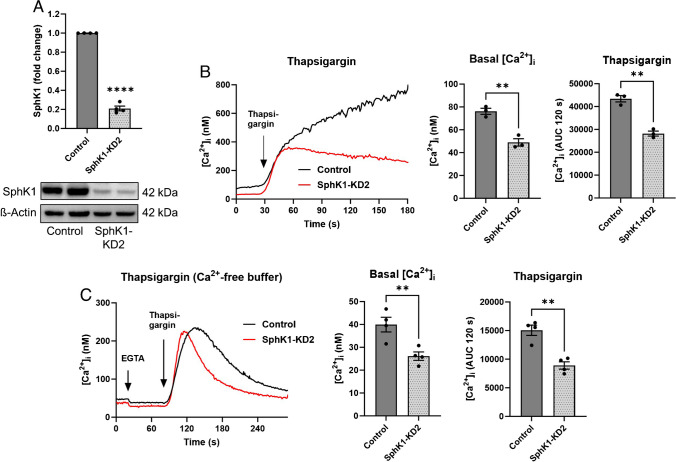
With the aim to re-investigate the role of the SphK1/S1P pathway in Ca2+ signaling, we studied agonist-induced [Ca2+]i increases in EA.hy926 SphK1-KD1 cells, in which shRNA-induced depletion of SphK1 reduced NO-mediated migration and tube formation [39]. As shown in Fig. 1A, peak [Ca2+]i increases above baseline, induced by histamine, ATP, carbachol, lysophosphatidic acid (LPA), and external S1P, were significantly reduced in SphK1-KD1 cells. [Ca2+]i increases by ATP and histamine were also analyzed in the absence of extracellular Ca2+ and reduced by ~ 40% also under this condition (Fig. 1A). Most importantly, we noticed that basal [Ca2+]i was lower in SphK1-KD1 cells: it decreased from ~ 120 nM in wild type cells to ~ 70 nM in SphK1-KD1 cells (Fig. 1B). Furthermore, histamine-induced inositol phosphate production was not affected by the knockdown (Fig. 1C), but thapsigargin-induced [Ca2+]i increases were reduced (Fig. 1D). Also, in the second EA.hy926 cell line with stable SphK1 depletion, SphK1-KD2 cells [51], basal [Ca2+]i was markedly decreased by ~ 35% compared to control cells (Fig. 2A, B). Furthermore, the overall response to thapsigargin, measured as the area under the curve for 120 s of the [Ca2+]i increase, was reduced by ~ 35% (Fig. 2B). Even in the absence of extracellular Ca2+, basal [Ca2+]i was ~ 35% lower in SphK1-KD2 cells, and the response to thapsigargin was reduced by almost half (Fig. 2C). Importantly, thapsigargin-induced [Ca2+]i increases declined much faster in SphK1-depleted cells, indicating that Ca2+ that was released from thapsigargin-sensitive stores was rapidly removed from the cytosol (Fig. 2C). These results demonstrate a profound long-term alteration of Ca2+ homeostasis in SphK1-depleted EA.hy926 cells.
Fig. 1.
Ca2+ homeostasis in EA.hy926 cells with SphK1 knockdown, cell line 1 (SphK1-KD1). A Agonist-induced [Ca2+]i increases in the presence or absence of 1 mM extracellular Ca2+. Shown is a representative time course of [Ca2+]i after stimulation with histamine, and peak [Ca2+]i increases after stimulation with 100 µM ATP, 100 µM carbachol (Carb), 100 µM histamine (Hist), 1 µM LPA, or 1 µM S1P (means ± SEM from n = 3–5 independent experiments for each agonist). B Basal [Ca2+]i in the presence of 1 mM extracellular Ca2+ (data taken from the measurements shown in A; means ± SEM; n = 20). Data in A and B were analyzed by Student’s t-test (*p < 0.05; **p < 0.01; ****p < 0.0001). C Histamine-induced production of tritiated inositol phosphates ([3H]IPx) in cells labeled with [3H]inositol (means ± SEM; n = 4 independent experiments). Responses to histamine (100 µM) were analyzed for each cell line by one-sample t-test (*p < 0.05; ***p < 0.001) and compared between cell lines by Student’s t-test (n.s., not significant). D Representative time course of [Ca2+]i after addition of thapsigargin (selected from ~ 20 measurements per cell line)
Fig. 2.
Ca2+ homeostasis in EA.hy926 cells with SphK1 knockdown, cell line 2 (SphK1-KD2). A Western blot analysis of SphK1 expression. Shown is a representative blot with duplicate samples, and the mean of four independent experiments performed in duplicates (means ± SEM; ****p < 0.0001 in one sample t-test). B, C Basal [Ca2+]i levels and Ca2+ increases induced by 1 µM thapsigargin were measured in fura-2-loaded cells in the presence (B) or absence (C) of extracellular Ca2+. Shown are representative traces of [Ca2+]i and means of 3 (B) or 4 (C) independent experiments. The response to thapsigargin was analyzed by measuring the [Ca2+]i increase above baseline (area under the curve, AUC) for 120 s after addition of thapsigargin (AUC 120 s). In C, 50 µM EGTA was added to the Ca2+-free buffer ~ 1 min before addition of thapsigargin (means ± SEM; **p < 0.01 Student’s t-test)
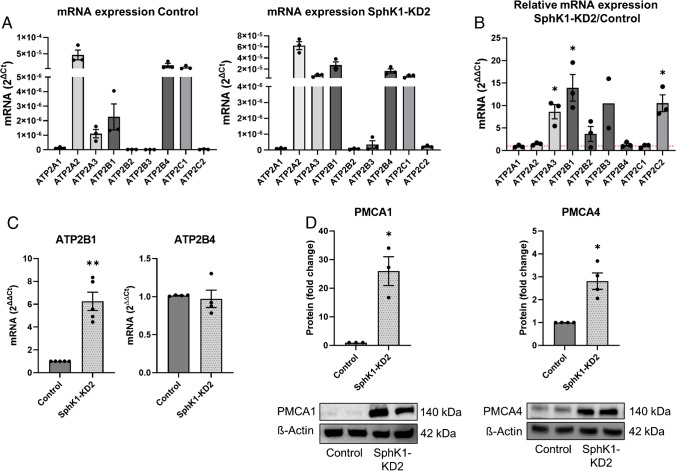
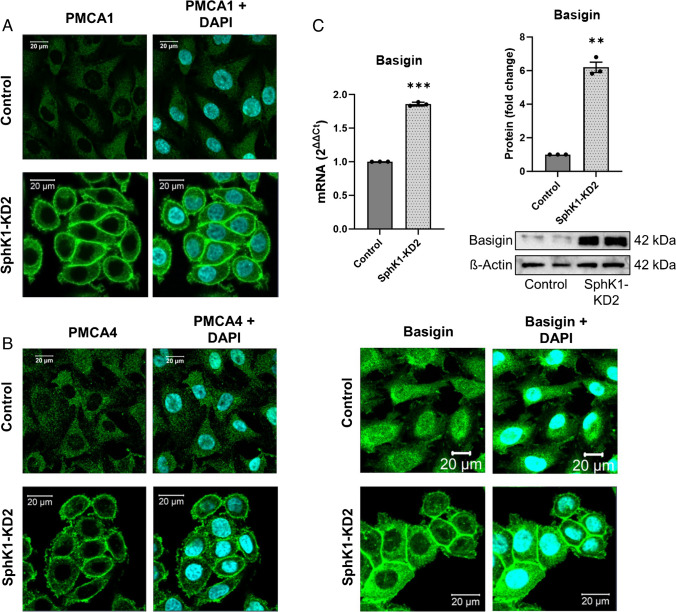
Resting cytosolic [Ca2+]i is kept low by the combined activities of the Ca2+ ATPases, SERCA, PMCA, and SPCA. Therefore, we measured the mRNA expression of Ca2+ ATPases by Taqman array (Fig. 3A, B). The results show that EA.hy926 control cells express mainly ATP2A2 (encoding SERCA2), ATP2B1 and 4, (PMCA1 and 4), and ATP2C1 (SPCA1). ATP2A1, ATP2B2, ATP2B3, and ATP2C2 were not detected on mRNA level, in agreement with their restriction to specific cell types [45, 40]. Figure 3B shows the relative changes of these mRNAs in SphK1-KD2 cells. Most importantly, the strongly expressed ATP2B1 was further upregulated in SphK1-depleted cells, whereas the other ATP2B isoforms were not significantly altered (Fig. 3B). Independent real-time PCR data confirmed that ATP2B1 mRNA was increased by ~ sixfold, while ATP2B4 mRNA was not altered (Fig. 3C). Furthermore, ATP2A3 and ATP2C2, only weakly expressed or nearly absent in control cells, were upregulated in SphK1-KD2 cells, although ATP2C2 mRNA was still very low (Fig. 3B). Remarkably, on protein level, PMCA1 was strongly increased by more than 20-fold in SphK1-KD2 cells (Fig. 3D). Although not regulated on mRNA level, PMCA4 protein was upregulated by ~ threefold (Fig. 3D). Furthermore, using immunostaining and confocal laser scanning microscopy, we observed a marked staining of PMCA1 and PMCA4 at the plasma membrane of EA.hy926 SphK1-KD2 cells, while there was only a weak non-specific background staining in control cells (Fig. 4A, B). Basigin (also known as CD147) and neuroplastin are two proteins that interact with PMCA enzymes and are regarded as “auxiliary subunits” of PMCA complexes [37]. They are interchangeably required for stability of PMCA complexes and their transport to the plasma membrane [37]. Figure 4C shows that, in SphK1-KD2 cells, indeed, not only PMCA1 and 4 but also basigin was strongly upregulated, both on mRNA and protein levels. Western blotting showed that basigin was expressed as a double band at ~ 42 kDa and was increased by ~ sixfold in SphK1-depleted cells. Immunocytochemistry and confocal microscopy revealed that there was some perinuclear and nuclear basigin staining in control cells, with only little plasma membrane localization, while there was a marked staining of basigin at the plasma membrane in SphK1-KD2 cells (Fig. 4C). Taken together, the marked upregulation of PMCA1 and PMCA4, together with basigin, explains very well the rapid removal of cytosolic Ca2+ in the presence of the SERCA inhibitor, thapsigargin, and the low basal [Ca2+]i in SphK1-depleted cells.
Fig. 3.
Expression of Ca2+-ATPases in SphK1-KD2 cells. A, B mRNA quantification by Taqman array (n = 3 independent experiments). A mRNA expression in control and SphK1-KD2 cells, shown as 2ΔCt. B mRNA expression in SphK1-KD2 relative to control cells, shown as 2ΔΔCt. C mRNA levels of ATP2B1 and ATP2B4: confirmation of Taqman array data by independent quantitative real-time PCR (n = 4). D Western blot analysis of PMCA1 and PMCA4 expression. Shown are representative blots from experiments performed in duplicates, and quantification of 3–4 independent experiments each. A–D All data represent means ± SEM and were analyzed by one-sample t-test (*p < 0.05; **p < 0.01)
Fig. 4.
Intracellular localization of PMCA1 and 4, and expression of its essential auxiliary subunit basigin. A–C Localization of PMCA1, PMCA4, and basigin was investigated by immunocytochemistry and confocal laser scanning microscopy. Shown are representative images (bars = 20 µm). C mRNA expression and protein levels of basigin were analyzed by quantitative real-time PCR and Western blotting, respectively. Shown are values from three independent experiments (means ± SEM; **p < 0.01; ***p < 0.001 in one sample t-test)
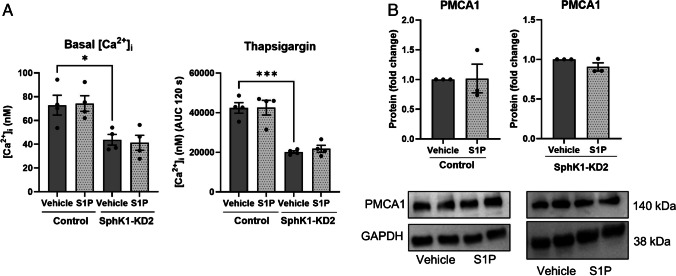
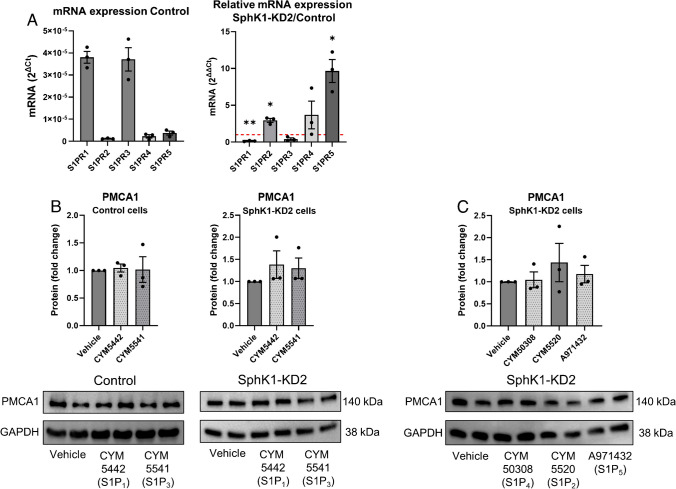
Next, we followed the hypothesis that G-protein-coupled S1P receptors regulated PMCA expression, and depletion of SphK1 decreased autocrine S1P signaling. Therefore, we tested the influence of externally added S1P on Ca2+ homeostasis and PMCA1 expression in SphK1-KD2 cells. As shown in Fig. 5A, incubation with 1 µM S1P for 16 h did not have any effect on basal [Ca2+]i, nor did it alter the response to thapsigargin, in both control and knockdown cells. In agreement, PMCA1 protein expression was unaltered by external S1P (Fig. 5B). There are many examples for antagonistic signaling of S1P receptor subtypes [4]. Therefore, it was possible that individual S1P receptor subtypes modulated PMCA1 expression in an opposing manner. Thus, we also tested the influence of selective S1P receptor agonists on PMCA1 expression (Fig. 6). Quantitative real-time PCR measurements revealed that S1P1 and S1P3 mRNAs were clearly the most abundant S1P receptor transcripts in control cells and that S1PR2 and S1PR5 were upregulated in SphK1-KD2 cells, while S1PR1 was downregulated (Fig. 6A). Of note, neither CYM5442 (S1P1) nor CYM5541 (S1P3) altered PMCA1 protein expression in control or SphK1-KD2 cells (Fig. 6B). Furthermore, neither CYM5520 (S1P2), CYM50308 (S1P4), nor A971432 (S1P5) had an influence on PMCA1 in SphK1-KD2 cells (Fig. 6C). Taken together, the data suggest that SphK1 knockdown modulated PMCA1 expression independently of S1P-GPCR.
Fig. 5.
No influence of external treatment with S1P on Ca2+ homeostasis and PMCA1 expression. A Basal [Ca2+]i and Ca2+ increases induced by 1 µM thapsigargin were analyzed after treatment with vehicle or 1 µM S1P for 16 h. Data are means of three independent experiments. Differences between the two cell types were analyzed by one-way ANOVA (means ± SEM; *p < 0.05; ***p < 0.001). B Protein expression of PMCA1 after treating control or SphK1-KD2 cells with vehicle or 1 µM S1P for 16 h, respectively. Shown are means from three independent experiments (means ± SEM)
Fig. 6.
No influence of specific S1P receptor agonists on PMCA1 expression. A mRNA expression of S1PR1-S1PR5 in control cells (shown as 2ΔCt) and SphK1-KD2 cells (shown as 2ΔΔCt, relative to control cells). B, C Protein expression of PMCA1 after treating control or SphK1-KD2 cells with vehicle, CYM5442 (1 µM), CYM5541 (1 µM), CYM50308 (1 µM), CYM5520 (5 µM), or A971432 (1 µM) for 16 h, respectively. Shown are values from three independent experiments (means ± SEM; *p < 0.05; **p < 0.01 in one sample t-test)
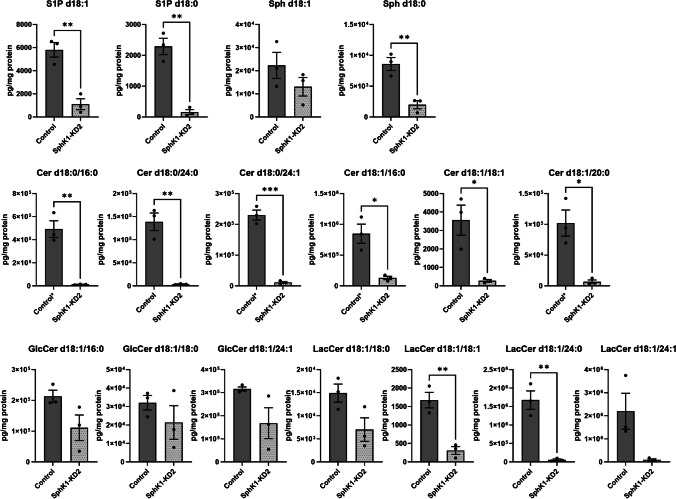
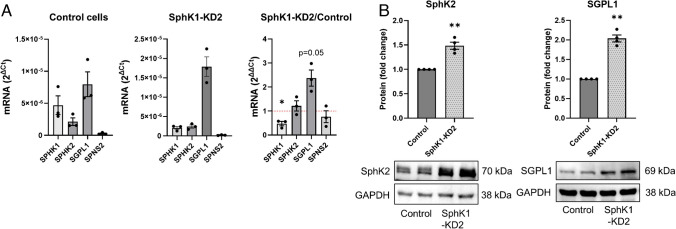
To address the question how SphK1 depletion altered sphingolipid concentrations in EA.hy926 cells, we analyzed the cells by LC–MS/MS. As expected, concentrations of S1P d18:1 and d18:0 were strongly reduced in SphK1-KD2 cells compared to control cells (Fig. 7). Interestingly, sphingosine d18:1 and d18:0 were not increased; sphingosine d18:0 (dihydro-sphingosine) was even significantly reduced. Intriguingly, all measured ceramides (d18:0/16:0, d18:0/24:0, d18:0/24:1, d18:1/16:0, d18:1/18:1, d18:1/20:0) were highly decreased in SphK1 knockdown cells (Fig. 7). In addition, certain lactosylceramides (d18:1/18:1, d18:1/24:0) were also strongly depleted (Fig. 7). Thus, despite the knockdown of SphK1, sphingolipids upstream of SphK did not accumulate, but in contrast were widely decreased. These data suggested that in the absence of SphK1, sphingolipid catabolism via SphK2 and SGPL1 led to a depletion of cellular sphingolipids in EA.hy926 cells. Taqman array data revealed that SPHK1 mRNA was reduced, in agreement with its knockdown, but SPHK2 mRNA was unaltered (Fig. 8A). The increase in SGPL1 mRNA was not significant (p = 0.05), while SPNS2 was nearly absent (Fig. 8A). However, Western blot analysis proved that both SphK2 and SGPL1 were upregulated on protein level (Fig. 8B). SphK2 appeared in two bands, likely splice variants [53], and was upregulated by ~ 1.5-fold, while SGPL1 was elevated by twofold (Fig. 8B). In summary, knockdown of SphK1 went along with upregulation of SphK2 and SGPL1 in EA.hy926 cells, leading to depletion of a wide range of sphingolipids. It remains unknown why the strong decrease particularly in S1P and ceramides obviously did not upregulate de novo sphingolipid synthesis.
Fig. 7.
Sphingolipid concentrations in control and SphK1-KD2 cells. S1P, sphingosine (Sph), ceramides (Cer), glucosylceramides (GlcCer), and lactosylceramides (LacCer) were measured by LC–MS/MS in control and SphK1-KD2 cells. Shown are values from three independent experiments (means ± SEM; *p < 0.05; **p < 0.01; ***p < 0.001 in Student’s t-test). Control*: concentrations of these ceramides were above the upper limit of quantification in control cells, but not in SphK1-KD2 cells. After critical evaluation, these values were considered usable because of good reproducibility and the large difference between control and SphK1-KD2 cells; however, they have to be regarded as semi-quantitative
Fig. 8.
Expression of SphK, SGPL1, and SPNS2. A mRNA expression was analyzed by Taqman array in control and SphK1-KD2 cells (n = 3 independent experiments; *p < 0.05). B Protein expression of SphK2 and SGPL1. Shown are representative blots and quantifications of four independent experiments each (means ± SEM; **p < 0.01 in one sample t-test)
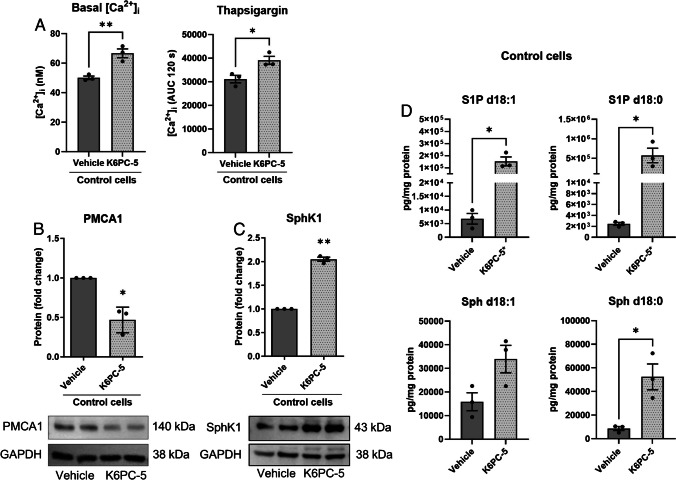
To further address the role of SphK1 for PMCA expression and Ca2+ homeostasis, we treated control cells with the SphK1 activator, K6PC-5. Interestingly, treatment with 50 µM K6PC-5 for 48 h significantly increased basal [Ca2+]i and augmented the response to thapsigargin in control cells (Fig. 9A). Furthermore, 50 µM K6PC-5 for 16 h reduced the expression of PMCA1 (Fig. 9B), which explains the effects on Ca2+ homeostasis. Interestingly, besides its known activity as stimulator of SphK1 activity, K6PC-5 also increased SphK1 protein expression in EA.hy926 control cells (Fig. 9C). In consequence, concentrations of S1P d18:1 were increased by > tenfold, and those of S1P d18:0 by > 100-fold by K6PC-5 (Fig. 9D). Sphingosine d18:0 was also significantly elevated (Fig. 9D). Taken together, it can be concluded that K6PC-5 caused effects in EA.hy926 control cells that were opposite to SphK1 knockdown.
Fig. 9.
Effects of the SphK1 activator, K6PC-5, in EA.hy926 control cells. A Basal [Ca2+]i and [Ca2+]i increases induced by 1 µM thapsigargin were analyzed after treatment with vehicle or 50 µM K6PC-5 for 48 h. Data are means of three independent experiments. Statistical analysis was performed by Student’s t-test (means ± SEM; n = 3; *p < 0.05; **p < 0.01). B, C Protein expression of PMCA1 (B) and SphK1 (C) after treatment of control cells with vehicle or 50 µM K6PC-5 for 16 h. Shown are means from three independent experiments (means ± SEM; n = 3; *p < 0.05; **p < 0.01 in one sample t-test). D Concentrations of S1P and sphingosine (Sph) after treatment with vehicle or 50 µM K6PC-5 for 16 h. Values are from three independent experiments (means ± SEM; *p < 0.05 in Student’s t-test). KCPC-5*: after treatment with K6PC-5, concentrations of S1P d18:1 and S1P d18:0 were above the upper limit of quantification. After critical evaluation, these values were considered usable because of good reproducibility and the large difference between control and treated cells; however, they have to be regarded as semi-quantitative
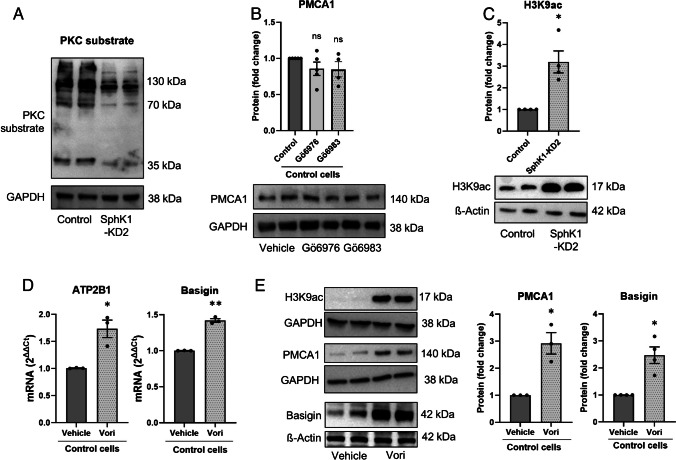
Only little is known about transcriptional regulation of PMCA1. Early studies had shown that PKC activation induced ATP2B1 mRNA transcription [24]. Since sphingosine is a known inhibitor of PKC [17], we hypothesized that the decrease in sphingosine d18:0 in EA.hy926 SphK1-KD cells might release PKC from inhibition and thereby upregulate ATP2B1 mRNA. However, as shown in Fig. 10A, PKC activity, detected with a phosphoserine-specific PKC substrate antibody, was clearly decreased in SphK1-KD2 cells. To address the possibility that the reduced PKC activity in SphK1-KD2 cells caused the increased expression of PMCA1, we treated control cells with either of the two PKC inhibitors, Gö6976 and Gö6983. While Gö6976 inhibits PKCα and PKCβ and a number of other kinases, Gö6983 has a higher specificity for PKCs and targets PKCα, β, δ, ε, η, and θ [1]. However, neither of the PKC inhibitors induced an upregulation of PMCA1 in EA.hy926 control cells (Fig. 10B). In conclusion, the reduced PKC activity in SphK1-KD2 cells is likely not the cause for PMCA1 upregulation, with the limitation that the inhibitors did not cover atypical PKC isoforms. On the contrary, the reduced PKC activity might be a consequence of the low resting [Ca2+]i which dampened the activity of the classical Ca2+-dependent PKC isoforms.
Fig. 10.
Mechanisms involved in transcriptional upregulation of PMCA1 in SphK1-KD2 cells. A Overall PKC activity was tested by Western blotting with an antibody directed at phosphorylated serine residues of PKC substrates in control and SphK1-KD2 cells. Shown is a representative experiment selected from 4 experiments with similar results. B Protein expression of PMCA1 in control cells after treatment with vehicle, 1 µM Gö6976 or 1 µM Gö6983 for 16 h (n = 4). C Analysis of H3K9 acetylation by Western blotting (n = 4). D, E Treatment of control EA.hy926 cells with 2 µM vorinostat (Vori) or vehicle for 24 h. D mRNA levels of ATP2B1 and basigin (n = 3). E H3K9 acetylation and protein expression of PMCA1 (n = 3) and basigin (n = 4). B, C, E Shown are representative blots and quantification of 3–4 independent experiments each (means ± SEM; n.s., not significant; *p < 0.05; **p < 0.01 in one sample t-test)
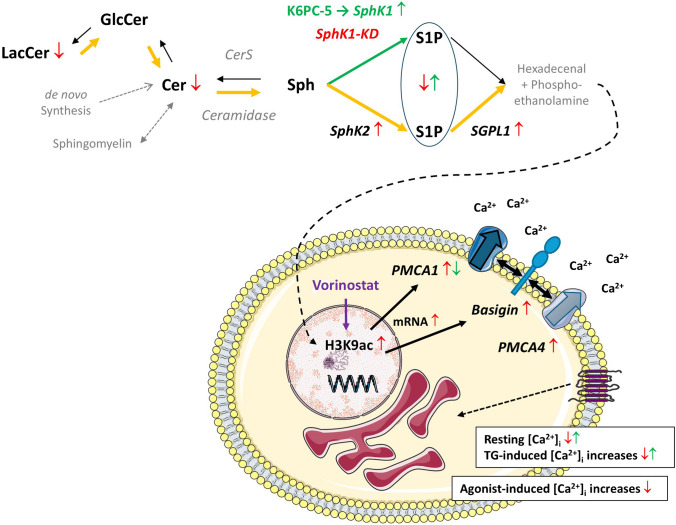
There are some reports that have shown that PMCA isoforms are differentially and in a cell-type-specific manner regulated by HDAC inhibitors (see for example [18, 33]). Since S1P metabolism may affect histone acetylation and thereby epigenetic regulation [16, 19, 54], we addressed the question whether histone acetylation was altered by knockdown of SphK1. Indeed, as shown in Fig. 10C, acetylation of histone-3 lysine-9 (H3K9) was clearly enhanced in SphK1-KD2 cells. Therefore, we further analyzed the influence of HDAC inhibition on expression of PMCA1 and basigin, using vorinostat (also known as suberoylanilide hydroxamic acid, SAHA). As shown in Fig. 10D, treatment with 2 µM vorinostat for 24 h caused a mild but significant upregulation of both ATP2B1 and basigin mRNA expression. Furthermore, vorinostat induced a strong increase in H3K9 acetylation and induced protein expression of both PMCA1 and basigin by ~ threefold and ~ 2.5-fold, respectively (Fig. 10E). These data support the hypothesis that transcription of ATP2B1 and basigin is induced by enhanced histone acetylation in EA.hy926 cells (Fig. 11).
Fig. 11.
Graphical summary of the alterations in sphingolipid concentrations and Ca2+ homeostasis in EA.hy926 cells with stable knockdown of SphK1. Enzymes and lipids written in gray letters have not been addressed in the present study. The lipid analysis did not differentiate between S1P derived from SphK1 or SphK2. In SphK1-KD cells (red arrows), the concentrations of S1P, ceramides (Cer), and lactosylceramides (LacCer) were decreased. SphK2 and SGPL1 were upregulated, suggesting that there was enhanced flux via the sphingolipid degradation pathway (orange arrows). Conversely, the SphK1 activator, K6PC-5 (green arrows), caused an upregulation of SphK1 and increased S1P concentrations. SphK1-KD cells had reduced resting [Ca2+]i and diminished [Ca2+]i increases in response to thapsigargin (TG) and diverse GPCR agonists. In agreement, PMCA1 and its auxiliary subunit, basigin, were upregulated on mRNA and protein levels. Basigin is known to stabilize PMCA complexes and probably contributed to the increase in PMCA4 protein. Transcriptional regulation of PMCA1 and basigin was associated with enhanced histone acetylation (specifically, H3K9ac) and mimicked by the HDAC inhibitor, vorinostat. Conversely, K6PC-5 caused a decrease in PMCA1 expression and elevated both resting [Ca2+]i and thapsigargin-induced [Ca2+]i increases. Recently published data [11] show that hexadecenal, the product of SGPL1, induced HDAC inhibition, and we propose that this was the mechanism of enhanced histone acetylation in SphK1-KD cells
Discussion
Both acute receptor-induced Ca2+ signaling and long-term alterations in cellular Ca2+ homeostasis have been attributed to intracellular S1P and its formation and degradation. For example, in embryonic fibroblasts from Sgpl1-deficient mice, resting [Ca2+]i and Ca2+ storage were elevated, and agonist-induced [Ca2+]i increases were accordingly enhanced [7, 19]. Also, in INS1E rat insulinoma cells, knockdown of Sgpl1 increased [Ca2+]i, measured with the Ca2+ sensor Case12, while Sgpl1 overexpression slightly reduced [Ca2+]i [15]. In contrast, SphK/S1P signaling has been viewed as a potential second messenger pathway, mediating acute agonist-induced [Ca2+]i increases (reviewed in [48]). However, the results of these early studies are questionable since the specificity of the applied SphK inhibitors was low [22, 9]. Therefore, we revisited here the role of SphK1 in GPCR-induced Ca2+ signaling. We show that shRNA-mediated knockdown of SphK1 in EA.hy926 cells caused a marked reduction in agonist-induced [Ca2+]i increases, both in the absence and presence of extracellular Ca2+, while agonist-stimulated inositol phosphate production, exemplarily measured for histamine, was not altered. Although this observation was in line with SphK1/S1P serving as signal transduction pathway for Ca2+ mobilization, further results did not match: in both of our two lines of EA.hy926 cells with stable knockdown of SphK1, basal [Ca2+]i and [Ca2+]i increases by the SERCA inhibitor, thapsigargin, were reduced. Thus, we demonstrate that besides SGPL1, also SphK1 can have a profound long-term effect on cellular Ca2+ homeostasis. We furthermore conclude that a specific role for SphK1 in acutely transmitting [Ca2+]i increases by GPCR agonists cannot be studied using this genetic model of SphK1 deficiency.
It is highly likely that more than 20-fold upregulation of PMCA1 protein in SphK1-KD2 cells, supported by the ~ threefold upregulation of PMCA4, is the causative factor for the alterations in Ca2+ homeostasis in EA.hy926 SphK1 knockdown cells. In particular, the rapid clearing of cytosolic Ca2+ after treatment with thapsigargin in the absence of extracellular Ca2+ is likely due to Ca2+ extrusion via PMCA, since Ca2+ uptake into the ER via SERCA and alterations in Ca2+ influx are precluded under these conditions. Also, the low resting [Ca2+]i can be explained by the strong expression of PMCA1 and 4. However, we cannot fully exclude a role for SPCA. The mRNA data show that ATP2C1 (encoding SPCA1), the prevailing ATP2C isoform in EA.hy926 cells, was not altered in SphK1-KD2 cells. Nevertheless, protein levels of these pumps may be regulated independently of mRNA. Furthermore, besides PMCA, another mechanism for extrusion of Ca2+ across the plasma membrane is provided by the Na+/Ca2+ exchanger. This protein is particularly important for removal of high [Ca2+]i after depolarization of excitable cells such as muscle and nerve cells [46]. However, with its relatively low affinity for Ca2+, the Na+/Ca2+ exchanger is unlikely to reduce resting [Ca2+]i levels below 100 nM in EA.hy926 SphK1 knockdown cells. It is rather PMCA, with its generally high Ca2+ affinity, which maintains the low resting [Ca2+]i [46]. Thus, the decrease in resting [Ca2+]i in SphK1-KD cells points towards the observed strong PMCA1 upregulation as underlying mechanism.
As a consequence of PMCA upregulation, two main mechanisms may contribute to the observed reduction of agonist-induced [Ca2+]i increases in SphK1-KD1 cells: again, the rapid clearing of cytosolic Ca2+, and a reduced storage of Ca2+ in the ER. It is not very likely that the rapid peak responses to GPCR agonists, which were reached within 3–5 s, were that much decreased by PMCA activity as observed. Therefore, we conclude that there was less Ca2+ stored in the ER, potentially as a consequence of the reduced basal [Ca2+]i. Thapsigargin-induced [Ca2+]i increases would then be attenuated by both enhanced clearing and reduced storage of Ca2+. However, we cannot exclude that SERCA activity was decreased and/or IP3 receptor sensitivity was altered in SphK1-depleted cells. The mRNA data show that the mainly expressed ATP2A2 (encoding SERCA2) was unaltered, but the less abundant ATP2A3 (SERCA3) was upregulated. Importantly, SERCA activity is regulated by many factors even in the absence of alterations in protein expression [45]. To address the above-mentioned questions, expression and activity of SERCA isoforms and IP3 receptors would have to be analyzed. However, in the light of the massive PMCA1 upregulation, we consider this as beyond the scope of the present study.
The activity of PMCA isoforms is differentially regulated by interactions with diverse proteins and lipids (for review, see [47, 55]). For example, PMCA activity was reduced and [Ca2+]i was elevated in hippocampal neurons of mice with knockout of acid sphingomyelinase, while PMCA expression was not altered [33]. Furthermore, erythrocyte PMCA was activated by ceramide and inhibited by sphingosine [8, 44]; however, both ceramides and sphingosine d18:0 were decreased in SphK1-KD2 cells. Beyond these effects, our data show an upregulation of PMCA1 and PMCA4 protein expression in EA.hy926 SphK1-KD2 cells. Of note, PMCA1 was transcriptionally induced, with increase in both mRNA and protein, while PMCA4 was upregulated only on protein level with unaltered mRNA. In this regard, it might be important that basigin was markedly upregulated in SphK1-KD2 cells, both on mRNA and protein level. Basigin, and also the related neuroplastin, associates with PMCA in tetrameric complexes composed of two PMCA and two basigin or neuroplastin molecules [37, 13]. Basigin is a multifunctional transmembrane glycoprotein with two or three extracellular immunoglobulin domains that interacts with a wide number of proteins [28, 21]. By these interactions, which involve basigin’s transmembrane region, it stabilizes the interacting proteins, protects them from degradation, and facilitates their plasma membrane localization [21]. Therefore, it is reasonable to assume that the upregulation of basigin stabilized PMCA4 protein and enhanced its expression in the absence of ATP2B4 mRNA upregulation. It is furthermore likely that also the high PMCA1 protein expression was in part due to stabilization by basigin.
It remains the question how the transcription of PMCA1 and basigin was enhanced in SphK1-KD2 cells. Our data suggest that this occurred via altered histone acetylation, since H3K9 acetylation was enhanced in SphK1-KD2, and the HDAC inhibitor, vorinostat, increased transcription of ATP2B1 and basigin. It is already known that PMCA transcription can be induced by application of HDAC inhibitors such as vorinostat, also known as SAHA [18, 33]. Of note, by increasing PMCA expression, vorinostat counteracted sphingomyelin-induced PMCA inhibition in acid sphingomyelinase-deficient neurons [33]. Altered histone acetylation induced by S1P metabolism/intracellular S1P was first shown for nuclear SphK2 that provided S1P for direct binding to and inhibition of HDAC1 and HDAC2 [16]. Since then, a functional role for SphK2-dependent histone acetylation has been demonstrated in various conditions, for example, in the pathogenesis of pulmonary hypertension [35], or in kidney fibrosis [20]. Enhanced histone acetylation was also observed after depletion of Sgpl1, for example, in embryonic fibroblasts from Sgpl1 knockout mice [19], or in hippocampus, cortex and primary astrocytes of mice with nestin-Cre-dependent deletion of Sgpl1 [54]. These studies suggested that nuclear S1P, produced by SphK2 or accumulated in Sgpl1 deficiency, directly inhibited class I HDACs. However, SphK1-KD2 cells had very low concentrations of S1P. Although it might be possible that upregulation of SphK2 in SphK1-KD2 cells led to a local formation of S1P in the nucleus, not detectable in global cellular S1P measurements, we suggest that there is rather a different mechanism acting in these cells. Recent work has shown that the product of Sgpl1, hexadecenal, is a direct HDAC inhibitor [11]. Hexadecenal is a highly reactive molecule known to form protein adducts (see, e.g., [38]) and was shown to react with HDAC1 [11]. In our work on EA.hy926 cells with SphK1 knockdown, we did not address hexadecenal as the potential mediator of the observed histone acetylation. Yet, both SphK2 and SGPL1 were upregulated in SphK1-KD2, and the depletion of S1P, sphingosine, ceramides, and certain glycosphingolipids suggests a high metabolic flux via the two enzymes. Obviously, this will lead to enhanced formation of hexadecenal, at least transiently. We therefore suggest that this mechanism caused HDAC inhibition in SphK1-KD2 cells despite reduced levels of S1P.
EA.hy926 cells have previously been used to show that treatment with NO donors increased SphK1 expression, and knockdown of SphK1 attenuated NO-dependent migration and tube formation in these cells [39]. Whether the upregulation of PMCA1 or PMCA4 observed here contributed to this phenotype remains unclear, since these two PMCA isoforms had opposite effects on endothelial cell migration and angiogenesis: PMCA1 silencing in HUVEC increased [Ca2+]i and enhanced endothelial NO synthase activity [26], but decreased viability, migration, and tube formation in response to VEGF [29]. In contrast, endothelial cells from PMCA4 knockout mice displayed enhanced migration, while overexpression of PMCA4 suppressed VEGF-induced migration and angiogenesis [2].
Taken together, our data for the first time demonstrate a regulation of PMCA expression by cellular S1P metabolism. SphK1 knockdown in EA.hy926 cells caused complex alterations in cellular sphingolipid homeostasis, which finally altered histone acetylation and thereby induced the expression of PMCA1 and its accessory protein, basigin. Although targeting SphK1 might be a promising approach for compensating PMCA1 loss-of-function mutations by upregulating the protein, we assume that the observed sphingolipid alterations in EA.hy926 cells are probably cell-type specific. Further work is required to understand fully how S1P metabolism targets PMCA and regulates Ca2+ homeostasis in different cell types.
Acknowledgements
The expert technical assistance of Nicole Kämpfer-Kolb and Agnes Rudowski is gratefully acknowledged. We are indebted to Dr. Gergely Imre (South Dakota State University, Brookings, South Dakota, USA) for sharing EA.hy926 SphK1-KD2 cells. Parts of Fig. 11 were taken from Servier Medical Art (https://smart.servier.com), license CC BY 4.0 (https://creativecommons.org/licenses/by/4.0/, accessed 21 August 2024).
Author contribution
Conceptualization, DMZH; acquisition of the data, LMV, JEB, ST, DT; resources, DMZH, JP; evaluation and discussion of the data, LMV, JEB, ST, DT, StS, JP, DMZH; writing, LMV, DMZH. All authors have read the manuscript and agreed to its final version.
Funding
Open Access funding enabled and organized by Projekt DEAL. This work was funded by the Deutsche Forschungsgemeinschaft (SFB1039).
Data availability
Data is provided within the manuscript.
Declarations
Conflict of interest
The authors declare no competing interests.
Footnotes
This article is part of the special issue on Signalling by Fatty Acid Derivatives and Sphingolipids in Health and Disease in Pflügers Archiv—European Journal of Physiology.
This article is dedicated to our friend and colleague, Andrea Huwiler, who passed away in December 2023. We gratefully acknowledge the lively and ingenious scientific discussions we shared with her during many years.
Publisher's Note
Springer Nature remains neutral with regard to jurisdictional claims in published maps and institutional affiliations.
References
- 1.Anastassiadis T, Deacon SW, Devarajan K et al (2011) Comprehensive assay of kinase catalytic activity reveals features of kinase inhibitor selectivity. Nat Biotechnol 29:1039–1045. 10.1038/nbt.2017 [DOI] [PMC free article] [PubMed] [Google Scholar]
- 2.Baggott RR, Alfranca A, López-Maderuelo D et al (2014) Plasma membrane calcium ATPase isoform 4 inhibits vascular endothelial growth factor-mediated angiogenesis through interaction with calcineurin. Arterioscler Thromb Vasc Biol 34:2310–2320. 10.1161/ATVBAHA.114.304363 [DOI] [PubMed] [Google Scholar]
- 3.Berridge MJ (2012) Calcium signalling remodelling and disease. Biochem Soc Trans 40:297–309. 10.1042/BST20110766 [DOI] [PubMed] [Google Scholar]
- 4.Blaho VA, Hla T (2014) An update on the biology of sphingosine 1-phosphate receptors. J Lipid Res 55:1596–1608. 10.1194/jlr.R046300 [DOI] [PMC free article] [PubMed] [Google Scholar]
- 5.Blankenbach KV, Bruno G, Wondra E et al (2020) The WD40 repeat protein, WDR36, orchestrates sphingosine kinase-1 recruitment and phospholipase C-β activation by Gq-coupled receptors. Biochim Biophys Acta Mol Cell Biol Lipids 1865:158704. 10.1016/j.bbalip.2020.158704 [DOI] [PubMed] [Google Scholar]
- 6.Cartier A, Hla T (2019) Sphingosine 1-phosphate: lipid signaling in pathology and therapy. Science 366:aar5551. 10.1126/science.aar5551 [DOI] [PMC free article] [PubMed] [Google Scholar]
- 7.Claas RF, ter Braak M, Hegen B et al (2010) Enhanced Ca2+ storage in sphingosine-1-phosphate lyase-deficient fibroblasts. Cell Signal 22:476–483. 10.1016/j.cellsig.2009.11.001 [DOI] [PubMed] [Google Scholar]
- 8.Colina C, Cervino V, Benaim G (2002) Ceramide and sphingosine have an antagonistic effect on the plasma-membrane Ca2+-ATPase from human erythrocytes. Biochemical Journal 362:247–251. 10.1042/bj3620247 [DOI] [PMC free article] [PubMed] [Google Scholar]
- 9.Coward J, Ambrosini G, Musi E et al (2009) Safingol (L-threo-sphinganine) induces autophagy in solid tumor cells through inhibition of PKC and the PI3-kinase pathway. Autophagy 5:184–193. 10.4161/auto.5.2.7361 [DOI] [PubMed] [Google Scholar]
- 10.Diaz Escarcega R, McCullough LD, Tsvetkov AS (2021) The functional role of sphingosine kinase 2. Front Mol Biosci 8:683767. 10.3389/fmolb.2021.683767 [DOI] [PMC free article] [PubMed] [Google Scholar]
- 11.Ebenezer DL, Ramchandran R, Fu P et al (2021) Nuclear sphingosine-1-phosphate lyase generated ∆2-hexadecenal is a regulator of HDAC activity and chromatin remodeling in lung epithelial cells. Cell Biochem Biophys 79:575–592. 10.1007/s12013-021-01005-9 [DOI] [PMC free article] [PubMed] [Google Scholar]
- 12.Ghosh TK, Bian J, Gill DL (1994) Sphingosine 1-phosphate generated in the endoplasmic reticulum membrane activates release of stored calcium. J Biol Chem 269:22628–22635 (PMID: 8077214) [PubMed] [Google Scholar]
- 13.Gong D, Chi X, Ren K et al (2018) Structure of the human plasma membrane Ca2+-ATPase 1 in complex with its obligatory subunit neuroplastin. Nat Commun 9:3623. 10.1038/s41467-018-06075-7 [DOI] [PMC free article] [PubMed] [Google Scholar]
- 14.Grynkiewicz G, Poenie M, Tsien RY (1985) A new generation of Ca2+ indicators with greatly improved fluorescence properties. J Biol Chem 260:3440–3450 (PMID: 3838314) [PubMed] [Google Scholar]
- 15.Hahn C, Tyka K, Saba JD et al (2017) Overexpression of sphingosine-1-phosphate lyase protects insulin-secreting cells against cytokine toxicity. J Biol Chem 292:20292–20304. 10.1074/jbc.M117.814491 [DOI] [PMC free article] [PubMed] [Google Scholar]
- 16.Hait NC, Allegood J, Maceyka M et al (2009) Regulation of histone acetylation in the nucleus by sphingosine-1-phosphate. Science 325:1254–1257. 10.1126/science.1176709 [DOI] [PMC free article] [PubMed] [Google Scholar]
- 17.Hannun YA, Bell RM (1989) Regulation of protein kinase C by sphingosine and lysosphingolipids. Clin Chim Acta 185:333–345. 10.1016/0009-8981(89)90224-6 [DOI] [PubMed] [Google Scholar]
- 18.Hegedüs L, Padányi R, Molnár J et al (2017) Histone deacetylase inhibitor treatment increases the expression of the plasma membrane Ca2+ pump PMCA4b and inhibits the migration of melanoma cells independent of ERK. Front Oncol 7:95. 10.3389/fonc.2017.00095 [DOI] [PMC free article] [PubMed] [Google Scholar]
- 19.Ihlefeld K, Claas RF, Koch A et al (2012) Evidence for a link between histone deacetylation and Ca2+ homoeostasis in sphingosine-1-phosphate lyase-deficient fibroblasts. Biochem J 447:457–464. 10.1042/BJ20120811 [DOI] [PubMed] [Google Scholar]
- 20.Inoue T, Nakamura Y, Tanaka S et al (2022) Bone marrow stromal cell antigen-1 (CD157) regulated by sphingosine kinase 2 mediates kidney fibrosis. Front Med (Lausanne) 9:993698. 10.3389/fmed.2022.993698 [DOI] [PMC free article] [PubMed] [Google Scholar]
- 21.Kendrick AA, Schafer J, Dzieciatkowska M et al (2017) CD147: a small molecule transporter ancillary protein at the crossroad of multiple hallmarks of cancer and metabolic reprogramming. Oncotarget 8:6742–6762. 10.18632/oncotarget.14272 [DOI] [PMC free article] [PubMed] [Google Scholar]
- 22.Kim H-L, Sacket SJ, Han M et al (2008) Characterization of N, N,-dimethyl-D-erythro-sphingosine-induced apoptosis and signaling in U937 cells: independence of sphingosine kinase inhibition. Prostaglandins Other Lipid Mediat 86:18–25. 10.1016/j.prostaglandins.2008.01.001 [DOI] [PubMed] [Google Scholar]
- 23.Kobayashi Y, Hirawa N, Tabara Y et al (2012) Mice lacking hypertension candidate gene ATP2B1 in vascular smooth muscle cells show significant blood pressure elevation. Hypertension 59:854–860. 10.1161/HYPERTENSIONAHA.110.165068 [DOI] [PubMed] [Google Scholar]
- 24.Kuo TH, Wang KK, Carlock L et al (1991) Phorbol ester induces both gene expression and phosphorylation of the plasma membrane Ca2+ pump. J Biol Chem 266:2520–2525 [PubMed] [Google Scholar]
- 25.Little R, Zi M, Hammad SK et al (2017) Reduced expression of PMCA1 is associated with increased blood pressure with age which is preceded by remodelling of resistance arteries. Aging Cell 16:1104–1113. 10.1111/acel.12637 [DOI] [PMC free article] [PubMed] [Google Scholar]
- 26.Long Y, Chen S-W, Gao C-L et al (2018) ATP2B1 gene silencing increases NO production under basal conditions through the Ca2+/calmodulin/eNOS signaling pathway in endothelial cells. Hypertens Res 41:246–252. 10.1038/s41440-018-0012-x [DOI] [PubMed] [Google Scholar]
- 27.Mattie M, Brooker G, Spiegel S (1994) Sphingosine-1-phosphate, a putative second messenger, mobilizes calcium from internal stores via an inositol trisphosphate-independent pathway. J Biol Chem 269:3181–3188 [PubMed] [Google Scholar]
- 28.Muramatsu T (2016) Basigin (CD147), a multifunctional transmembrane glycoprotein with various binding partners. J Biochem 159:481–490. 10.1093/jb/mvv127 [DOI] [PMC free article] [PubMed] [Google Scholar]
- 29.Njegic A, Swiderska A, Marris C et al (2021) Plasma membrane calcium ATPase 1 regulates human umbilical vein endothelial cell angiogenesis and viability. J Mol Cell Cardiol 156:79–81. 10.1016/j.yjmcc.2021.03.011 [DOI] [PMC free article] [PubMed] [Google Scholar]
- 30.Obinata H, Hla T (2019) Sphingosine 1-phosphate and inflammation. Int Immunol 31:617–625. 10.1093/intimm/dxz037 [DOI] [PMC free article] [PubMed] [Google Scholar]
- 31.Okamoto H, Takuwa N, Gonda K et al (1998) EDG1 is a functional sphingosine-1-phosphate receptor that is linked via a Gi/o to multiple signaling pathways, including phospholipase C activation, Ca2+ mobilization, Ras-mitogen-activated protein kinase activation, and adenylate cyclase inhibition. J Biol Chem 273:27104–27110. 10.1074/jbc.273.42.27104 [DOI] [PubMed] [Google Scholar]
- 32.Panneer Selvam S, de Palma RM, Oaks JJ et al (2015) Binding of the sphingolipid S1P to hTERT stabilizes telomerase at the nuclear periphery by allosterically mimicking protein phosphorylation. Sci Signal 8:ra58. 10.1126/scisignal.aaa4998 [DOI] [PMC free article] [PubMed] [Google Scholar]
- 33.Pérez-Cañamás A, Benvegnù S, Rueda CB et al (2017) Sphingomyelin-induced inhibition of the plasma membrane calcium ATPase causes neurodegeneration in type A Niemann-Pick disease. Mol Psychiatry 22:711–723. 10.1038/mp.2016.148 [DOI] [PubMed] [Google Scholar]
- 34.Pyne S, Adams DR, Pyne NJ (2016) Sphingosine 1-phosphate and sphingosine kinases in health and disease: recent advances. Prog Lipid Res 62:93–106. 10.1016/j.plipres.2016.03.001 [DOI] [PubMed] [Google Scholar]
- 35.Ranasinghe ADCU, Holohan M, Borger KM et al (2023) Altered smooth muscle cell histone acetylome by the SPHK2/S1P axis promotes pulmonary hypertension. Circ Res 133:704–719. 10.1161/CIRCRESAHA.123.322740 [DOI] [PMC free article] [PubMed] [Google Scholar]
- 36.Saba JD (2019) Fifty years of lyase and a moment of truth: sphingosine phosphate lyase from discovery to disease. J Lipid Res 60:456–463. 10.1194/jlr.S091181 [DOI] [PMC free article] [PubMed] [Google Scholar]
- 37.Schmidt N, Kollewe A, Constantin CE et al (2017) Neuroplastin and basigin are essential auxiliary subunits of plasma membrane Ca2+-ATPases and key regulators of Ca2+ clearance. Neuron 96:827-838.e9. 10.1016/j.neuron.2017.09.038 [DOI] [PubMed] [Google Scholar]
- 38.Schumacher F, Neuber C, Finke H et al (2017) The sphingosine 1-phosphate breakdown product, (2E)-hexadecenal, forms protein adducts and glutathione conjugates in vitro. J Lipid Res 58:1648–1660. 10.1194/jlr.M076562 [DOI] [PMC free article] [PubMed] [Google Scholar]
- 39.Schwalm S, Pfeilschifter J, Huwiler A (2010) Sphingosine kinase 1 is critically involved in nitric oxide-mediated human endothelial cell migration and tube formation. Br J Pharmacol 160:1641–1651. 10.1111/j.1476-5381.2010.00818.x [DOI] [PMC free article] [PubMed] [Google Scholar]
- 40.Stafford N, Wilson C, Oceandy D et al (2017) The plasma membrane calcium ATPases and their role as major new players in human disease. Physiol Rev 97:1089–1125. 10.1152/physrev.00028.2016 [DOI] [PubMed] [Google Scholar]
- 41.Strub GM, Maceyka M, Hait NC et al (2010) Extracellular and intracellular actions of sphingosine-1-phosphate. Adv Exp Med Biol 688:141–155. 10.1007/978-1-4419-6741-1_10 [DOI] [PMC free article] [PubMed] [Google Scholar]
- 42.Strub GM, Paillard M, Liang J et al (2011) Sphingosine-1-phosphate produced by sphingosine kinase 2 in mitochondria interacts with prohibitin 2 to regulate complex IV assembly and respiration. FASEB J 25:600–612. 10.1096/fj.10-167502 [DOI] [PMC free article] [PubMed] [Google Scholar]
- 43.Timmann C, Thye T, Vens M et al (2012) Genome-wide association study indicates two novel resistance loci for severe malaria. Nature 489:443–446. 10.1038/nature11334 [DOI] [PubMed] [Google Scholar]
- 44.von Wnuck Lipinski K, Weske S, Keul P et al (2017) Hepatocyte nuclear factor 1A deficiency causes hemolytic anemia in mice by altering erythrocyte sphingolipid homeostasis. Blood 130:2786–2798. 10.1182/blood-2017-03-774356 [DOI] [PubMed] [Google Scholar]
- 45.Xu H, van Remmen H (2021) The SarcoEndoplasmic Reticulum Calcium ATPase (SERCA) pump: a potential target for intervention in aging and skeletal muscle pathologies. Skelet Muscle 11:25. 10.1186/s13395-021-00280-7 [DOI] [PMC free article] [PubMed] [Google Scholar]
- 46.Brini M, Carafoli E (2011) The plasma membrane Ca2+ ATPase and the plasma membrane sodium calcium exchanger cooperate in the regulation of cell calcium. Cold Spring Harb Perspect Biol 3. 10.1101/cshperspect.a004168 [DOI] [PMC free article] [PubMed]
- 47.Krebs J (2022) Structure, function and regulation of the plasma membrane calcium pump in health and disease. Int J Mol Sci 23. 10.3390/ijms23031027 [DOI] [PMC free article] [PubMed]
- 48.Meyer Zu Heringdorf D (2004) Lysophospholipid receptor-dependent and -independent calcium signaling. J Cell Biochem 92:937–948. 10.1002/jcb.20107 [DOI] [PubMed]
- 49.Meyer Zu Heringdorf D, Liliom K, Schaefer M et al. (2003) Photolysis of intracellular caged sphingosine-1-phosphate causes Ca2+ mobilization independently of G-protein-coupled receptors. FEBS Lett 554:443–449. 10.1016/s0014-5793(03)01219-5 [DOI] [PubMed]
- 50.Vienken H, Mabrouki N, Grabau K et al. (2017) Characterization of cholesterol homeostasis in sphingosine-1-phosphate lyase-deficient fibroblasts reveals a Niemann-Pick disease type C-like phenotype with enhanced lysosomal Ca2+ storage. Sci Rep 7. 10.1038/srep43575 [DOI] [PMC free article] [PubMed]
- 51.Imre G, Krähling V, Eichler M et al. (2021) The sphingosine kinase 1 activator, K6PC-5, attenuates Ebola virus infection. iScience 24. 10.1016/j.isci.2021.102266 [DOI] [PMC free article] [PubMed]
- 52.Spohner AK, Jakobi K, Trautmann S et al. (2021) Mouse liver compensates loss of Sgpl1 by secretion of sphingolipids into blood and bile. Int J Mol Sci 22. 10.3390/ijms221910617 [DOI] [PMC free article] [PubMed]
- 53.Haddadi N, Lin Y, Simpson AM et al. (2017) “Dicing and splicing” sphingosine kinase and relevance to cancer. Int J Mol Sci 18. 10.3390/ijms18091891 [DOI] [PMC free article] [PubMed]
- 54.Alam S, Piazzesi A, Abd El Fatah M et al. (2020) Neurodegeneration caused by S1P-lyase deficiency involves calcium-dependent tau pathology and abnormal histone acetylation. Cells 9. 10.3390/cells9102189 [DOI] [PMC free article] [PubMed]
- 55.Conrard L, Tyteca D (2019) Regulation of membrane calcium transport proteins by the surrounding lipid environment. Biomolecules 9. 10.3390/biom9100513 [DOI] [PMC free article] [PubMed]
Associated Data
This section collects any data citations, data availability statements, or supplementary materials included in this article.
Data Availability Statement
Data is provided within the manuscript.


