Abstract
We describe important advances in methodologies for the analysis of multiwavelength data. In contrast to the Beckman-Coulter XL-A/I ultraviolet–visible light detector, multiwavelength detection is able to simultaneously collect sedimentation data for a large wavelength range in a single experiment. The additional dimension increases the data density by orders of magnitude, posing new challenges for data analysis and management. The additional data not only improve the statistics of the measurement but also provide new information for spectral characterization, which complements the hydrodynamic information. New data analysis and management approaches were integrated into the UltraScan software to address these challenges. In this chapter, we describe the enhancements and benefits realized by multiwavelength analysis and compare the results to those obtained from the traditional single-wavelength detector. We illustrate the advances offered by the new instruments by comparing results from mixtures that contain different ratios of protein and DNA samples, representing analytes with distinct spectral and hydrodynamic properties. For the first time, we demonstrate that the spectral dimension not only adds valuable detail, but when spectral properties are known, individual components with distinct spectral properties measured in a mixture by the multiwavelength system can be clearly separated and decomposed into traditional datasets for each of the spectrally distinct components, even when their sedimentation coefficients are virtually identical.
1. INTRODUCTION
Analytical ultracentrifugation (AUC) has long been an indispensable tool for the characterization of macromolecules in the solution phase. The study of molecules in the solution phase permits the investigator to closely replicate physiological conditions; modulate solution conditions such as pH, ionic strength, and redox potential; or investigate the effect of added ligands or drugs. Biopolymers such as nucleic acids and proteins exhibit distinct spectra that offer potential for high resolution by multiwavelength detection in the AUC instrument. A plethora of options exist to impart additional unique chromophores to systems under investigation: Heme proteins offer unique spectral information in the visible range, and many nanoparticles exhibit size-dependent spectral changes. It is common practice to modify nucleic acids and proteins by attaching fluorescent tags to add unique chromophores. Fusion proteins with green, yellow, or red fluorescent protein allow the investigator to express color-coded proteins in vivo. Traditional AUC detectors reveal information about the hydrodynamic parameters of the analytes in solution. Subject to limitations in the resolution of the analysis method and the quality of the data, it is possible to extract several parameters for each analyte present in a mixture when performing sedimentation velocity (SV) experiments: the sedimentation and diffusion coefficients, and the partial concentration (Demeler et al., 2014; Correia & Stafford, 2015). A further interpretation of these parameters to obtain molecular weight and anisotropy is possible if the partial specific volume of the analyte as well as the buffer density and viscosity is known. If two molecules interact, their interactions give rise to mixtures of free and complexed species, each with unique hydrodynamic properties. These properties can also be extracted, yielding information such as stoichiometry of association and binding strengths of such interactions. For large molecules, and slow interactions, even rate constants can be obtained (Demeler, Brookes, Wang, Schirf, & Kim, 2010; Correia & Stafford, 2015). With increases in computer power, new high-resolution analysis methods were developed in our laboratory (Brookes, Boppana, & Demeler, 2006; Brookes, Cao, & Demeler, 2010; Brookes & Demeler, 2006, 2007, 2008; Demeler & Brookes, 2008; Demeler, Brookes, & Nagel-Steger, 2009; Demeler et al., 2010, 2014; Gorbet et al., 2014) that allow investigators to characterize increasingly complex mixtures and interactions between molecules. Here, we discuss the application of those analysis methods to data obtained from the open AUC multiwavelength detector described earlier (Bhattacharyya et al., 2006; Pearson et al., 2015; Strauss et al., 2008; Walter et al., 2014) and show how these advances will further broaden the appeal of AUC and open up new avenues for the analysis of ever more complex systems.
2. COMPUTATIONAL TREATMENT OF MULTIWAVELENGTH DATA
2.1. Data Representation
The increase in data density from the new multiwavelength detector poses major challenges to the management and analysis of multiwavelength data (MWLD). Instead of a single-wavelength, three-dimensional (3D) dataset of time, radius, and absorbance, the additional spectral dimension multiplies the traditional dataset size by hundreds of wavelengths. The original ASCII-based format from the XL-A’s Beckman-Coulter data acquisition software for storing sedimentation data is no longer suitable for the large amount of data stored in multiwavelength experiments due to inherent inefficiencies present in ASCII formatted storage. While alternatives have been proposed that retain the legacy ASCII format (Walter et al., 2015), we feel that a binary format is much more suitable, providing rapid loading, efficient storage, and reduced network transfer speeds. The open AUC standard binary format (Cölfen et al., 2010) used in the UltraScan software (Demeler & Gorbet, 2015; Demeler, Gorbet, Zollars, & Dubbs, 2015) offers an efficient data representation that is readily adapted for radial scans collected by the multiwavelength detector. Compared to the Beckman-Coulter ASCII format, and depending on data type, our binary representation achieves between 12:1 and 14:1 lossless compression by taking the following steps: (a) replacing the radial vector with a radial start and end point, and defining the radial increment; (b) missing data points in the radial grid are interpolated and marked by a boolean flag as interpolated; and (c) using a properly scaled 4-byte integer representation for absorbance, intensity, or fringe values. All metadata are carried in the file header and a separate binary file is created for each triple, where a triple is defined as the collection of data originating from a unique channel, rotor hole, and wavelength. A converter exists in UltraScan-III to export binary open AUC data to legacy Beckman-Coulter ASCII format. A separate intensity profile XML file carries the reference intensities for each wavelength as a function of time.
2.2. Data Preprocessing
We found that accounting for time-dependent intensity changes requires individual corrections when converting raw intensity data to absorbance data (Pearson et al., 2015). These corrections are applied on a scan-by-scan basis to all triples using a reference intensity obtained by averaging a few adjacent radial points in the air region above the meniscus from the corresponding scan time. This assures that the intensity level available at the scan’s time is used for the conversion to absorbance data. A detailed description of the open AUC storage format is shown in SI-1 (http://dx.doi.org/10.1016/bs.mie.2015.04.013) (any version changes will be made available on the web in the UltraScan-III wiki: http://wiki.bcf2.uthscsa.edu/ultrascan3/wiki/Us3Formats). In UltraScan-III, the open AUC formatted data are ordinarily stored in a relational database which creates links to experimental details such as analytes, buffer composition, centerpiece type, rotor type, instrument, data owner, and other related information. Before importing MWLD into UltraScan-III, the data are written by the multiwavelength data acquisition software to an intermediate binary file format described earlier (Pearson et al., 2015). The intermediate file is accompanied by a time state object (see Pearson et al., 2015) which is used to record metrics such as rotor speed, temperature, vacuum, and acceleration settings with time increments as short as 1 s. For analysis purposes, the need for this time state object is its utility for the fitting of multispeed experiments. When modeling speed transitions using finite element solutions, it is critical to know the precise point of acceleration or deceleration, and the acceleration rate used. During acceleration the optical detectors typically do not record data, and if one would rely only on the time points recorded in the scan header files, the lag time before and after the last and first recorded scan on either side of the acceleration period is too large for an accurate modeling of the speed transition.
2.3. Data Analysis
The analysis of MWLD can be tailored to the specifics of the experiment. It is possible to distinguish two experimental conditions that can be approached with separate analysis strategies. In the general case, the extinction profiles for one or more sedimenting components are unknown. In this case, data from each wavelength should be analyzed independently. In our analysis approach, hydrodynamic separation of unlike solutes will provide pure spectra for each solute. Complexes formed by different solutes will present composite spectra with proportional contributions from each solute involved in the complex. Data quality permitting this will, in principle, facilitate extraction of complex stoichiometries. In the second case, extinction profiles for all wavelengths covered by the collected data are known a priori for all components in the mixture. If the extinction profiles for all components are sufficiently different, the vectors describing these profiles can be considered orthogonal, and they can be used for a linear decomposition of the measured absorbance profile. Here, the 4D sedimentation profile of the MWLD (wavelength, radius, time, and absorbance) can be reduced to regular 3D sedimentation profiles (radius, time, and absorbance) for each component in the mixture, which can then be analyzed further by conventional single-wavelength methods. This approach is discussed in further detail below. In both cases, the hydrodynamic analysis is based on whole boundary fitting methods using high-resolution finite element modeling (Cao & Demeler, 2005, 2008), according to the workflow sequence described in Demeler (2010). Alternatively, MWLD can be analyzed by methods such as the van Holde–Weischet (Demeler & van Holde, 2004) or DCDT (Walter et al., 2015) analysis. Our workflow implements algebraic elimination of time- and radially invariant noise contributions (Schuck & Demeler, 1999) using the 2D spectrum analysis (2DSA), a meniscus position fit, and an iterative refinement by 2DSA. Methods proposed in Walter et al. (2015) for MWLD analysis rely on the subtraction of pairwise scans in order to remove time-invariant noise. We believe that this approach is unsatisfactory since it increases stochastic noise by ~1.4-fold. Furthermore, the presence of radially invariant noise contributions cannot be corrected by this approach. This turns out to be a serious drawback for the fiber optics multiwavelength detection in the UV where time-dependent changes in the light intensity due to fiber instability have been identified (Pearson et al., 2015). This process causes a reduction of the recorded intensity over the course of a run and requires fine-grained adjustments of the radially invariant baseline offsets for each scan. Our approach correctly handles this type of noise and corrects any time-dependent baseline fluctuations due to intensity changes (see Section 2.2). Since the data from each wavelength can be treated as a separate dataset for analysis with the 2DSA method, this is a demanding, but tractable computational challenge. In the UltraScan workflow, the datasets for each individual wavelength are analyzed in parallel, except the meniscus fit, where the meniscus determination for a single triple (generally selected from the center of the wavelength range) is sufficient to extract the meniscus position for all other wavelengths of a unique channel. We determined that the meniscus position varies slightly with wavelength due to chromatic aberration in the lens-based MWL detectors (<0.003 cm, see SI-2 (http://dx.doi.org/10.1016/bs.mie.2015.04.013)), but this variation is so small that it can be safely ignored. Meniscus corrected data are then refined using the iterative 2DSA approach with up to 10 iterations. In the last step, a 2DSA-Monte Carlo analysis with 100 iterations is used to obtain a concentration distribution for the sedimentation and diffusion profile of any solutes absorbing at a given wavelength. The Monte Carlo analysis will provide statistics that are needed to calculate confidence regions for the extracted parameters (Demeler & Brookes, 2008). If prior knowledge about the experimental system is available and can be used as a global constraint, the Custom Grid approach (Demeler et al., 2014) can be applied to map the 2DSA results to other hydrodynamic parameters, such as partial specific volume, frictional ratio, and molar mass. Once the analysis is complete, finite element models are posted back to the database using the Airavata grid middleware (Pierce, Marru, Demeler, Singh, & Gorbet, 2014). Models can then be visualized on the desktop and meta-analysis can be performed to extract amplitudes of each sedimenting species at any wavelength in order to compile an absorbance spectrum for each species present in the mixture and to obtain a partial concentration for each species.
2.4. Analysis of MWLD Containing Species with Known Extinction Profiles
In the case where extinction profiles for all components are known, MWLD can be decomposed into separate sedimentation profiles for each individual component. This requires that the intrinsic extinction profile of each pure component can be measured separately, and that any shifts in the absorbance spectrum occurring as a result of complex formation are negligible. This would assure that the spectral properties of each component stay constant, even when complexes are formed. In our approach, a dilution series of each spectrally unique component is wavelength scanned in a benchtop spectrophotometer over the entire range measured in the MWLD dataset:
| (1) |
The absorption signal from each dilution is globally fitted to an intrinsic extinction profile composed of a sum of Gaussian terms with amplitudes , wavelength center , peak width , and concentration scaling factor (see Eq. 1) using nonlinear least squares optimization implemented in UltraScan (Demeler et al., 2015). Using 50 Gaussian terms, this approach faithfully represents the entire spectrum observed in the MWL instruments (see SI-3 (http://dx.doi.org/10.1016/bs.mie.2015.04.013)). Inclusion of greatly varying concentrations assures that the dynamic range of the spectrophotometer can be optimally used for even greatly varying extinction ranges at different wavelengths. Our implementation in UltraScan allows the user to exclude data above a threshold optical density to assure that only linear data are included in the fit. A benefit of the global fitting of multiple concentrations at multiple wavelengths is the ability to span greater concentration ranges, because extinction coefficients vary considerably over a large wavelength range for most biological macromolecules, especially in the low UV range below 230 nm. To stay within the dynamic range of the detector, combined multiple concentrations which optimally exploit the dynamic range of the detector, lead to a more reliable extinction profile for the entire wavelength range. Examples for global fits of a dilution series of mixtures containing different ratios of bovine serum albumin and a DNA plasmid restriction digest are shown in SI-3 (http://dx.doi.org/10.1016/bs.mie.2015.04.013).
| (2) |
In the next step, intrinsic extinction profiles for each species are now fitted to a linear decomposition of the wavelength spectrum at a radial point and scan time (see Eq. 2) in order to obtain the amplitudes for each of the components. The problem is described by the linear system , where is the matrix composed of columns containing the values of the extinction profiles for each of the components, and is the wavelength spectrum to be decomposed, and is a vector with the unknown amplitudes to be fitted. We point out that the approach for fitting this linear system suggested by Walter et al. (2015) does not impose the needed constraint that would guarantee that contributions for all solutes will always be ≥0. A nonnegatively constrained least squares (NNLS, as proposed by Lawson & Hanson, 1974) algorithm should be used, which guarantees for all . Since wavelength scans from the MWLD experiment are not available as a dilution series, each wavelength scan from the MWL instrument is used directly in the NNLS fit. Once the amplitudes have been determined for each radial position and each time point, a new transformed dataset can be constructed for each component , yielding the concentration of component as a function of radius and time. Conventional analysis of the resulting 3D datasets now provides the sedimentation profiles for spectrally distinct components, as well as any formed complexes containing the component. Once relative concentrations are determined, equilibrium constants for the complex formation can be readily derived from the mass action. Interpretation of these reduced datasets will be greatly facilitated since only one free component and its complexes are immediately identified by the column vector in . Identical hydrodynamic components found in multiple datasets correspond to complexes to which the species of interest is bound; the relative concentrations determined in Eq. (2), together with the hydrodynamic fitting methods will directly provide the stoichiometry of the association.
2.5. Parallelization
Due to the large data volume encountered in MWLD, we employ special submission mechanisms in a high-performance computing (HPC) infrastructure called the UltraScan Laboratory Information Management System (USLIMS) (Brookes & Demeler, 2008; Demeler et al., 2009). The USLIMS allows the user to manage all of their experimental data and submit experimental data for high-resolution analysis to a remote HPC resource. It allows the user to process computationally demanding data analysis algorithms in parallel using the UltraScan Science Gateway (Memon et al., 2014). Integration of HPC solutions benefits the investigator on three levels: (1) increased resolution, (2) faster calculations, and (3) analysis throughput, which is significantly higher since many data sets can be analyzed simultaneously. Conventional single-wavelength data consist of multiple time scans (typically 50–500 scans) of the radial domain (~300–800 datapoints/scan). MWLD contain hundreds of different wavelengths, but because of UltraScan’s efficient open AUC data storage algorithms, the data can still be transferred over networks without noticeable delay. At the lowest level, the optimization algorithm involves fitting finite element solutions to the experimental data (see Brookes & Demeler, 2006, 2007, 2008; Brookes et al., 2006, 2010; Demeler & Brookes, 2008; Demeler et al., 2009, 2010, 2014; Gorbet et al., 2014). On the next level, jobs containing groups of up to 50 triples are submitted to the HPC resource queue. Depending on the load of the queue, all or some of the jobs may execute in parallel. On the third level (depending on the availability of resources), each job is further subdivided into parallel master groups (PMGs), resulting in a scalable HPC parallelization. On large HPC resources many submissions can be processed in parallel. On the final level, Monte Carlo calculations can be performed in parallel, adding a fourth level of parallelization. Proper selection of the PMG level allows the queuing system to optimally load-balance the submissions for different architectures. The user can even distribute portions of each analysis over multiple HPC resources. For a run with 100 scans performed at 350 individual wavelengths (250–600 nm) at 50 μm resolution, a total of 9.45 million datapoints (assuming a 13.5-mm column) need to be analyzed. This amounts to 12,600 NNLS computations when a standard 60 × 60 resolution 2DSA grid with 100 grid points is used. By splitting the computational load along individual wavelengths, nearly linear speedup is achieved, and 12,600 NNLS computations are performed in the same time as just 36. Parallelization is achieved using the Message Passing Interface standard (The Open MPI Project, 2004-2015) on distributed HPC architectures (available to UltraScan users from NSF-XSEDE resources and from UTHSCSA). For the analysis of MWLD containing species with known extinction profiles, each wavelength scan needs to be decomposed into individual contributions from known extinction profiles (Eq. 1). Since each wavelength scan can be decomposed independently, this process is also performed in parallel, using multithreaded fitting implemented in the desktop version of UltraScan-III which takes advantage of modern multicore architectures.
2.6. Visualization
2.6.1. Experimental Data
In order to gain a full view of either the experimental MWLD or the analysis results, four dimensions are needed (Pearson et al., 2015). We introduced 3D movies to provide a comprehensive 4D view of experimental data and analysis results. UltraScan offers the following movies in its data viewer: A 3D view of experimental data: Absorbance vs. radius and wavelength, with each scan time rendered as a frame in the movie. The concentration is represented by a color gradient. An example of a single frame is shown in Fig. 1. Movies over all scans of each DNA:BSA ratio are shown in SI-4 (http://dx.doi.org/10.1016/bs.mie.2015.04.013). Movies of the 2D view of all scans as a function of wavelength are shown in SI-5 (http://dx.doi.org/10.1016/bs.mie.2015.04.013), and movies of the absorbance at all wavelengths as a function of radius are shown in SI-6 (http://dx.doi.org/10.1016/bs.mie.2015.04.013).
Figure 1.
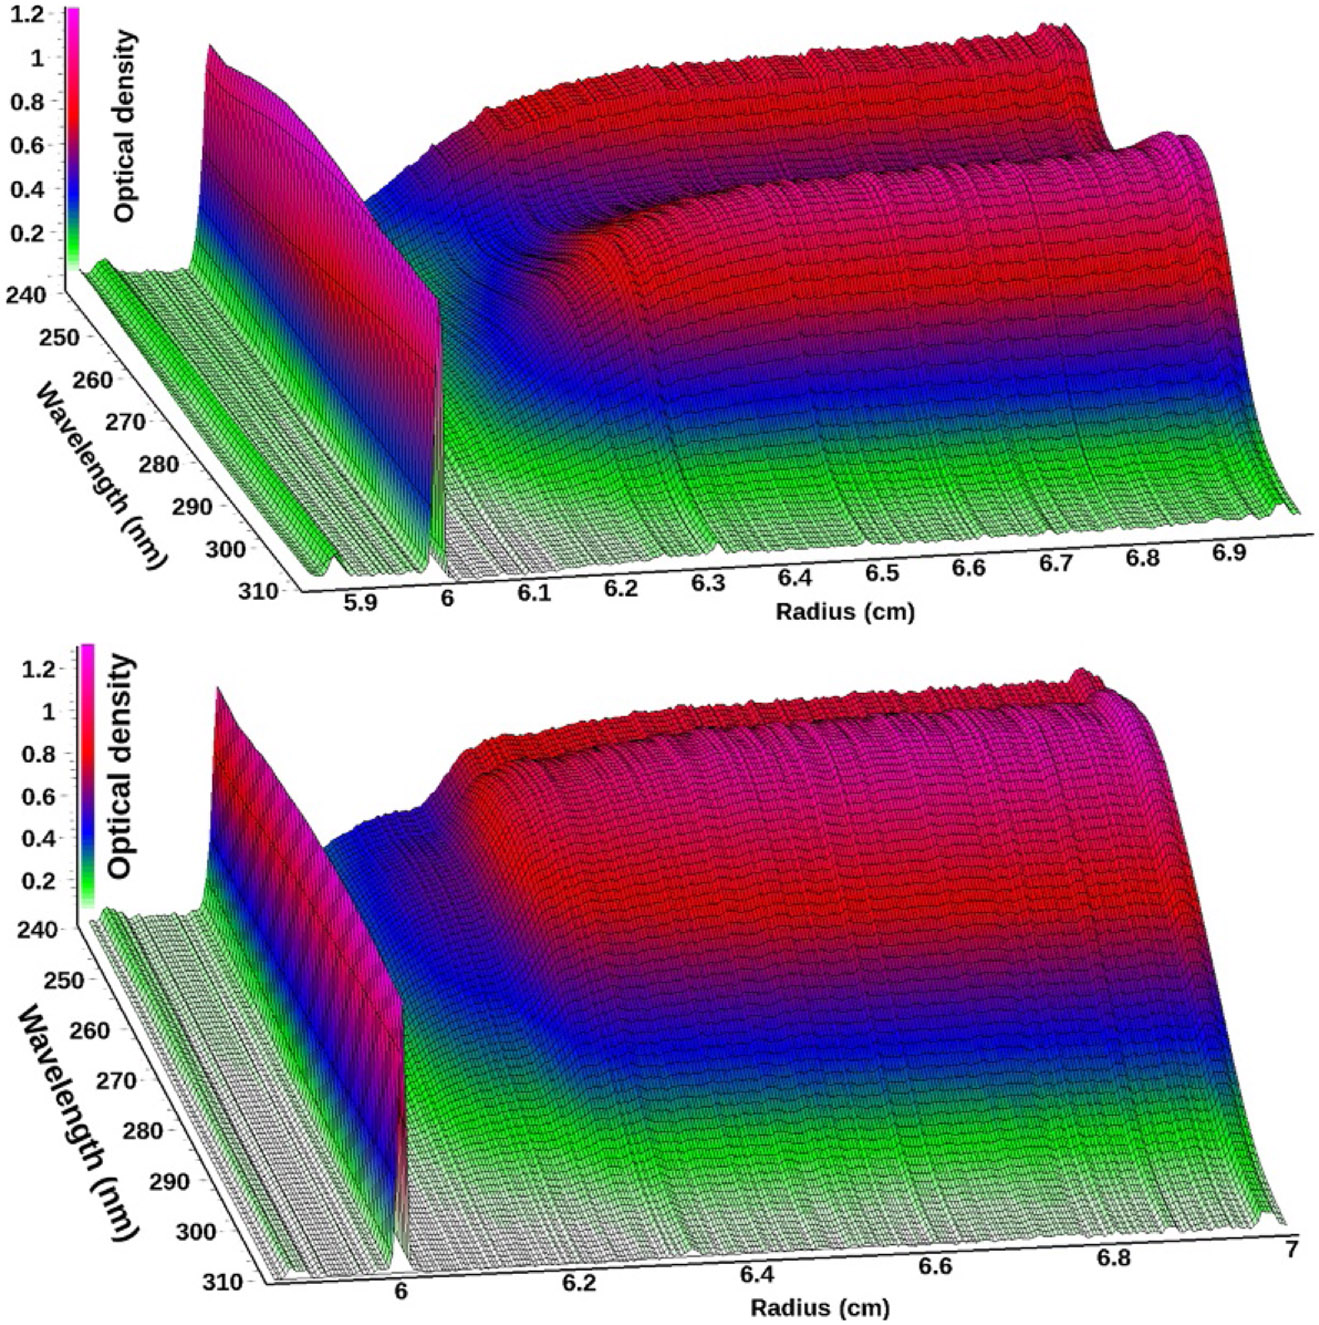
Three-dimensional view of scan 35 from a multiwavelength sedimentation velocity experiment of BSA (top) and scan 16 from a mixture of DNA fragments (bottom) measured between 240 and 310 nm.The meniscus is clearly visible at ~6.0 cm. For BSA, an absorbance maximum is visible at 278 nm from tyrosine and tryptophan residues, and below 250 nm absorbance from the peptide backbone increases for BSA, while a 258 nm peak typical for DNA results in a pronounced difference between the two biological macromolecules.
2.6.2. Analysis Results
The results from a 2DSA generate a surface of amplitudes for the two fitted dimensions for each wavelength. These data can be shown either as a 3D plot (Fig. 2) or as a pseudo-3D plot where a color gradient is used to project the amplitudes into a 2D plane (Fig. 3). In UltraScan, model files for individual fits can be combined to generate a global view of each analyzed wavelength. Solutes appearing in the global model can be integrated visually in UltraScan, and the global model can be displayed either in a 3D viewer (see Fig. 4) or as a pseudo-3D plot (see SI-7 (http://dx.doi.org/10.1016/bs.mie.2015.04.013)). Alternatively, the pseudo-3D plot from each wavelength can be shown as an individual frame in a movie, and an example of this is shown in SI-8 (http://dx.doi.org/10.1016/bs.mie.2015.04.013). The same approaches work for other methods based on Lamm equation modeling, such as the PCSA (Gorbet et al., 2014), the custom grid analysis (Demeler et al., 2014), or genetic algorithms (GAs) (Brookes & Demeler, 2006, 2007). In addition, multiwavelength data can be quite informative when used with the model independent van Holde–Weischet method. Figure 5 shows an integral distribution plot for the 50:50 mixture of DNA and BSA. A differential distribution of the same analysis is shown in Fig. 6.
Figure 2.
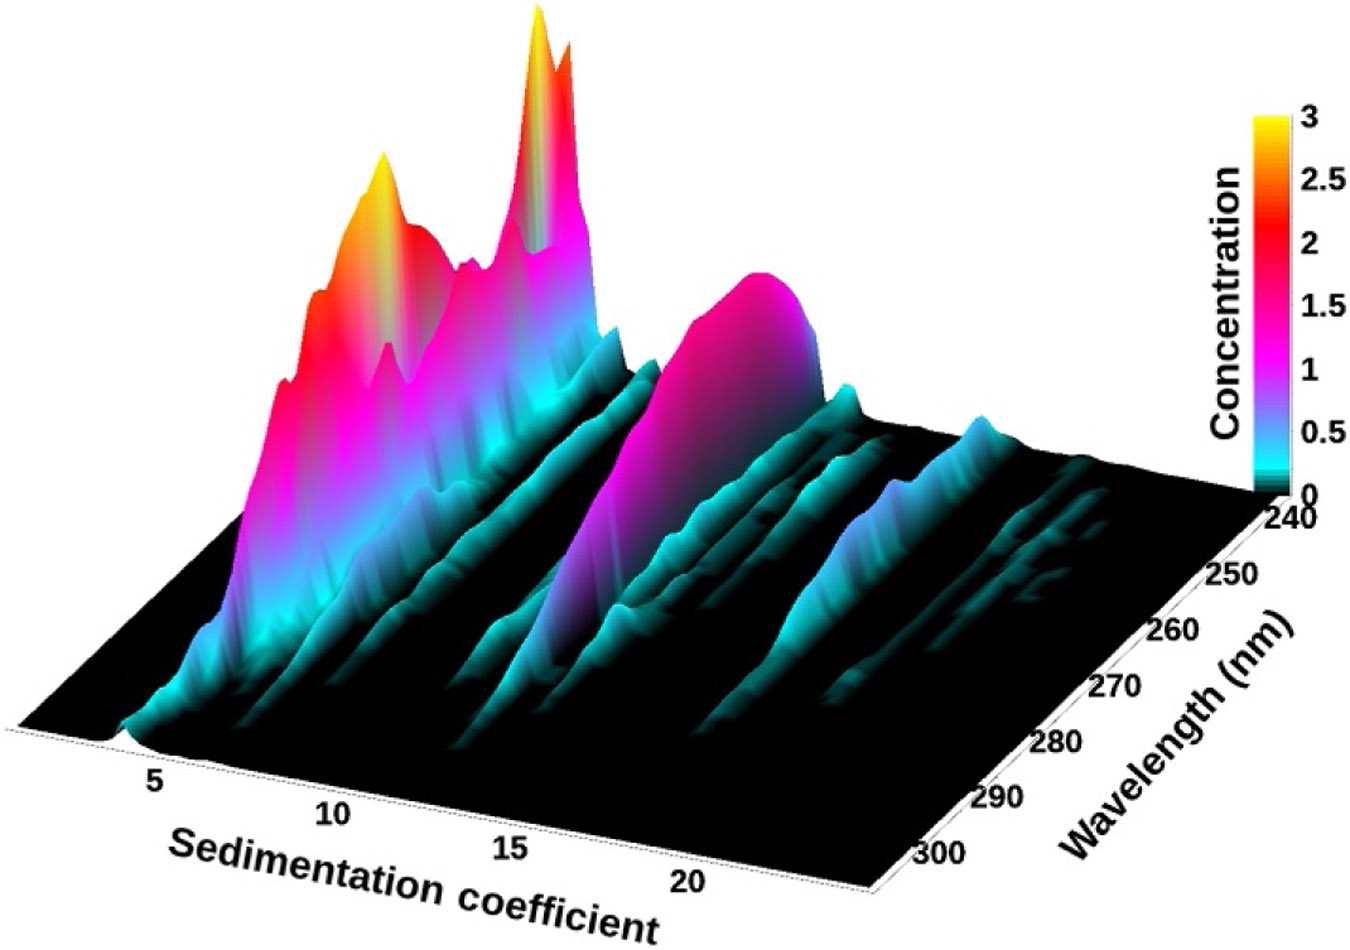
3D view of the sedimentation profile as a function of wavelength for the 50:50 DNA-BSA mixture after 2DSA-Monte Carlo analysis. The protein absorbance spectrum at 4.3 S (two yellow (white in the print version) peaks) can be clearly distinguished from the DNA peak with absorbance maximum around 258 nm. Minor species can be identified based on their spectrum.
Figure 3.
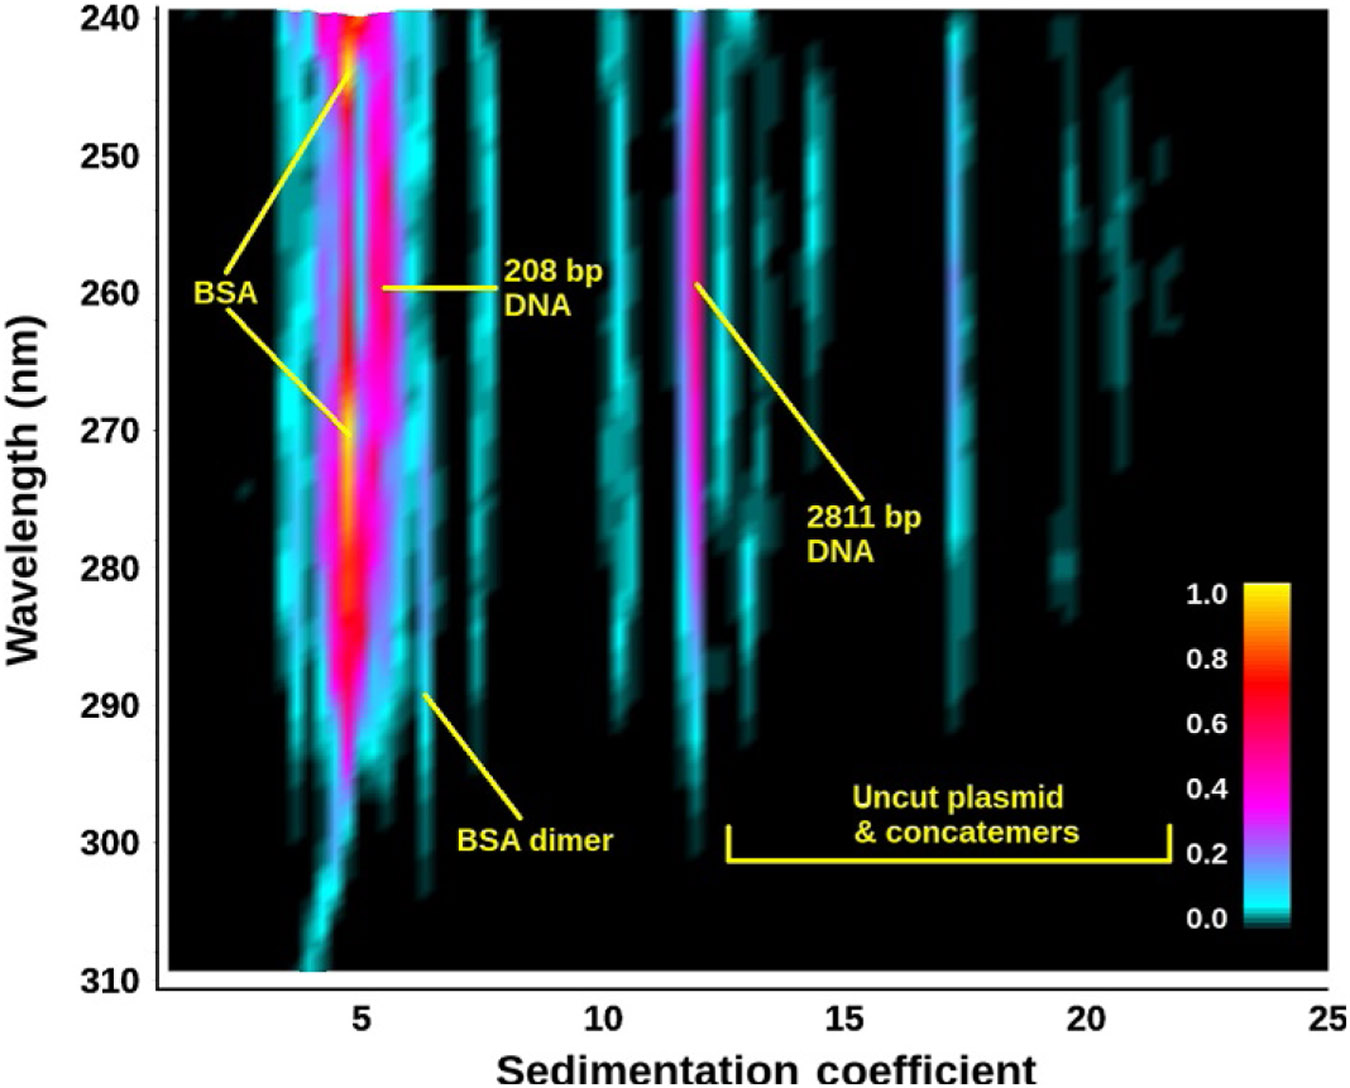
Projection view of the 2DSA-Monte Carlo sedimentation profile as a function of wavelength for the 50:50 DNA–BSA mixture. Remarkably, the protein absorbance spectrum at 4.3 S (two yellow peaks) can be clearly distinguished from the adjacent DNA peak with absorbance maximum around 258 nm, despite the proximity of the peaks (4.5 S vs. 5.2 S). Minor species can be identified based on their spectra. The straight lines attest to the high resolution and robustness of this approach to fit multiwavelength data (each wavelength is separately analyzed).
Figure 4.
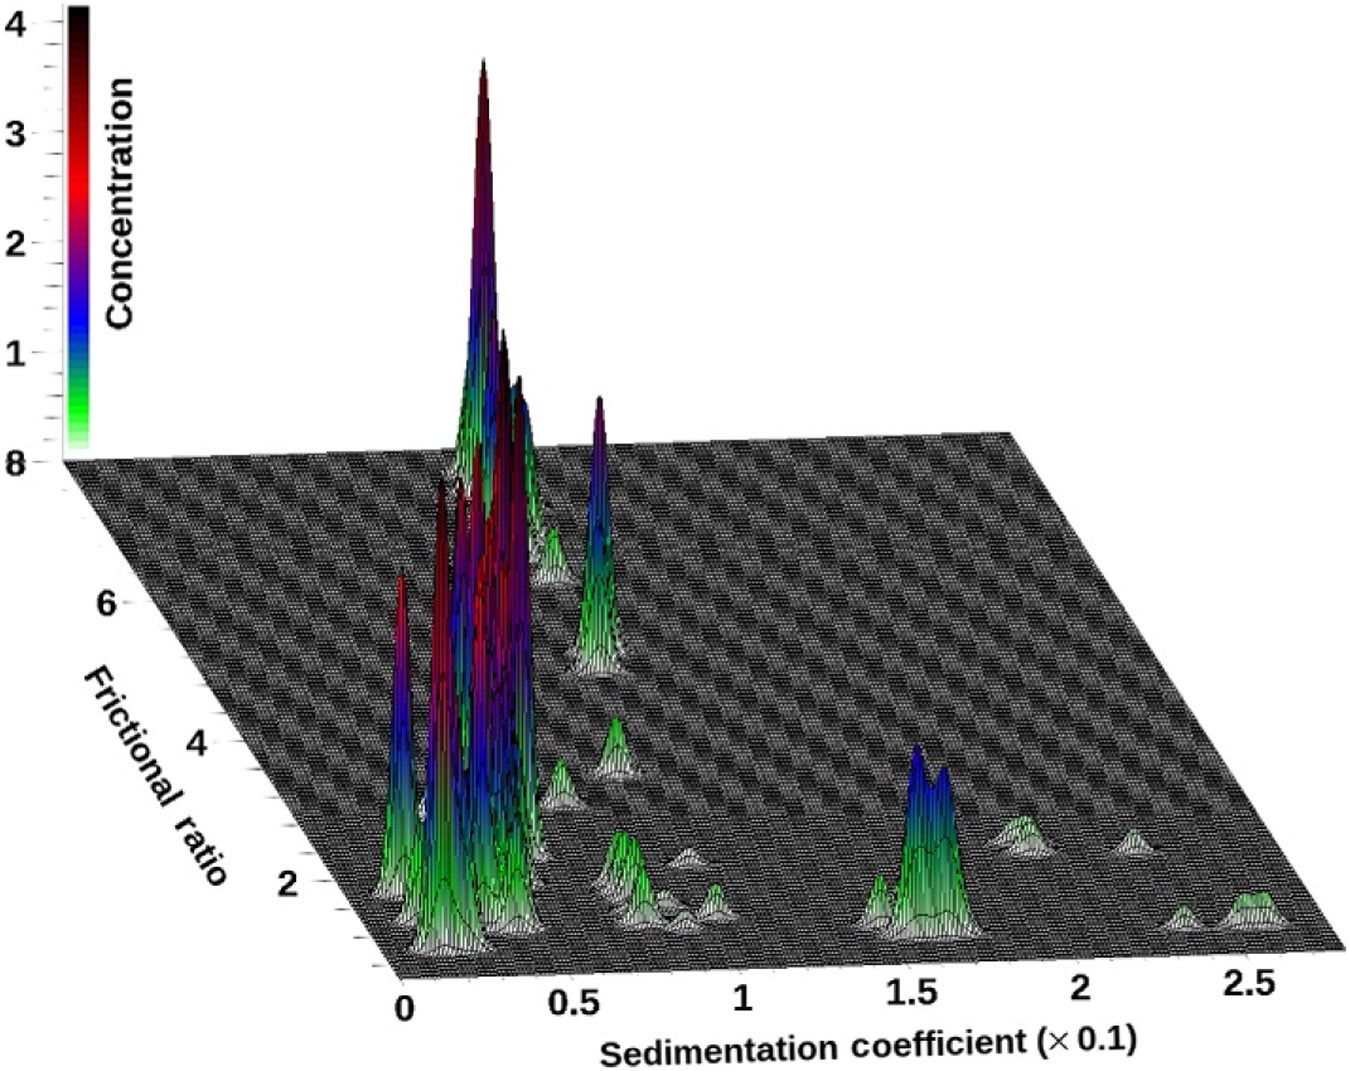
3D plot of a globally combined vs. distribution for a 50:50 mixture of BSA and DNA fragments. Data collected on a Beckman-Coulter XL-A, at 258 and 278 nm. Data from three repeat experiments and from each wavelength were combined to generate this global view.
Figure 5.
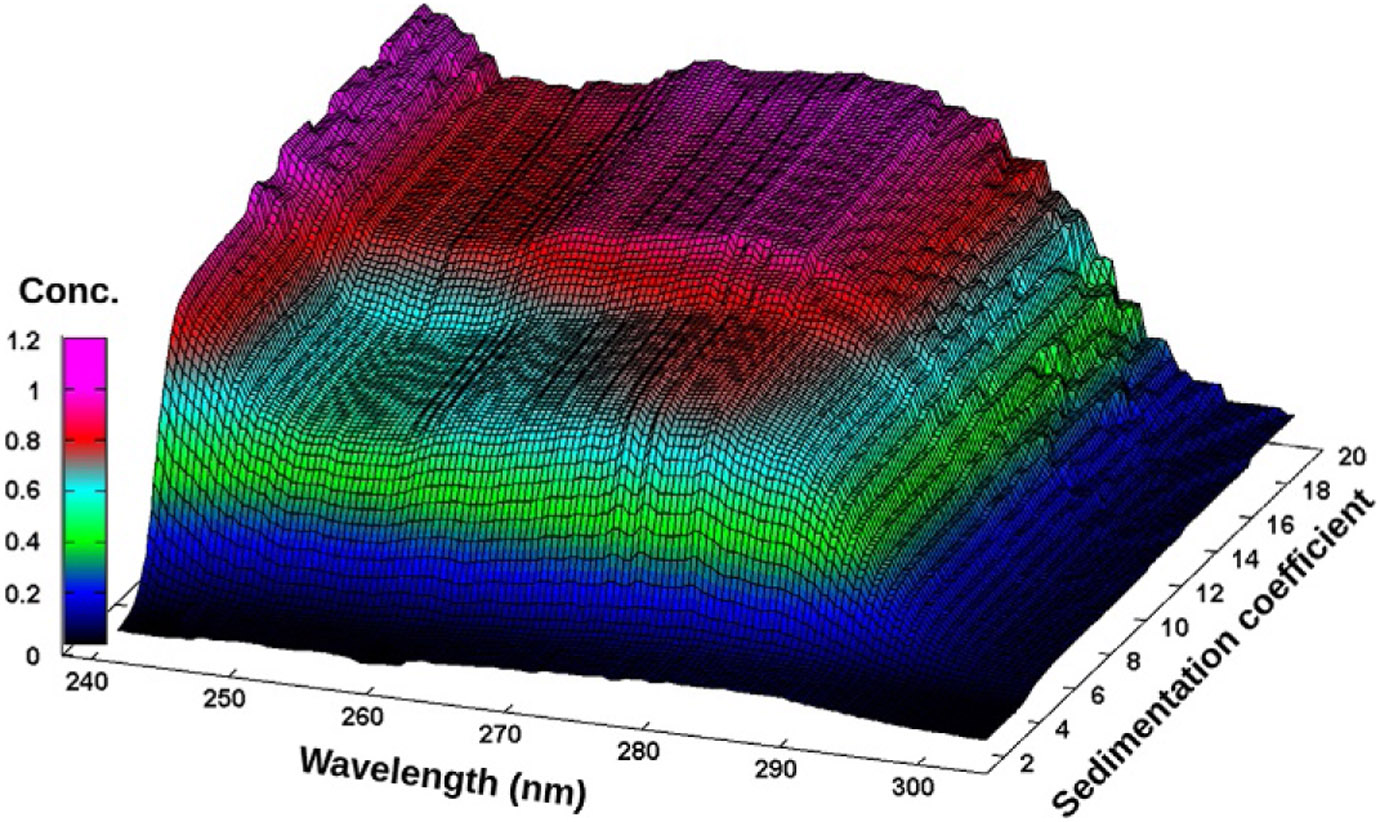
van Holde–Weischet integral distribution plots with boundary fractions scaled to the total concentration measured at each wavelength from the BSA–DNA 50:50 mixture. The shape of the BSA extinction profile is clearly visible at 4 S, and the DNA peak for the larger fragment shows maximum contribution around 258 nm at 11 S.
Figure 6.
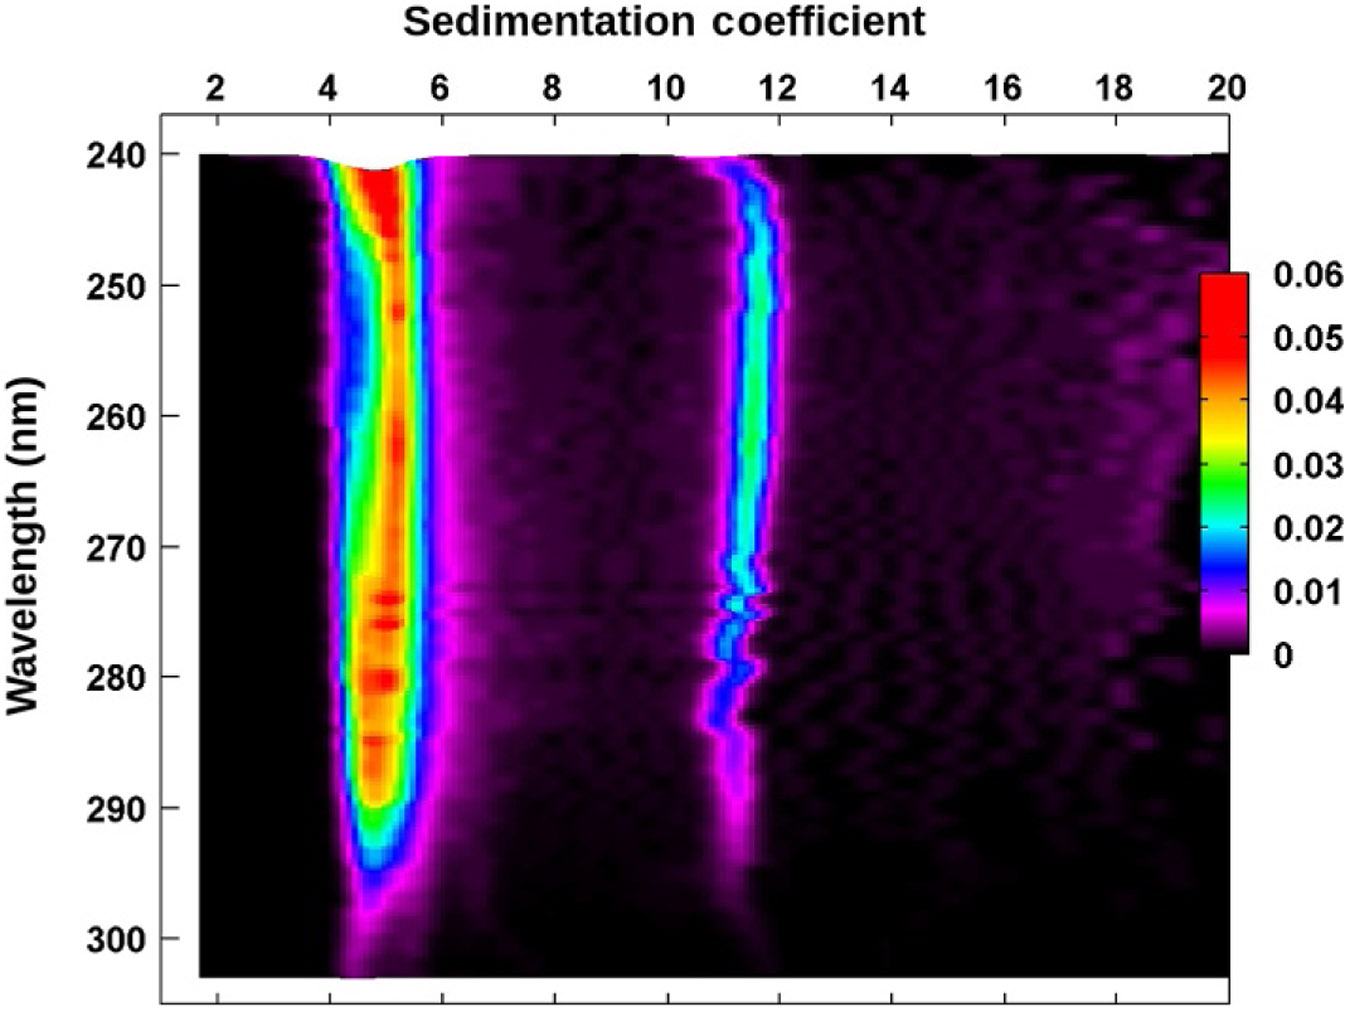
van Holde–Weischet differential distribution projection plot as a function of wavelength for the BSA–DNA 50:50 mixture. The asymmetric shape of the peak between 4 and 6 S clearly indicates a heterogeneity in spectral properties originating from the closely sedimenting BSA and 208 bp DNA peaks. On the left side of the peak, the BSA extinction dominates;on the right side of the peak, the DNA extinction profile dominates. The peak at 11 S displays a DNA extinction profile only. The color (different gray shades for the print version) gradient indicates relative concentration.
3. APPLICATIONS
To illustrate the capabilities of the MWL instrument and to compare MWL performance to traditional single-wavelength AUC, we characterized mixtures containing different ratios of DNA and protein (20:80, 35:65, 50:50, 65:35, and 80:20 on a per volume basis) and determined both the hydrodynamic properties of all components and identified the ratios of DNA and protein in each mixture from the AUC analysis. As a first step, the composition of each mixture was validated by spectral decomposition described in Section 2.4 using a benchtop spectrophotometer (see SI-3 (http://dx.doi.org/10.1016/bs.mie.2015.04.013)).
Hydrodynamic characterization by traditional AUC: After validating the composition via spectral decomposition, the same samples were measured by AUC in the Beckman-Coulter XL-A at 258 and 278 nm, at 20 °C, 28,000 rpm using epon-charcoal 2-channel centerpieces (Beckman-Coulter) to verify the protein:DNA ratios with an independent method. The data were analyzed with UltraScan according to the workflow described in Demeler (2010), and the relative amounts of protein and DNA were quantified by integration of global models built from the GA results (Brookes & Demeler, 2007). The resulting globally fitted data are shown in Fig. 4, and results from individual mixtures are presented as pseudo-3D plots in SI-7 (http://dx.doi.org/10.1016/bs.mie.2015.04.013) (right panels).
Hydrodynamic and spectral characterization by MWL: Next, the same mixtures were measured on the open AUC MWL instrument at the University of Konstanz, using identical conditions that were used in the Beckman-Coulter XL-A. The resulting data were analyzed both by parallel finite element analysis of each wavelength’s velocity dataset by 2DSA-Monte Carlo and by spectral decomposition using the spectral components for BSA and DNA determined previously (see SI-3 (http://dx.doi.org/10.1016/bs.mie.2015.04.013)), with subsequent standard analysis according to the workflow described in Demeler (2010). The parallel analysis of all wavelengths resulted in well-separated hydrodynamic species, showing characteristic wavelength spectra for BSA and DNA (Figs. 2-4). A van Holde–Weischet analysis of the noise-corrected MWLD is shown in Figs. 5 and 6. The decomposition of MWLD from the six samples measured in the open AUC MWL instrument resulted in 12 datasets, 6 corresponding to the DNA and 6 corresponding to BSA contributions for each dataset. The decomposed data are shown on SI-9 (http://dx.doi.org/10.1016/bs.mie.2015.04.013). The 12 datasets obtained by the decomposition were analyzed as described in Demeler (2010) with refinement steps terminated by a global GA–Monte Carlo analysis for all 6 samples from each species. This resulted in two pseudo-3D plots which are shown in Fig. 7.
Statistical analysis: To gain a better appreciation of the different noise levels present in these disparate datasets, we performed a statistical analysis of the fitting results as a function of total concentration. It is reasonable to expect different noise levels at different concentrations on different instruments; hence, we compared the root mean square deviations (RMSDs) obtained from the degenerate 2DSA analysis of the iterative refinement step, which produced random residuals in all cases. We plotted the RMSDs obtained for different concentrations from each of the six conditions: (a) Beckman-Coulter XL-A measurements at 258 and 278 nm, (b) open AUC MWL measurements at 258 and 278 nm, and (c) fits from the decomposition results for DNA and BSA as obtained from the open AUC MWL instrument. Here, the total concentration provides some measure of how much light passes through to the detector, and the RMSD level from the 2DSA fit provides a measure of residual noise. A plot of these data for each of the six conditions can be fitted to straight lines and is shown in SI-10 (http://dx.doi.org/10.1016/bs.mie.2015.04.013).
Quantification of BSA and DNA: Each experimental method was then used to estimate the known ratios of DNA to BSA from the experimental data. A summary plot of percentages observed in the dual-wavelength GA, the MWLD decomposition, and the spectrophotometer decomposition is shown in Fig. 8.
Figure 7.
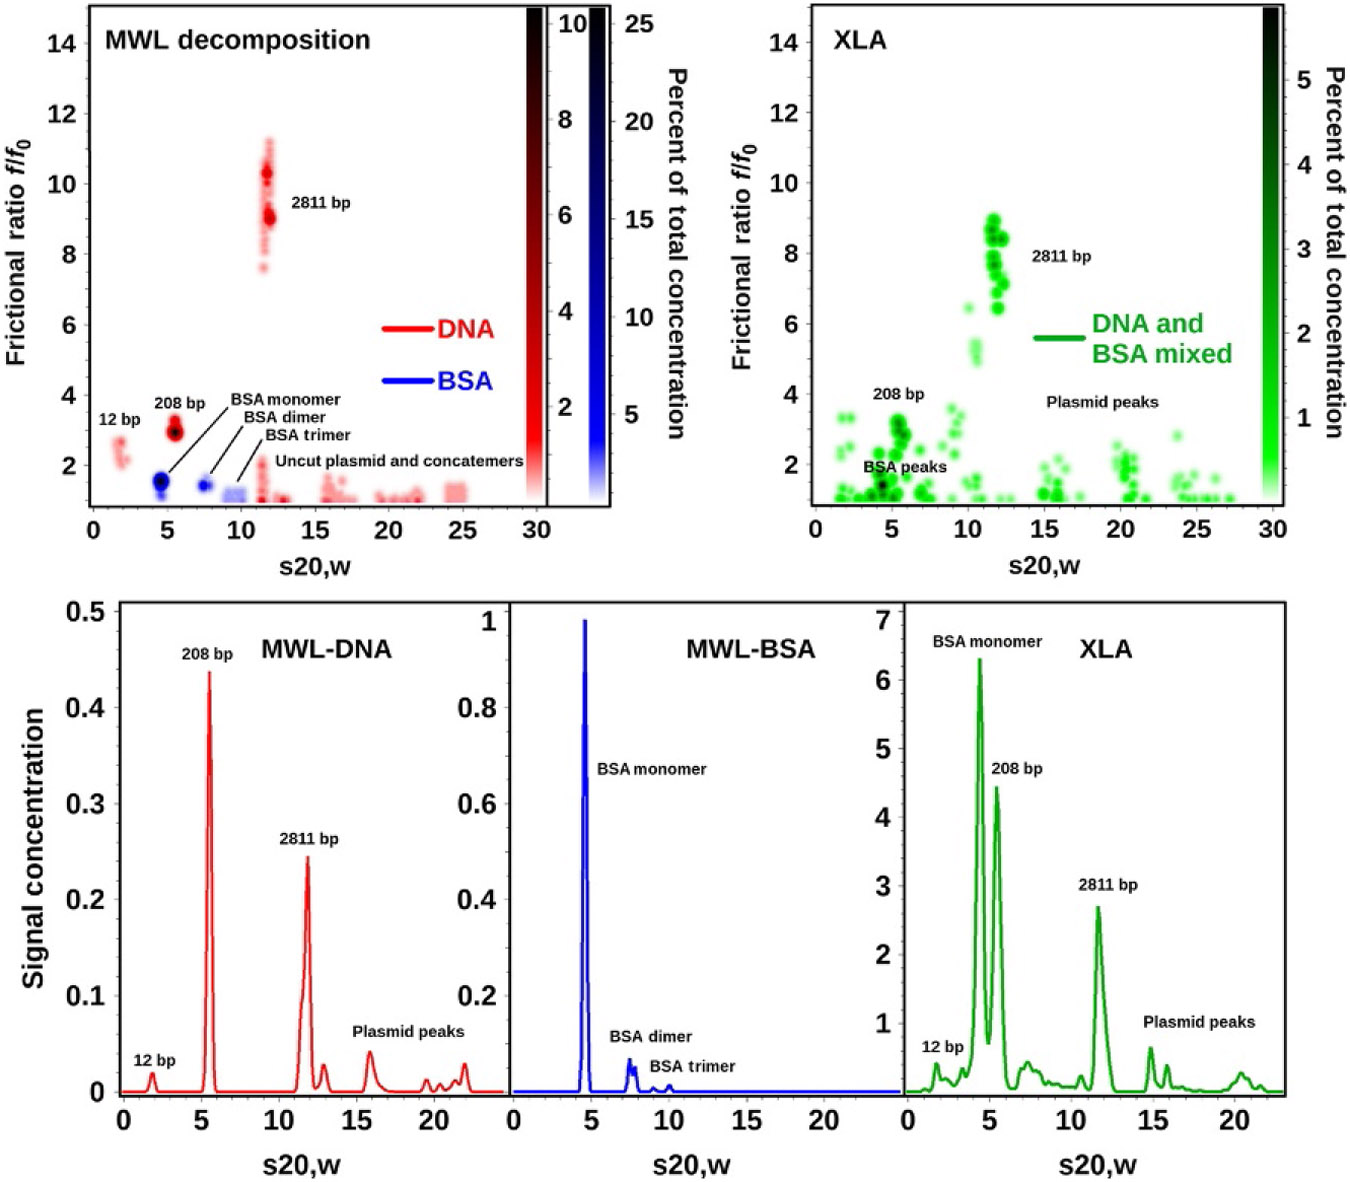
Global genetic algorithm Monte Carlo analysis of decomposition results obtained from six different DNA and BSA mixtures analyzed on the open AUC MWL instrument (top left) and the dual-wavelength results obtained from the Beckman-Coulter XL-A (right panel). The separate decomposition results for DNA (red) and BSA (blue) are combined in the left panel pseudo-3D plot to illustrate the exceptional separation achieved by spectral decomposition which even separates species with nearly identical sedimentation coefficients (the two major species sedimenting near 5 S). This approach demonstrates the superior resolution obtained from MWL analysis compared to the global two-wavelength analysis performed on the Beckman-Coulter XL-A (right panel, green). Lower panel: differential distributions from the same data shown above (red): decomposition for DNA, blue: decomposition for BSA, green: nonseparated XL-A data for DNA-BSA mixtures globally fitted to genetic algorithm–Monte Carlo analysis. A color representation of this figure is provided in the color plate section to allow the reader to distinguish the DNA and BSA contributions based on color.
Figure 8.
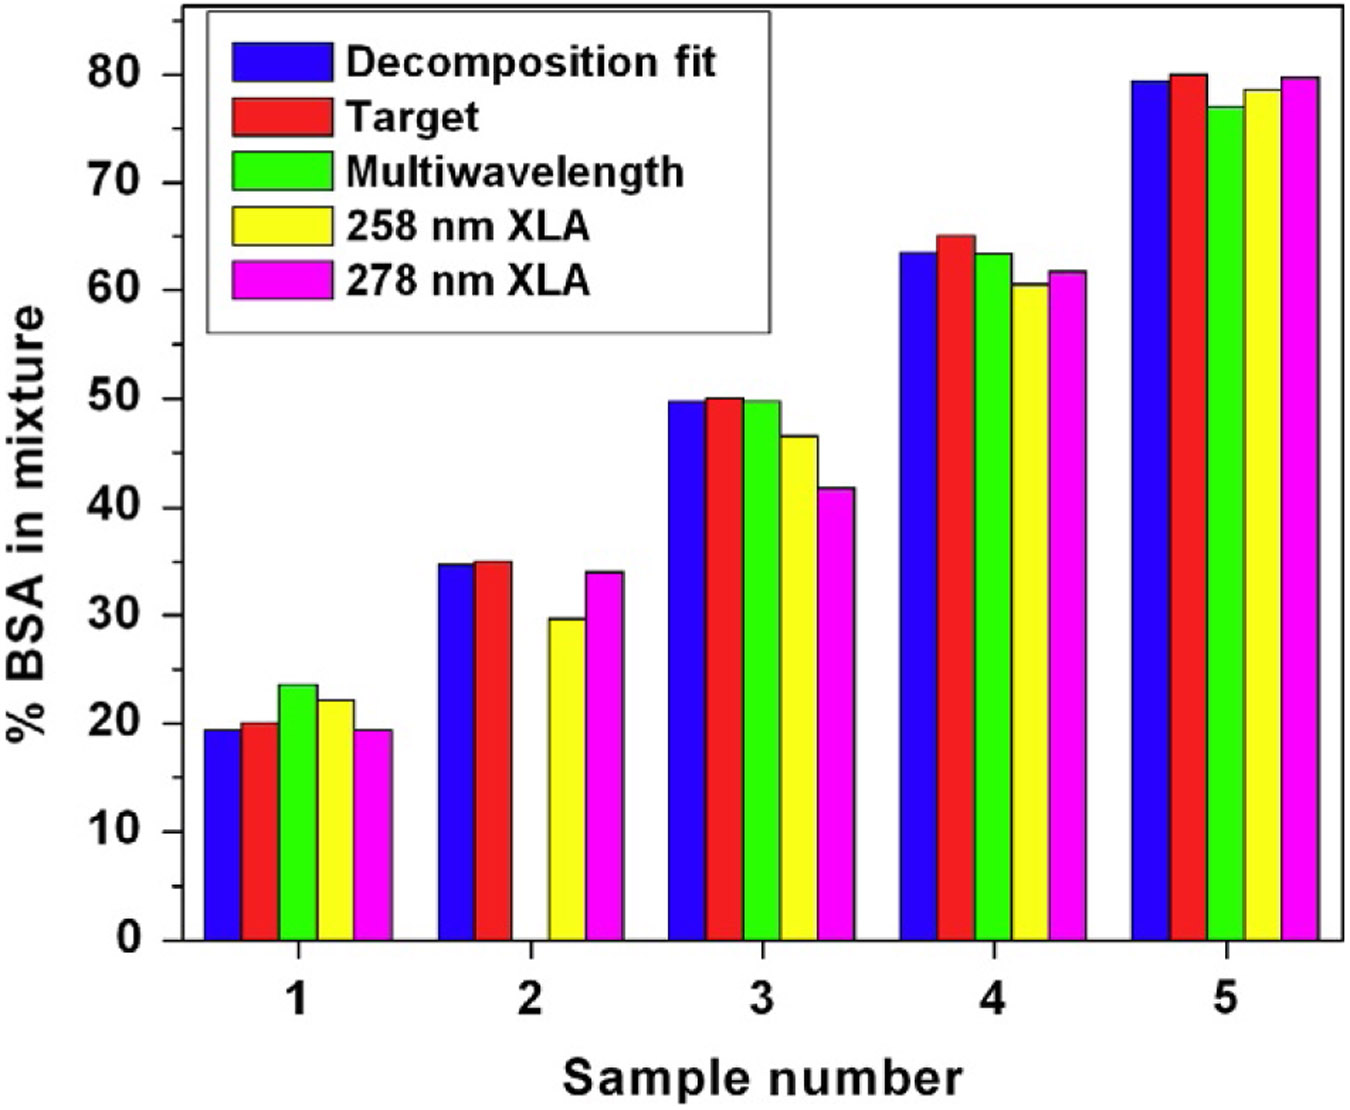
Comparison of results from the dual-wavelength AUC/GA analysis with the spectral decomposition method to ascertain the relative composition of spectrally different components in mixtures. The results clearly show that the spectral decomposition achieves even higher fidelity in reproducing the known target values than single-wavelength AUC/GA. Samples 1–5 refer to ratios of 20%, 35%, 50%, 65%, and 80% BSA in a BSA:DNA mixture with average errors of around 0.7%. Errors observed from the decomposition MWLD analysis results are on par with the spectral decompositions of the Genesys spectrophotometer data and are at least as good as the data obtained from the Beckman-Coulter XL-A.
4. DISCUSSION
Our first result shows that the spectral profile from a dilution series of any chromophore or mixture of chromophores can be accurately parameterized by a linear combination of Gaussian terms that are globally fitted to the wavelength scans from all dilutions. The resulting intrinsic extinction profiles can be scaled to any concentration scale desired (e.g., optical density, mg/ml, molar concentration). Second, the intrinsic extinction profiles of known species in a mixture can then be used as orthogonal basis vectors in a nonnegatively constrained least squares fit of any unknown wavelength scan to identify the precise quantity of each contributing species. A decomposition of spectra measured from carefully prepared mixtures of DNA and protein resulted in an average error of only 0.7% in the expected concentrations of the deconvoluted component spectra, proving that the NNLS decomposition is both precise and robust. We suspect the residual error is likely due to pipetting error, and not instrument or algorithm related. These results demonstrate that different ratios of a mixture of protein and nucleic acid can be accurately resolved by spectral decomposition, even though their spectra show significant overlap (SI-3 (http://dx.doi.org/10.1016/bs.mie.2015.04.013); Fig. 8).
AUC analysis of SV experiments provides the concentration distribution of any two hydrodynamic parameters (Demeler et al., 2014), which may be molar mass, anisotropy (frictional ratio), frictional coefficient, hydrodynamic radius, partial specific volume, sedimentation, and diffusion coefficient. When spectral information is added, the information from multiple wavelengths (up to 800 wavelengths per sample, depending on diffraction grating used) significantly increases the amount of data to be analyzed. We presented different approaches for the analysis of MWLD, depending on the availability of known spectral properties for all constituents. Even when spectral properties of all constituents are not available, impressive new detail can be obtained compared to the single-wavelength Beckman-Coulter XL-A. When analyzed by the parallel submission mechanisms implemented in UltraScan, even large numbers of wavelengths can be processed in a matter of a few minutes in batch mode on large parallel supercomputers available through XSEDE. High-resolution 2DSA modeling of MWLD provides exceptional detail (for example, Fig. 3) by resolving both the hydrodynamic and the spectral domain, even for complex mixtures with many components. But also lower resolution methods like the van Holde–Weischet analysis can already provide valuable detail for hydrodynamic properties of components and resolve these components based on spectral differences (see Figs. 5 and 6).
Even higher resolution can be obtained when spectral properties of all components can be decomposed into separate, traditional 3D datasets (see SI-9 (http://dx.doi.org/10.1016/bs.mie.2015.04.013)). In this case, the NNLS fit of the wavelength spectra reduces the number of triples to be analyzed from the number of wavelengths to the number of constituents. These datasets can be analyzed independently (Fig. 7), providing unrivaled resolution, even of components that have nearly the same sedimentation coefficient as long as they are spectrally diverse. As can be seen in Fig. 7, essentially 100% separation between BSA and DNA is achieved by our method, imparting exceptional resolving power to optically diverse mixtures. This resolution is achieved despite significant overlaps in the absorbance spectra from BSA and DNA. It should be emphasized that theoretically many more than two spectrally distinct components could be separated, limited only by the extinction difference between individual components. It should be noted that the difference in extinction properties can be experimentally enhanced by labeling molecules with similar absorbance spectra with different chromophores or fluorophores. We predict that the impact of this new capability will be important for the analysis of complex mixtures such as nucleic acid–protein assemblies, e.g., chromatin, ribosomes, DNA- or RNA-binding proteins, heme proteins, and any number of assemblies that can be labeled with unique chromophores. The improvement in data quality is evident when decomposed data are fitted. As is shown in SI-10 (http://dx.doi.org/10.1016/bs.mie.2015.04.013), the RMSD levels from decomposed DNA data are significantly lower than the RMSD levels from XL-A data, but also from individual wavelengths from the open AUC MWL detector. The improvement in data quality is due to the averaging that occurs when datasets acquired at multiple wavelengths are decomposed into a single dataset. This reduced noise level is critically important to improve hydrodynamic resolution. As Fig. 7 shows, the data obtained from the Beckman-Coulter XL-A and from the MWLD show similar species, except in the MWLD decomposition process, these species are much better resolved hydrodynamically.
5. CONCLUSION
In this study, we have shown that analysis of multiwavelength data is superior to that of traditional single-wavelength data from AUC. Even if no spectral information is known about the components prior to the analysis, a standard whole boundary modeling approach like 2DSA coupled with Monte Carlo analysis or the enhanced van Holde–Weischet analysis reveals important information about the system under investigation which is complemented by the spectral information. By taking advantage of the earlier determined extinction spectra of DNA and BSA, the BSA–DNA mixtures investigated here could be decomposed, and resolved into all major components, even if their sedimentation rates were very similar, achieving 100% separation between DNA and BSA. By separating signals from distinct spectral species into individual datasets by spectral decomposition, the hydrodynamic resolution is also enhanced, and the characterization is greatly improved. The information content of such evaluation is superior to existing methods, even with the most sophisticated evaluation methods. We have demonstrated this case for molecules with two different base spectra, but this capability can be readily extended to more components and will be the subject of future work.
While we have seen the dramatic improvements in data quality in the current second-generation MWL systems, which now provide sufficient signal in the UV down to 240 nm, there is still room for improvement, and fiber instability issues need to be overcome. Yet, these results demonstrate clearly the important potential of multiwavelength detection. Further improvements in data quality are expected in the near future when third-generation MWA systems like the CFA (SpinAnalytical) become available, which no longer rely on fibers.
We predict that MWLD of AUC data will prove to be a very useful technique in a wide range of applications where complex mixtures with spectral diversity need to be examined. The multiwavelength approach promises much improved resolution for the study of multicomponent assemblies and hetero-associating systems, and importantly, can resolve molecular weight ambiguities. Specific chromophore labeling will pave the way to the analysis of complex mixtures, where multiwavelength detection will be able to resolve a larger number of compounds, by far exceeding the capabilities of traditional AUC.
Supplementary Material
ACKNOWLEDGMENTS
We acknowledge the invaluable contributions from our colleagues at the Texas Advanced Computing Center, in particular Chris Hempel, who have provided important assistance with the use of XSEDE supercomputing resources. We also would like to thank the Science Gateway group at Indiana University (Marlon Pierce, Raminder Singh, and Suresh Marru) for their help with implementing the parallel submissions. This research was in part supported by NSF Grant ACI-1339649 to B.D., and computer time on XSEDE resources was funded by NSF allocation Grant TG-MCB070039N to B.D. J.P. and H.C. acknowledge financial support by the Center for Applied Photonics (CAP) at the University of Konstanz.
REFERENCES
- Bhattacharyya SK, Maciejewska P, Börger L, Stadler M, Gülsün AM, Cicek HB, et al. (2006). Development of fast fiber based UV-Vis multiwavelength detector for an ultracentrifuge. Progress in Colloid and Polymer Science, 131, 9–22. [Google Scholar]
- Brookes E, Boppana RV, & Demeler B (2006). Computing large sparse multivariate optimization problems with an application in biophysics. In Supercomputing ‘06 ACM 0-7695-2700-0/06. [Google Scholar]
- Brookes E, Cao W, & Demeler B (2010). A two-dimensional spectrum analysis for sedimentation velocity experiments of mixtures with heterogeneity in molecular weight and shape. European Biophysics Journal, 39(3), 405–414. [DOI] [PubMed] [Google Scholar]
- Brookes E, & Demeler B (2006). Genetic algorithm optimization for obtaining accurate molecular weight distributions from sedimentation velocity experiments. In Wandrey C & Cölfen H (Eds.), Progress in Colloid and Polymer Science: 131. Analytical ultracentrifugation VIII (pp. 33–40): Berlin Heidelberg: Springer-Verlag. 10.1007/2882_004. [DOI] [Google Scholar]
- Brookes E, & Demeler B (2007). Parsimonious regularization using genetic algorithms applied to the analysis of analytical ultracentrifugation experiments. In GECCO proceedings ACM 978-1-59593-697-4/07/0007. [Google Scholar]
- Brookes E, & Demeler B (2008). Parallel computational techniques for the analysis of sedimentation velocity experiments in UltraScan. Colloid & Polymer Science, 286(2), 138–148. [Google Scholar]
- Cao W, & Demeler B (2005). Modeling analytical ultracentrifugation experiments with an adaptive space-time finite element solution of the Lamm equation. Biophysical Journal, 87(3), 1589–1602. [DOI] [PMC free article] [PubMed] [Google Scholar]
- Cao W, & Demeler B (2008). Modeling analytical ultracentrifugation experiments with an adaptive space-time finite element solution for multi-component reacting systems. Biophysical Journal, 95(1), 54–65. [DOI] [PMC free article] [PubMed] [Google Scholar]
- Cölfen H, Laue TM, Wohlleben W, Schilling K, Karabudak E, Langhorst BW, et al. (2010). The open AUC project. European Biophysics Journal, 39(3), 347–359. [DOI] [PMC free article] [PubMed] [Google Scholar]
- Correia JJ, & Stafford WF (2015). Sedimentation velocity: A classical perspective. In Cole JL (Ed.), Analytical ultracentrifugation. (pp. 49–80). Amsterdam: Elsevier. [DOI] [PubMed] [Google Scholar]
- Demeler B (2010). Methods for the design and analysis of sedimentation velocity and sedimentation equilibrium experiments with proteins. Current Protocols in Protein Science, 60:7.13.1–7.13.24. [DOI] [PMC free article] [PubMed] [Google Scholar]
- Demeler B, & Brookes E (2008). Monte Carlo analysis of sedimentation experiments. Colloid & Polymer Science, 286(2), 129–137. [Google Scholar]
- Demeler B, Brookes E, & Nagel-Steger L (2009). Analysis of heterogeneity in molecular weight and shape by analytical ultracentrifugation using parallel distributed computing. Methods in Enzymology, 454, 87–113. [DOI] [PubMed] [Google Scholar]
- Demeler B, Brookes E, Wang R, Schirf V, & Kim CA (2010). Characterization of reversible associations by sedimentation velocity with UltraScan. Macromolecular Bioscience, 10(7), 775–782. [DOI] [PubMed] [Google Scholar]
- Demeler B, & Gorbet G (2015). Analytical ultracentrifugation data analysis with UltraScan-III. In Uchiyama S, Stafford WF, & Laue T (Eds.), Analytical ultracentrifugation: Instrumentation, software, and applications: Springer, (to appear in Dec. 2015). [Google Scholar]
- Demeler B, Gorbet G, Zollars D, & Dubbs B (2015). UltraScan-III version 3.3: A comprehensive data analysis software package for analytical ultracentrifugation experiments. http://www.utrascan3.uthscsa.edu/. [Google Scholar]
- Demeler B, Nguyen TL, Gorbet GE, Schirf V, Brookes EH, Mulvaney P, et al. (2014). Characterization of size, anisotropy, and density heterogeneity of nanoparticles by sedimentation velocity. Analytical Chemistry, 86(15), 7688–7695. [DOI] [PMC free article] [PubMed] [Google Scholar]
- Demeler B, & van Holde KE (2004). Sedimentation velocity analysis of highly heterogeneous systems. Analytical Biochemistry, 335(2), 279–288. [DOI] [PubMed] [Google Scholar]
- Gorbet G, Devlin T, Hernandez Uribe B, Demeler AK, Lindsey Z, Ganji S, et al. (2014). A parametrically constrained optimization method for fitting sedimentation velocity experiments. Biophysical Journal, 106(8), 1741–1750. 10.1016/j.bpj.2014.02.022. [DOI] [PMC free article] [PubMed] [Google Scholar]
- Lawson CL, & Hanson RJ (1974). Solving least squares problems. Englewood Cliffs, NJ: Prentice-Hall, Inc. [Google Scholar]
- Memon S, Riedel M, Janetzko F, Demeler B, Gorbet G, Marru S, et al. (2014). Advancements of the UltraScan scientific gateway for open standards-based cyberinfrastructures. Concurrency and Computation: Practice & Experience, 26(13), 2280–2291. 10.1002/cpe.3251, Wiley. [DOI] [Google Scholar]
- Open AUC standard for analytical ultracentrifugation data storage used in UltraScan-III: http://wiki.bcf2.uthscsa.edu/ultrascan3/wiki/Us3Formats. 2015.
- Pearson J, Krause J, Haffke D, Demeler B, Schilling K, & Cölfen H Next generation AUC adds a spectral dimension: Development of multiwavelength detectors for the analytical ultracentrifuge. [DOI] [PubMed] [Google Scholar]
- Pierce M, Marru S, Demeler B, Singh R, & Gorbet G (2014). The Apache Airavata application programming interface: Overview and evaluation with the UltraScan science gateway. In Proceedings of the 9th gateway computing environments workshop (GCE ’14) (pp. 25–29). Piscataway, NJ: IEEE Press. 10.1109/GCE.2014.15. [DOI] [Google Scholar]
- Schuck P, & Demeler B (1999). Direct sedimentation boundary analysis of interference optical data in analytical ultracentrifugation. Biophysical Journal, 76, 2288–2296. [DOI] [PMC free article] [PubMed] [Google Scholar]
- Strauss HM, Karabudak E, Bhattacharyya S, Kretzschmar A, Wohlleben W, & Cölfen H (2008). Performance of a fast fiber based UV/Vis multiwavelength detector for the analytical ultracentrifuge. Colloid and Polymer Science, 286, 121–128. [DOI] [PMC free article] [PubMed] [Google Scholar]
- The Open MPI Project (2004-2015). A high performance message passing library. http://www.open-mpi.org/community/license.php.
- Walter J, Löhr K, Karabudak E, Reis W, Mikhael J, Peukert W, et al. (2014). Multidimensional analysis of nanoparticles with highly disperse properties using multiwavelength analytical ultracentrifugation. ACS Nano, 8, 8871–8886. [DOI] [PubMed] [Google Scholar]
- Walter J, Sherwood PJ, Lin W, Segets D, Stafford WF, & Peukert W (2015). Simultaneous analysis of hydrodynamic and optical properties using analytical ultracentrifugation equipped with multi-wavelength detection. Analytical Chemistry, 87(6), 3396–3403. 10.1021/ac504649c. [DOI] [PubMed] [Google Scholar]
Associated Data
This section collects any data citations, data availability statements, or supplementary materials included in this article.


