

Abstract
Tibetan sheep are indigenous to the Qinghai-Xizang Plateau. Owing to the harsh hypoxic environment in this plateau, the hemoglobin (Hb) protein in Tibetan sheep has undergone adaptive changes over time. Hb is primarily responsible for transporting O2 and CO2 between the lungs and other tissues of the body. The α subunit of Hb, encoded by the HBA gene, is a crucial component of the protein. However, whether variations in the HBA gene sequence affect the adaptation of Tibetan sheep to high-altitude hypoxia remains unclear. In this study, we sequenced the HBA gene and identified three single nucleotide polymorphisms (SNPs). These SNPs were genotyped in Tibetan and Hu sheep using Kompetitive Allele-Specific PCR (KASP). The results showed that the frequencies of the AT genotype and H1H2 haplotype were higher in Tibetan sheep than in Hu sheep. Individuals with the AT genotype exhibited higher P50 levels, whereas those with the H1H2 haplotype exhibited lower PO2 and SaO2 levels. The higher P50 levels indicated that O2 was more readily released from oxygenated Hb into the tissues, with the lower PO2 and SaO2 levels facilitating this process. These findings indicate that variations in the HBA gene sequence contribute to enhancing O2 transfer efficiency in Tibetan sheep.
Keywords: Tibetan sheep, HBA, Hypoxia adaptation
Introduction
Adaptation is one of the fundamental characteristics of life activities. The Qinghai-Xizang Plateau, with an average altitude exceeding 4,000 m, is the world’s highest plateau. At this altitude, the available oxygen (O2) is < 60% of that at sea level [1]. Humans and animals inhabiting the Qinghai-Xizang Plateau have adapted well to the hypobaric hypoxic environment in the plateau. Tibetan sheep are indigenous to this plateau, distributed at an altitude of 2500–5000 m. At present, Tibetan sheep are the most widely raised livestock in the Qinghai-Xizang Plateau, becoming an important economic source for local farmers and herders. In addition, these sheep play an important role in social and cultural traditions [2] and in maintaining the stability of the alpine grassland ecosystem [3].
Owing to severe environmental challenges caused by hypoxia in the Qinghai-Xizang Plateau, Tibetan sheep have undergone adaptive changes at the physiological, biochemical, and genetic levels. Therefore, they represent an ideal animal model for investigating the mechanisms underlying their adaptation to high-altitude hypoxia. Among the adaptive changes in response to high-altitude hypoxia, sequence variations in genes encoding hemoglobin (Hb) are particularly important. Hb is a tetramer consisting of two α and two β polypeptide chains of similar structure and dimension, and its main function is to transport O2 and CO2 between the lungs and other tissues of the body and maintain the acid–base balance of the blood [4]. The realization of this function depends on two states of Hb: tense (T) and relaxed (R). Two αβ dimers (α1β1 and α2β2) are aligned around an axis of symmetry, allowing Hb to form a central cavity that is wider in the T state and narrower in the R state, with the latter having a higher affinity for O2 [5] (Fig. 1). When a ligand (e.g., O2) binds to a subunit of Hb, it triggers a change in its tertiary conformation, which in turn triggers tertiary conformational changes in the other subunits. These changes lead to an increase in the affinity of the ligand for the other subunits, resulting in synergism between the subunits and eventually causing a structural change from the T to the R state [6]. These synergistic effects are observed only in tetramers consisting of two α and two β subunits. When these subunits are separated, the α and β subunits form an α dimer and a β tetramer, respectively; however, neither of them shows synergism [7]. Therefore, the heterogeneous tetrameric structure of Hb provides the structural basis for its binding to O2 in the lungs and the subsequent release of O2 in other tissues of the body.
Fig. 1.

Structures of Hb deoxygenated (T state) (A) and oxygenated (R state) (B) formed by two α-chains (green) and two β-chains (blue). Note the larger central water cavity in the T state
The α subunit encoded by the HBA gene is an essential component of Hb. Studies have shown that mutations in the HBA gene are associated with adaptation to hypoxia. For instance, in plateau deer mice, variations in Hb subunit-encoding genes result in an increased Hb–O2 affinity and the inhibition of sensitivity to allosteric cofactors, such as chloride ions and 2,3-diphosphoglycerate [8], which contributes to the binding of Hb to O2. This phenomenon has also been observed in marmotine ground squirrels (subfamily Xerinae, tribe Marmotini) [9]. Moreover, some positively selected sites in the HBA gene have been associated with hypoxia tolerance in animals, such as cetaceans [10, 11]. The formation of a complex between Hb and glutathione can increase the affinity of Hb for O2 in humans and some other mammals [12, 13]. However, loss-of-function or loss-of-allele mutations in the HBA gene can lead to α-thalassemia, an autosomal recessive disease associated with the formation of β-tetramers and hemolytic anemia [14]. In addition to contributing to gas transport in erythrocytes, HBA is expressed in the vascular wall, especially at the junction of vascular endothelial cells and smooth muscle cells, and plays an important role in regulating nitric oxide (NO) signaling between these cells [15]. Although the HBA gene plays an essential role in gas transport and vascular function, the effects of sequence variations in this gene on the adaptation of Tibetan sheep to high-altitude hypoxia remain unclear. In this study, we investigated these effects using Tibetan sheep residing at altitudes of 3000 m and 4700 m and Hu sheep residing at an altitude of 100 m as animal models. Initially, we compared the levels of blood gas indicators between the two sheep breeds. Subsequently, we searched for variations in all exons and introns of the HBA gene via Sanger sequencing and genotyped the identified variants in both sheep breeds using Kompetitive Allele-Specific PCR (KASP). Finally, correlation analysis was performed between blood gas indicators and genotypes or haplotype combinations. Based on the data of blood gas indicators and HBA sequence variations, this study suggests that sequence variations in HBA partially explain how Tibetan sheep adapt to high-altitude hypoxia.
Materials and methods
All animal experiments were conducted according to the animal protection and use guidelines established by the Ministry of Science and Technology of the People’s Republic of China (Approval number: 2006–398).
Animal models and measurement of blood gas indicators
Variations in all axons and introns of the HBA gene were examined in 341 Hu sheep residing at an altitude of 100 m (low altitude [L]; Hangzhou City, Zhejiang Province, China), 341 Tibetan sheep residing at an altitude of 3000 m (middle altitude [M]; Gannan Tibetan Autonomous Prefecture, Gansu Province, China), and 50 Tibetan sheep residing at an altitude of 4700 m (high altitude [H]; Naqu City, Tibet Autonomous Region, China) (Fig. 2). All sheep were naturally grazed with no supplemental feeding and were approximately 3 years old.
Fig. 2.
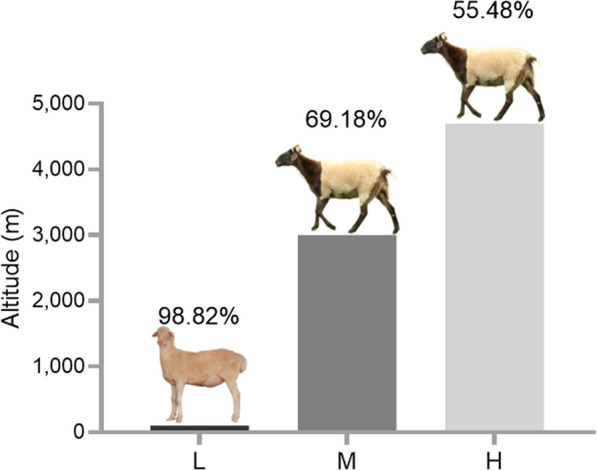
The Altitude distribution of sheep in this study: low-altitude (L) = 100 m; middle-altitude (M) = 3000 m; and high-altitude (H) = 4700 m. The percentage in this figure is the PO2 at that altitude relative to the sea level
Jugular vein blood was collected from all sheep in 5-mL sodium heparin tubes. The blood was added dropwise onto a TFN paper (Munktell Filter AB, Falun, Sweden) to extract and purify DNA using a two-step procedure described previously [16]. Furthermore, jugular vein blood samples of 230, 282, and 42 sheep from the L, M, and H groups, respectively, were used for the assessment of blood gas indicators on an i-STAT blood gas analyzer (Abbott, Chicago, IL, USA). The blood gas indicators assessed included pondus hydrogenii (pH), partial pressure of oxygen (PO2), oxygen saturation (SaO2), partial pressure of carbon dioxide (PCO2), total carbon dioxide (TCO2), hematocrit (Hct), Hb concentration, glucose (Glu) concentration, base excess (BE), bicarbonate ion (HCO3−), serum sodium (Na+), serum potassium (K+), and serum calcium (Ca2+). The partial pressure of oxygen at which Hb was 50% saturated with O2 (P50) was calculated as an indicator of Hb–O2 affinity based on the pH, PO2, and SaO2 values using the following formula [17]:
The Hill constant (n) for Hb was set to 2.7. The PO2 in venous blood at 37℃ was converted to PO2 at pH 7.4 using the following formula:
PCR and genotyping
The HBA gene has a total of three exons and two introns. The primers for HBA were designed using the Primer 5.0 tool (Table 1). The genomic DNA of 20 Tibetan sheep from the M group was used to amplify the sequence of HBA, followed by the sequencing of all amplicons. Primer synthesis, amplification, and sequencing were performed by Sangon Biotech Co., Ltd. (Shanghai, China). The resulting sequences were analyzed using BLAST to detect single nucleotide polymorphisms (SNPs), and KASP was subsequently used for genotyping. Both BLAST and KASP were performed by Gentides Biotech Co., Ltd. (Wuhan, China) (Table 2). After genotyping, the fluorescence data were analyzed using an enzyme marker with fluorescence resonance energy transfer function, and genotyping maps were generated using the LGC-OMEGA software.
Table 1.
Primer information for the HBA gene
| Gene | Forward primer sequence (5' – 3') | Forward primer sequence (5' – 3') |
|---|---|---|
| HBA | GACCCCGACACCCTACACGCTC | GGGGAACTTGGTTCAGCAGATTCTG |
Due to the short sequence of the HBA gene (≈ 769 bp), a pair of primers can amplify all its exons and introns
Table 2.
The genotype primers of three SNPs of HBA gene
| Gene | Position | Genotype primer sequence (5' to 3') |
|---|---|---|
| HBA | g.758709 A > T | F (A): GAAGGTGACCAAGTTCATGCTCGGCAACGCTGGAGCTTA |
| F (T): GAAGGTCGGAGTCAACGGATTCGGCAACGCTGGAGCTTT | ||
| R: CGGTGCTCACCTCTCCAGAG | ||
| g.758789 G > T | F (G): GAAGGTGACCAAGTTCATGCTGCGCGTCCTTGTCCCG | |
| F (T): GAAGGTCGGAGTCAACGGATTGGCGCGTCCTTGTCCCT | ||
| R: GGTGAAGAGGCGGGAAAGC | ||
| g.758808 T > C | F (T): GAAGGTGACCAAGTTCATGCTCCGCTCGGCCTGAGCCT | |
| F (C): GAAGGTCGGAGTCAACGGATTCGCTCGGCCTGAGCCC | ||
| R: GGGGAAGTAGGTCTTGGTGGTG |
Statistical analysis
The SPSS (version 19.0) software was used to compare blood gas indicators between Tibetan and Hu sheep using the following general linear model: Y = µ + A + S + A*S + ε, wherein Y represents the phenotypic observation; µ represents the mean population; A and S represent the effects of altitude and sex, respectively; A*S represents the reciprocal effect of altitude and sex; and ε represents random error. The blood gas indicators of sheep in the L group were used as baseline, and changes in the blood gas indicators of sheep in the M and H groups were compared with those in the L group (P < 0.05).
After the successful genotyping of SNPs in the HBA gene, allele frequencies, genotype frequencies, effective number of alleles (Ne), heterozygosity (He), homozygosity (Ho), and polymorphism information content (PIC) were calculated using formulas reported by Botstein et al. [18]. Hardy–Weinberg equilibrium (HWE) was tested using the chi-square (χ2) test. Linkage disequilibrium analysis and haplotype construction were performed using Haploview (version 4.2) [19]. The correlation between blood gas indicators and different genotypes or haplotype combinations was analyzed in the SPSS (version 19.0) software using the following general linear model: Y = µ + G + A + S + G*A + A*S + G*S + G*A*S + ε, wherein Y represents the phenotypic observation; μ represents the mean population; G represents the effect of the genotype (when analyzing haplotype combinations, G is replaced with H, that is, the effect of the haplotype combination); A and S represent the effects of altitude and sex, respectively; G*A, A*S, and G*S represent the reciprocal effects of genotype and altitude, altitude and sex, and genotype and sex, respectively; G*A*S represents the reciprocal effects of genotype, altitude, and sex; and ε represents random error. All experimental data were expressed as the mean ± SD. Differences were estimated using Duncan's test, with a P value of < 0.05 or < 0.01 indicating significant or extremely significant differences.
Results
Differences in blood gas indicators between Hu and Tibetan sheep
The levels of blood gas indicators were compared among the L, M, and H groups of sheep. The results showed that the levels of PO2, SaO2, PCO2, Hct, Hb, TCO2, Glu, HCO3−, and K+ decreased with an increase in the altitude (P < 0.05), whereas Ca2+ levels showed the opposite trend (P < 0.05). The pH, BE, and Na+ levels decreased initially but increased subsequently with an increase in the altitude (P < 0.05). On the contrary, P50 was not significantly different among the three groups (P > 0.05) (Table 3 and Fig. 3).
Table 3.
Blood-gas indicators of sheep at different altitudes
| Blood-gas indicators | Altitudes | ||
|---|---|---|---|
| L | M | H | |
| PO2 (mmHg) | 42.67 ± 7.68a | 34.59 ± 6.44b | 24.05 ± 3.43c |
| SaO2 (%) | 76.98 ± 8.33a | 64.33 ± 9.90b | 46.40 ± 10.57c |
| P50 (mmHg) | 26.57 ± 0.48 | 26.57 ± 0.39 | 26.66 ± 0.38 |
| PCO2 (mmHg) | 42.54 ± 6.52a | 38.18 ± 6.06b | 32.93 ± 4.65c |
| TCO2 (mmol/L) | 27.64 ± 2.21a | 23.74 ± 2.96b | 24.10 ± 2.86b |
| Hct (%) | 36.10 ± 5.83a | 34.38 ± 2.97b | 28.07 ± 3.50c |
| Hb (g/dL) | 12.27 ± 1.99a | 11.69 ± 1.01b | 9.55 ± 1.20c |
| Glu (mg/dL) | 67.55 ± 7.43a | 62.09 ± 12.00b | 62.81 ± 7.47b |
| pH | 7.41 ± 0.06b | 7.38 ± 0.06c | 7.45 ± 0.07a |
| BE (mmol/L) | 1.93 ± 2.46a | − 2.43 ± 3.24c | − 0.83 ± 3.20b |
| HCO3− (mmol/L) | 26.64 ± 2.22a | 22.57 ± 2.82b | 23.12 ± 2.75b |
| Na+ (mmol/L) | 144.95 ± 2.23a | 143.50 ± 2.41b | 144.33 ± 1.22a |
| K+ (mmol/L) | 5.09 ± 0.72a | 5.07 ± 1.24a | 4.34 ± 0.45b |
| Ca2+ (mmol/L) | 1.26 ± 0.08b | 1.30 ± 0.09a | 1.31 ± 0.07a |
Differences in blood-gas indicators of sheep at low (L), middle (M) and high (H) altitudes. Partial pressure of oxygen (PO2), Oxygen saturation (SaO2), Half-saturation oxygen partial pressure (P50), Partial pressure of carbon dioxide (PCO2), Total carbon dioxide (TCO2), Hematocrit (Hct), Hemoglobin concentration (Hb), Glucose concentration (Glu), Pondus Hydrogenii (pH), Base excess (BE), Bicarbonate ion (HCO3−), Serum sodium (Na+), Serum potassium (K+) and Serum calcium (Ca2+) are shown. Different lowercase letters in the same line indicate that the difference was significant (P < 0.05)
Fig. 3.

Changing trends of blood-gas indicators with increasing altitude in sheep, a diagonal line between two points means that the difference is significant, the blood-gas indicators in the patterns have corresponding changing trends
Variations in the HBA gene in Hu and Tibetan sheep
The PCR amplicons of HBA were analyzed via agarose gel electrophoresis (a 2% gel), and the results showed that the bands of the amplicons were clear, complete, and free of contamination (Fig. 4A). Sanger sequencing of the amplicons showed that exon 1 of HBA was mutated at g.758709 (A > T), whereas intron 1 was mutated at g.758789 (G > T) and g.758808 (T > C). These mutations were named SNP1, SNP2, and SNP3, respectively (Fig. 4B).
Fig. 4.

PCR amplicons agarose gel electrophoresis (A) and Sanger-sequencing (B) results (the overlapping peak indicates the SNPs), and KASP genotyping assay results of three SNPs of the HBA gene (C)
The three SNPs were genotyped using KASP in all sheep. The results revealed three genotypes for SNP1, SNP2, and SNP3 each (Fig. 4C). The dominant genotypes of SNP1, SNP2, and SNP3 in the HBA gene were AA (0.961), GG (0.953), and TT (0.821) in the L group; AA (0.745), GG (0.747), and TT (0.607) in the M group; and AA (0.604), GG (0.540), and TT = TC (0.476) in the H group, respectively. In addition, the dominant alleles were A, G, and T; A, G, and T; and A, G, and T, respectively (Table 4). The nucleotide transversion from A to T in SNP1 led to a tyrosine-to-phenylalanine amino acid change; however, SNP2 and SNP3, which were located in the first intron of HBA, did not result in any amino acid change.
Table 4.
Genotype frequency and allele frequency of three SNPs of HBA gene
| Positions | Genotype | Genotype frequency | Allele | Allele frequency | ||||
|---|---|---|---|---|---|---|---|---|
| L (n) | M (n) | H (n) | L | M | H | |||
|
SNP1 A > T |
AA | 0.961 (324) | 0.745 (254) | 0.604 (29) | A | 0.981 | 0.864 | 0.792 |
| AT | 0.039 (13) | 0.237 (81) | 0.375 (18) | T | 0.019 | 0.136 | 0.208 | |
| TT | 0.000 (0) | 0.018 (6) | 0.021 (1) | |||||
|
SNP2 G > T |
GG | 0.953 (321) | 0.747 (254) | 0.540 (27) | G | 0.976 | 0.865 | 0.750 |
| GT | 0.047 (16) | 0.235 (80) | 0.420 (21) | T | 0.024 | 0.135 | 0.250 | |
| TT | 0.000 (0) | 0.018 (6) | 0.040 (2) | |||||
|
SNP3 T > C |
TT | 0.821 (151) | 0.607 (205) | 0.476 (20) | T | 0.908 | 0.787 | 0.714 |
| TC | 0.174 (32) | 0.361 (122) | 0.476 (20) | C | 0.092 | 0.213 | 0.286 | |
| CC | 0.005 (1) | 0.033 (11) | 0.048 (2) | |||||
Population genetic analysis of the three SNPs of the HBA gene
Population genetic analysis revealed that all three SNPs were less polymorphic (PIC < 0.25) and moderately polymorphic (0.25 < PIC < 0.5) in the L and H groups, respectively. SNP1 and SNP2 were less polymorphic and SNP3 was moderately polymorphic in the M group. All three SNPs had higher Ho than He in all three groups and conformed to HWE (P > 0.05). In addition, SNP3 and SNP1 had the highest and lowest Ne in the three groups, respectively (Table 5).
Table 5.
Population genetics analysis of three SNPs of HBA gene
| Positions | Altitudes | PIC1 | He2 | Ho3 | Ne4 | HWE5 |
|---|---|---|---|---|---|---|
| SNP1 A > T | L | 0.0371 | 0.0378 | 0.9622 | 1.0393 | P > 0.05 |
| M | 0.2078 | 0.2355 | 0.7645 | 1.3081 | P > 0.05 | |
| H | 0.2755 | 0.3299 | 0.6701 | 1.4922 | P > 0.05 | |
| SNP2 G > T | L | 0.0453 | 0.0464 | 0.9536 | 1.0486 | P > 0.05 |
| M | 0.2066 | 0.2340 | 0.7660 | 1.3054 | P > 0.05 | |
| H | 0.3047 | 0.3750 | 0.6250 | 1.6000 | P > 0.05 | |
| SNP3 T > C | L | 0.1536 | 0.1677 | 0.8323 | 1.2051 | P > 0.05 |
| M | 0.2791 | 0.3353 | 0.6647 | 1.5044 | P > 0.05 | |
| H | 0.3249 | 0.4082 | 0.5918 | 1.6897 | P > 0.05 |
1 Polymorphism information content; 2 heterozygosity; 3 homozygosity; 4 effective allele numbers; 5 Hardy–Weinberg equilibrium
Linkage disequilibrium analysis showed that the three SNPs of the HBA gene exhibited strong linkage (D’ > 0.9) (Fig. 5). Haplotype analysis revealed three haplotypes in the L and M groups and four haplotypes in the H group. After these haplotypes were combined, three haplotype combinations with frequencies greater than 0.03 were identified in each group (Table 6).
Fig. 5.
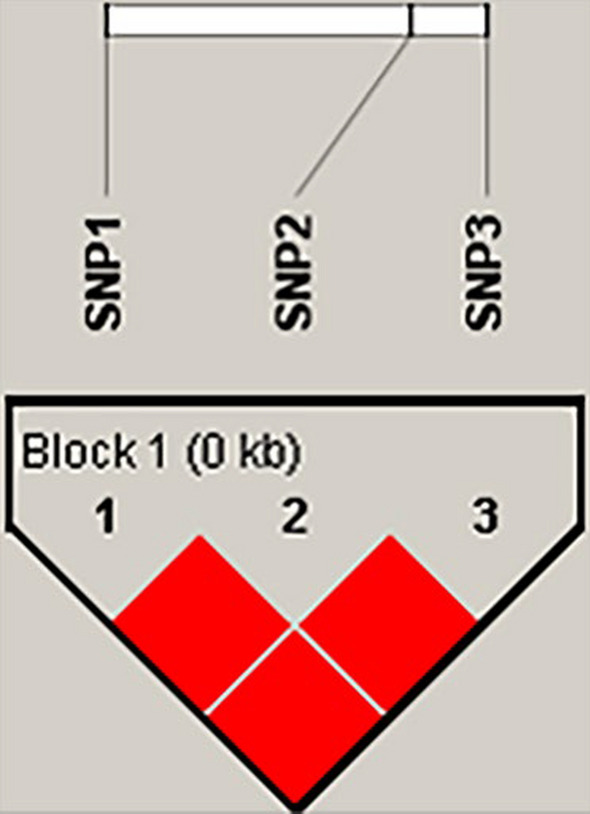
Linkage disequilibrium analysis of three SNPs of HBA gene
Table 6.
Haplotypes and haplotype combinations of three SNPs of HBA gene
| Haplotype | Positions | Frequency | Haplotype combination | Frequency | ||||||
|---|---|---|---|---|---|---|---|---|---|---|
| SNP1 | SNP2 | SNP3 | L | M | H | L | M | H | ||
| H1 (AGT) | A | G | T | 0.907 | 0.787 | 0.729 | H1H1 | 0.833 | 0.602 | 0.488 |
| H2 (TTC) | T | T | C | 0.022 | 0.136 | 0.213 | H1H2 | 0.033 | 0.226 | 0.366 |
| H3 (AGC) | A | G | C | 0.071 | 0.077 | 0.036 | H1H3 | 0.133 | 0.142 | 0.098 |
| H4 (ATC) | A | T | C | —— | —— | 0.021 | ||||
Correlation of the genotypes and haplotype combinations with blood gas indicators
Correlation analysis between SNP genotypes and blood gas indicators showed that individuals with the TT genotype at SNP1 had lower PO2, SaO2, PCO2, TCO2, and BE than individuals with the AA genotype (P < 0.05) and lower SaO2 and P50 than individuals with the AT genotype (P < 0.05). Individuals with the TT genotype at SNP2 had lower PO2 and SaO2 than individuals with the GG and GT genotypes (P < 0.05), lower P50 than individuals with the GT genotype (P < 0.05), and lower TCO2 and BE than individuals with the GG genotype (P < 0.05). Individuals with the CC genotype at SNP3 had lower PO2, SaO2, and PCO2 (P < 0.05) but higher pH (P < 0.05) than individuals with the TT and TC genotypes (Table 7).
Table 7.
The effects of different genotypes of HBA gene three SNPs on blood-gas indicators
| Positions | Blood-gas indicators | Genotype | ||
|---|---|---|---|---|
| AA | AT | TT | ||
| SNP1 A > T | PO2 (mmHg) | 37.97 ± 8.76a | 33.27 ± 6.61ab | 27.67 ± 10.12b |
| SaO2 (%) | 69.40 ± 12.55a | 62.63 ± 12.14a | 52.00 ± 21.00b | |
| P50 (mmHg) | 26.58 ± 0.44ab | 26.67 ± 0.50a | 26.20 ± 0.09b | |
| PCO2 (mmHg) | 40.01 ± 6.87a | 37.78 ± 6.13ab | 32.40 ± 5.23b | |
| TCO2 (mmol/L) | 25.20 ± 3.34a | 24.29 ± 3.10ab | 22.33 ± 2.52b | |
| Hct (%) | 34.99 ± 5.27 | 33.67 ± 4.32 | 32.00 ± 6.08 | |
| Hb (g/dL) | 11.90 ± 1.80 | 11.45 ± 1.48 | 10.87 ± 2.06 | |
| Glu (mg/dL) | 53.21 ± 25.40 | 60.93 ± 13.40 | 68.00 ± 19.08 | |
| pH | 7.40 ± 0.06 | 7.40 ± 0.06 | 7.42 ± 0.09 | |
| BE (mmol/L) | − 0.28 ± 3.59a | − 1.38 ± 3.56ab | − 3.33 ± 3.79b | |
| HCO3− (mmol/L) | 25.10 ± 10.59 | 23.40 ± 3.03 | 21.07 ± 2.57 | |
| Na+ (mmol/L) | 143.84 ± 6.61 | 143.95 ± 2.36 | 145.00 ± 1.00 | |
| K+ (mmol/L) | 5.05 ± 1.01 | 4.97 ± 1.24 | 4.65 ± 0.35 | |
| Ca2+ (mmol/L) | 1.31 ± 0.31 | 1.30 ± 0.09 | 1.33 ± 0.10 | |
| GG | GT | TT | ||
| SNP2 G > T | PO2 (mmHg) | 37.99 ± 8.73a | 33.52 ± 7.29a | 26.75 ± 8.46b |
| SaO2 (%) | 69.39 ± 12.55a | 63.07 ± 12.43a | 48.75 ± 18.34b | |
| P50 (mmHg) | 26.57 ± 0.44ab | 26.67 ± 0.50a | 26.25 ± 0.13b | |
| PCO2 (mmHg) | 40.02 ± 6.84 | 37.65 ± 6.29 | 34.88 ± 6.54 | |
| TCO2 (mmol/L) | 25.19 ± 3.33a | 24.49 ± 3.15ab | 22.75 ± 2.22b | |
| Hct (%) | 35.02 ± 5.24 | 33.37 ± 4.41 | 32.25 ± 4.99 | |
| Hb (g/dL) | 11.91 ± 1.78 | 11.34 ± 1.50 | 10.95 ± 1.69 | |
| Glu (mg/dL) | 53.44 ± 25.28 | 61.30 ± 13.45 | 66.50 ± 15.86 | |
| pH | 7.40 ± 0.06 | 7.41 ± 0.07 | 7.40 ± 0.09 | |
| BE (mmol/L) | − 0.32 ± 3.57a | − 1.09 ± 3.66ab | − 3.25 ± 3.10b | |
| HCO3− (mmol/L) | 25.07 ± 10.63 | 23.59 ± 3.07 | 21.48 ± 2.25 | |
| Na+ (mmol/L) | 143.84 ± 6.64 | 144.04 ± 2.38 | 145.00 ± 0.82 | |
| K+ (mmol/L) | 5.05 ± 1.01 | 4.93 ± 1.20 | 4.60 ± 0.26 | |
| Ca2+ (mmol/L) | 1.31 ± 0.31 | 1.30 ± 0.09 | 1.32 ± 0.08 | |
| TT | TC | CC | ||
| SNP3 T > C | PO2 (mmHg) | 37.38 ± 9.27a | 34.20 ± 6.63a | 28.83 ± 7.55b |
| SaO2 (%) | 68.19 ± 13.24a | 64.00 ± 11.77a | 56.00 ± 16.70b | |
| P50 (mmHg) | 26.56 ± 0.44 | 26.64 ± 0.47 | 26.49 ± 0.42 | |
| PCO2 (mmHg) | 39.07 ± 6.46a | 38.81 ± 6.94a | 33.10 ± 4.28b | |
| TCO2 (mmol/L) | 24.67 ± 3.27 | 24.64 ± 3.23 | 23.50 ± 3.56 | |
| Hct (%) | 34.59 ± 4.72 | 33.85 ± 4.28 | 31.67 ± 5.72 | |
| Hb (g/dL) | 11.76 ± 1.61 | 11.51 ± 1.46 | 10.77 ± 1.95 | |
| Glu (mg/dL) | 55.90 ± 23.40 | 59.99 ± 14.94 | 63.33 ± 14.07 | |
| pH | 7.40 ± 0.06b | 7.40 ± 0.07b | 7.44 ± 0.08a | |
| BE (mmol/L) | − 0.86 ± 3.62 | − 1.17 ± 3.56 | − 1.67 ± 4.50 | |
| HCO3− (mmol/L) | 24.84 ± 13.08 | 23.69 ± 3.11 | 22.48 ± 3.67 | |
| Na+ (mmol/L) | 143.57 ± 8.02 | 143.87 ± 2.75 | 144.83 ± 2.14 | |
| K+ (mmol/L) | 5.01 ± 1.05 | 5.03 ± 1.23 | 4.63 ± 0.22 | |
| Ca2+ (mmol/L) | 1.31 ± 0.28 | 1.33 ± 0.36 | 1.31 ± 0.08 | |
Different lowercase letters in the same line indicate that the difference was significant (P < 0.05)
Correlation analysis between haplotype combinations and blood gas indicators showed that individuals with the H1H2 haplotype had lower PO2 and SaO2 than individuals with the H1H1 and H1H3 haplotypes (P < 0.05) and lower PCO2 than individuals with the H1H3 haplotype (P < 0.05) (Table 8).
Table 8.
The effects of different haplotype combinations of HBA gene three SNPs on blood-gas indicators
| Blood-gas indicators | Haplotype combination | ||
|---|---|---|---|
| H1H1 | H1H2 | H1H3 | |
| PO2 (mmHg) | 37.48 ± 9.27a | 33.16 ± 6.34b | 35.90 ± 6.45a |
| SaO2 (%) | 68.37 ± 13.21a | 62.28 ± 12.20b | 66.45 ± 10.82a |
| P50 (mmHg) | 26.56 ± 0.44 | 26.69 ± 0.52 | 26.57 ± 0.39 |
| PCO2 (mmHg) | 39.06 ± 6.50ab | 37.86 ± 6.08b | 40.45 ± 7.64a |
| TCO2 (mmol/L) | 24.67 ± 3.28 | 24.24 ± 2.99 | 24.98 ± 3.50 |
| Hct (%) | 34.62 ± 4.74 | 33.81 ± 4.32 | 34.42 ± 3.96 |
| Hb (g/dL) | 11.77 ± 1.62 | 11.49 ± 1.48 | 11.71 ± 1.36 |
| Glu (mg/dL) | 55.91 ± 23.60 | 61.69 ± 12.27 | 57.08 ± 18.05 |
| pH | 7.40 ± 0.06 | 7.40 ± 0.06 | 7.39 ± 0.06 |
| BE (mmol/L) | − 0.85 ± 3.62 | − 1.52 ± 3.45 | − 1.04 ± 3.55 |
| HCO3− (mmol/L) | 24.86 ± 13.19 | 23.29 ± 2.91 | 24.01 ± 3.31 |
| Na+ (mmol/L) | 143.58 ± 8.08 | 143.92 ± 2.41 | 144.63 ± 3.17 |
| K+ (mmol/L) | 5.00 ± 1.04 | 4.97 ± 1.28 | 5.18 ± 1.19 |
| Ca2+ (mmol/L) | 1.31 ± 0.28 | 1.31 ± 0.09 | 1.37 ± 0.58 |
Different lowercase letters in the same line indicate that the difference was significant (P < 0.05)
Discussion
Blood gas indicators play a crucial role in the adaptation of animals to high-altitude hypoxic environments. PO2 accounts for 21% of the barometric pressure in the Qinghai-Xizang Plateau. The barometric pressure decreases with altitude, leading to hypobaric hypoxia in animals inhabiting the plateau [1]. Consistently, in this study, the PO2 in the blood of sheep decreased with an increase in altitude (P < 0.05). This decrease in PO2 may be the reason for the simultaneous decrease in SaO2 (P < 0.05) [20]. Furthermore, an increase in Hb concentration is considered a typical adaptive response to high altitudes. However, in this study, Hb concentration and Hct levels decreased with an increase in altitude (P < 0.05). Similar phenomena have been observed in Tibetans [21, 22] and Tibetan horses [23]. These findings may be attributed to the weak response of some physiological and biochemical indicators to hypoxia in species indigenous to high-altitude regions [24]. Moderate increases in Hb concentration and Hct levels indicate an increase in the number of O2 carriers; however, excessive increases in Hb concentration and Hct levels can increase the viscosity of the blood and result in increased resistance, which may cause pulmonary hypertension and damage microcirculation. Therefore, animals inhabiting high-altitude regions may enhance their O2 transport efficiency through other means, such as by increasing the respiratory rate [25, 26], heart rate [27], and plasma volume [28]. A higher respiratory rate indicates higher pulmonary ventilation, i.e., more CO2 is exhaled, resulting in a decrease in PCO2, TCO2, and HCO3−, accompanied by an increase in pH and BE. This hypoxia-induced shift of the acid–base balance toward alkalinity reduces sympathetic nervous tension and cardiovascular constriction [29], favoring the avoidance of pulmonary hypertension. In addition, a lower PO2 and Hb concentration indicate inhibition of O2 delivery; however, animals inhabiting high-altitude environments tend to be more efficient in their use of O2. For example, more use of carbohydrates as substrates for energy metabolism, that is, increased oxidation of carbohydrates and glycolysis, leads to a decrease in blood Glu levels [30]. This phenomenon is observed in both Tibetans and Sherpas [31, 32], as carbohydrates provide more ATP when the same amount of O2 is consumed [33]. Altogether, the changes in blood gas indicators in response to an increase in altitude help Tibetan sheep overcome chronic hypobaric hypoxia.
The protein encoded by the HBA gene is one of the subunits that comprise Hb, which plays an important role in maintaining O2 homeostasis and acid–base balance in the body [4]. This study showed that the frequency of the AT genotype at SNP1 of the HBA gene was higher in Tibetan sheep residing at medium (M, 3000 m) and high (H, 4700 m) altitudes than in Hu sheep residing at low (L, 100 m) altitude and that individuals with the AT genotype had higher P50 (P < 0.05). When P50 was elevated, the O2 dissociation curve shifted to the right, resulting in a lower Hb–O2 affinity, which indicated that O2 was more readily dissociated from oxygenated Hb to mitigate tissue hypoxia. A high Hb–O2 affinity does not enhance the organism’s ability to adapt to the hypoxic environment [34]; on the contrary, the organism may adapt to the hypoxic environment by decreasing Hb–O2 affinity, that is, by increasing P50. The change in the nucleotide from A to T in SNP1 results in an amino acid change from tyrosine to phenylalanine. This non-synonymous mutation may affect the structure and function of the Hb protein, resulting in an increase in P50. This change may explain the higher frequency of the AT genotype in Tibetan sheep residing at M and H altitudes. However, this finding requires further validation in vitro and in vivo. The polymorphic information content of SNP1 was higher at both M and H altitudes than at L altitude, and is in Hardy–Weinberg equilibrium, indicates some potential for selection. SNP2 and SNP3 were found to be located in the first intron of the HBA gene and did not cause any amino acid changes. However, the correlation analysis found that the genotypes of the two SNPs were correlated with some blood gas indicators. Therefore, we speculate that the two SNPs affect blood gas indicators by influencing variable shearing of the HBA gene [35, 36], or by participating in the regulation of transcriptional activity of the HBA gene [37]. And again, the above speculations requires further validation in vitro and in vivo.
When investigating the effects of genetic variations on phenotype, the results obtained by analyzing the relationship between an SNP and the phenotype are limited, and richer and more reliable information can be obtained by deriving haplotypes from multiple SNPs and analyzing the effects of these haplotypes on the phenotype [38, 39]. In this study, Linkage disequilibrium analysis revealed that all three SNPs of the HBA gene had strong linkage, which satisfies the requirement for constructing haplotypes [39]. Based on this, three haplotype combinations with frequencies higher than 0.03 were constructed. The frequency of the H1H2 haplotype was higher in Tibetan sheep at M and H altitudes than in Hu sheep at L altitude, and individuals with the H1H2 haplotype had lower PO2, SaO2, and PCO2 values (P < 0.05). Lower PO2 and SaO2 allow O2 to dissociate from Hb more readily [40], this contributes to the alleviation of tissue hypoxia. In general, animals adapt to hypoxia in two main ways: firstly, increased efficiency of O2 delivery; and secondly, increased efficiency of O2 use. Oxygen dissociates more readily from Hb reflecting the increased efficiency of O2 delivery, and animals inhabiting high-altitudes regions have enhanced carbohydrates metabolism, especially glycolysis, reflecting the increased efficiency of O2 use. Since more energy is released from carbohydrate oxidation than from fatty acid or amino acid oxidation per mole of oxygen consumed [33]. This is a common adaptive response to hypoxia [31, 32, 41]. The lower PCO2 value in individuals with the H1H2 haplotype may be attributed to enhanced glycolysis, as glycolysis occurring in the cytoplasm does not produce CO2 [42], resulting in lower PCO2.
Conclusion
This study reveals that the g.758709, g.758789, and g.758808 variants in the HBA gene are associated with an increased O2 transfer efficiency in Tibetan sheep. The frequencies of the AT genotype and H1H2 haplotype were higher in Tibetan sheep than in Hu sheep. Individuals with the AT genotype and H1H2 haplotype exhibited higher P50 levels and lower PO2 and SaO2 levels. The higher P50 level facilitates the release of O2 from oxygenated Hb into the tissues, and the lower PO2 and SaO2 levels enhance this process. Altogether, these factors promote O2 transfer efficiency and enable Tibetan sheep to adapt to hypoxia in the Qinghai-Xizang Plateau.
Acknowledgements
We are grateful to our Tibetan friends Jiayangdaji and Daojirenqing for their enthusiastic help during sample collection.
Author contributions
Conceptualization, Pengfei Zhao and Jianming Ren; Data curation, Hui Jia; Formal analysis, Yaoyao Lu; Funding acquisition, Pengfei Zhao and Xiong Ma; Investigation, Ying Ma; Methodology, Lan Zhang; Project administration, Jianming Ren; Resources, Mingjie Hou; Software, Yunxin Min; Supervision, Xiong Ma; Validation, Chunyang Li; Visualization, Pengfei Zhao; Writing-original draft, Pengfei Zhao; Writing-review & editing, Xiong Ma.
Funding
This research was funded by the 2024 Provincial Talent Projects in Gansu Province.
Availability of data and material
The datasets during and/or analyzed during the current study available from the corresponding author on reasonable request.
Declarations
Ethics approval and consent to participate
The animal study was reviewed and approved by the Ethics Committee of Gansu Minzu Normal University (Hezuo, China; Ethic approval file No. GMNU-EC-2024–022, 11 April 2024). All experimental procedures and sample collection methods were performed in accordance with approved guidelines and regulations to ensure animal welfare.
Consent for publication
The manuscript is approved by all authors for publication.
Competing interests
The authors declare that they have no competing interests.
Footnotes
Publisher's Note
Springer Nature remains neutral with regard to jurisdictional claims in published maps and institutional affiliations.
Contributor Information
Pengfei Zhao, Email: 15002570910@163.com.
Xiong Ma, Email: maxiong2004@163.com.
References
- 1.Beall CM. Adaptation to high altitude: phenotypes and genotypes. Annu Rev Anthropol. 2014;43:251–72. 10.1146/annurev-anthro-102313-030000. [Google Scholar]
- 2.Liu J, Ding X, Zeng Y, et al. Genetic diversity and phylogenetic evolution of Tibetan sheep based on mtDNA D-loop sequences. PLoS ONE. 2016;11(7):e159308. 10.1371/journal.pone.0159308. [DOI] [PMC free article] [PubMed] [Google Scholar]
- 3.Jing X, Wang W, Degen A, et al. Tibetan sheep have a high capacity to absorb and to regulate metabolism of SCFA in the rumen epithelium to adapt to low energy intake. Br J Nutr. 2020;123(7):721–36. 10.1017/S0007114519003222. [DOI] [PubMed] [Google Scholar]
- 4.Storz JF. Hemoglobin-oxygen affinity in high-altitude vertebrates: is there evidence for an adaptive trend? J Exp Biol. 2016;219(Pt 20):3190–203. 10.1242/jeb.127134. [DOI] [PMC free article] [PubMed] [Google Scholar]
- 5.Safo MK, Ahmed MH, Ghatge MS, et al. Hemoglobin-ligand binding: understanding Hb function and allostery on atomic level. Biochim Biophys Acta. 2011;1814(6):797–809. 10.1016/j.bbapap.2011.02.013. [DOI] [PubMed] [Google Scholar]
- 6.Muirhead H, Perutz MF. Structure of haemoglobin. a three-dimensional Fourier synthesis of reduced human haemoglobin at 5–5 a resolution. Nature. 1963;199:633–8. 10.1038/199633a0. [DOI] [PubMed] [Google Scholar]
- 7.Tyuma I, Shimizu K, Imai K. Effect of 2,3-diphosphoglycerate on the cooperativity in oxygen binding of human adult hemoglobin. Biochem Biophys Res Commun. 1971;43(2):423–8. 10.1016/0006-291x(71)90770-4. [DOI] [PubMed] [Google Scholar]
- 8.Storz JF, Runck AM, Moriyama H, et al. Genetic differences in hemoglobin function between highland and lowland deer mice. J Exp Biol. 2010;213(Pt 15):2565–74. 10.1242/jeb.042598. [DOI] [PMC free article] [PubMed] [Google Scholar]
- 9.Revsbech IG, Tufts DM, Projecto-Garcia J, Moriyama H, Weber RE, Storz JF, Fago A. Hemoglobin function and allosteric regulation in semi-fossorial rodents (family Sciuridae) with different altitudinal ranges. J Exp Biol. 2013;216(22):4264–71. https://doi.org/10.1242/jeb.091397 [DOI] [PMC free article] [PubMed] [Google Scholar]
- 10.Tian R, Wang Z, Niu X, et al. Evolutionary genetics of hypoxia tolerance in cetaceans during diving. Genome Biol Evol. 2016;8(3):827–39. 10.1093/gbe/evw037. [DOI] [PMC free article] [PubMed] [Google Scholar]
- 11.Nery MF, Arroyo JI, Opazo JC. Genomic organization and differential signature of positive selection in the alpha and beta globin gene clusters in two cetacean species. Genome Biol Evol. 2013;5(12):2359–67. 10.1093/gbe/evt176. [DOI] [PMC free article] [PubMed] [Google Scholar]
- 12.Anashkina AA, Simonenko SY, Orlov YL, et al. Glutathione non-covalent binding sites on hemoglobin and major glutathionylation target betacys93 are conservative among both hypoxia-sensitive and hypoxia-tolerant mammal species. Int J Mol Sci. 2023;25(1):53. 10.3390/ijms25010053. [DOI] [PMC free article] [PubMed] [Google Scholar]
- 13.Fenk S, Melnikova EV, Anashkina AA, et al. Hemoglobin is an oxygen-dependent glutathione buffer adapting the intracellular reduced glutathione levels to oxygen availability. Redox Biol. 2022;58:102535. 10.1016/j.redox.2022.102535. [DOI] [PMC free article] [PubMed] [Google Scholar]
- 14.Farashi S, Harteveld CL. Molecular basis of alpha-thalassemia. Blood Cells Mol Dis. 2018;70:43–53. 10.1016/j.bcmd.2017.09.004. [DOI] [PubMed] [Google Scholar]
- 15.Straub AC, Lohman AW, Billaud M, et al. Endothelial cell expression of haemoglobin alpha regulates nitric oxide signalling. Nature. 2012;491(7424):473–7. 10.1038/nature11626. [DOI] [PMC free article] [PubMed] [Google Scholar]
- 16.Zhou H, Hickford JG, Fang Q. A two-step procedure for extracting genomic DNA from dried blood spots on filter paper for polymerase chain reaction amplification. Anal Biochem. 2006;354(1):159–61. 10.1016/j.ab.2006.03.042. [DOI] [PubMed] [Google Scholar]
- 17.Lichtman MA, Murphy MS, Adamson JW. Detection of mutant hemoglobins with altered affinity for oxygen: a simplified technique. Ann Intern Med. 1976;84(5):517. 10.7326/0003-4819-84-5-517. [DOI] [PubMed] [Google Scholar]
- 18.Botstein D, White RL, Skolnick M, et al. Construction of a genetic linkage map in man using restriction fragment length polymorphisms. Am J Hum Genet. 1980;32(3):314–31. [PMC free article] [PubMed] [Google Scholar]
- 19.Barrett JC, Fry B, Maller J, et al. Haploview: analysis and visualization of LD and haplotype maps. Bioinformatics. 2005;21(2):263–5. 10.1093/bioinformatics/bth457. [DOI] [PubMed] [Google Scholar]
- 20.Otten EJ. High altitude: an exploration of human adaptation. J Emerg Med. 2003;25(3):345–6. 10.1016/S0736-4679(03)00209-9. [Google Scholar]
- 21.Simonson TS, Yang Y, Huff CD, et al. Genetic evidence for high-altitude adaptation in Tibet. Science. 2010;329(5987):72–5. 10.1126/science.1189406. [DOI] [PubMed] [Google Scholar]
- 22.Yang J, Jin Z, Chen J, et al. Genetic signatures of high-altitude adaptation in Tibetans. PNAS. 2017;114(16):4189–94. 10.1073/pnas.1617042114. [DOI] [PMC free article] [PubMed] [Google Scholar]
- 23.Liu X, Zhang Y, Li Y, et al. EPAS1 gain-of-function mutation contributes to high-altitude adaptation in Tibetan horses. Mol Biol Evol. 2019;36(11):2591–603. 10.1093/molbev/msz158. [DOI] [PMC free article] [PubMed] [Google Scholar]
- 24.Petousi N, Croft QP, Cavalleri GL, et al. Tibetans living at sea level have a hyporesponsive hypoxia-inducible factor system and blunted physiological responses to hypoxia. Appl Physiol. 2014;116(7):893–904. 10.1152/japplphysiol.00535. [DOI] [PMC free article] [PubMed] [Google Scholar]
- 25.Wang G, He Y, Luo Y. Expression of OPA1 and Mic60 genes and their association with mitochondrial cristae morphology in Tibetan sheep. Cell Tissue Res. 2019;376(2):273–9. 10.1007/s00441-018-2975-y. [DOI] [PubMed] [Google Scholar]
- 26.Zhuang J, Droma T, Sun S, et al. Hypoxic ventilatory responsiveness in Tibetan compared with Han residents of 3,658 m. J Appl Physiol. 1993;74(1):303–11. 10.1152/jappl.1993.74.1.303. [DOI] [PubMed] [Google Scholar]
- 27.Rao M, Li J, Qin J, et al. left ventricular function during acute high-altitude exposure in a large group of healthy young Chinese men. PLoS ONE. 2015;10(1):e116936. 10.1371/journal.pone.0116936. [DOI] [PMC free article] [PubMed] [Google Scholar]
- 28.Stembridge M, Williams AM, Gasho C, et al. The overlooked significance of plasma volume for successful adaptation to high altitude in Sherpa and Andean natives. PNAS. 2019;116(33):16177–9. 10.1073/pnas.1909002116. [DOI] [PMC free article] [PubMed] [Google Scholar]
- 29.Swenson ER. Hypoxia and its acid-base consequences: from mountains to malignancy. Adv Exp Med Biol. 2016;903:301–23. 10.1007/978-1-4899-7678-9_21. [DOI] [PubMed] [Google Scholar]
- 30.Kelly KR, Williamson DL, Fealy CE, et al. Acute altitude-induced hypoxia suppresses plasma glucose and leptin in healthy humans. Metabolism. 2010;59(2):200–5. 10.1016/j.metabol. [DOI] [PMC free article] [PubMed] [Google Scholar]
- 31.Ge R, Simonson TS, Cooksey RC, et al. Metabolic insight into mechanisms of high-altitude adaptation in Tibetans. Mol Genet Metab. 2012;106(2):244–7. 10.1016/j.ymgme.2012.03.003. [DOI] [PMC free article] [PubMed] [Google Scholar]
- 32.Horscroft JA, Kotwica AO, Laner V, et al. Metabolic basis to Sherpa altitude adaptation. PNAS. 2017;114(24):6382–7. 10.1073/pnas.1700527114. [DOI] [PMC free article] [PubMed] [Google Scholar]
- 33.Welch KC, Altshuler DL, Suarez RK. Oxygen consumption rates in hovering hummingbirds reflect substrate-dependent differences in P/O ratios: carbohydrate as a “premium fuel.” J Exp Biol. 2007;210(Pt 12):2146–53. 10.1242/jeb.005389. [DOI] [PubMed] [Google Scholar]
- 34.Tashi T, Feng T, Koul P, et al. High altitude genetic adaptation in Tibetans: no role of increased hemoglobin-oxygen affinity. Blood Cells Mol Dis. 2014;53(1–2):27–9. 10.1016/j.bcmd.2014.02.003. [DOI] [PMC free article] [PubMed] [Google Scholar]
- 35.Xu L, Liu T, Chung K, et al. Structural insights into intron catalysis and dynamics during splicing [J]. Nature. 2023;624(7992):682–8. 10.1038/s41586-023-06746-6. [DOI] [PMC free article] [PubMed] [Google Scholar]
- 36.Ge Y, Porse BT. The functional consequences of intron retention: alternative splicing coupled to NMD as a regulator of gene expression. BioEssays. 2014;36(3):236–43. 10.1002/bies.201300156. [DOI] [PubMed] [Google Scholar]
- 37.Shaul O. How introns enhance gene expression. Int J Biochem Cell Biol. 2017;91(Pt B):145–55. 10.1016/j.biocel.2017.06.016. [DOI] [PubMed] [Google Scholar]
- 38.Slatkin M. Linkage disequilibrium–understanding the evolutionary past and mapping the medical future. Nat Rev Genet. 2008;9(6):477–85. 10.1038/nrg2361. [DOI] [PMC free article] [PubMed] [Google Scholar]
- 39.Wall JD, Pritchard JK. Haplotype blocks and linkage disequilibrium in the human genome. Nat Rev Genet. 2003;4(8):587–97. 10.1038/nrg1123. [DOI] [PubMed] [Google Scholar]
- 40.Sharan M, Singh MP, Aminataei A. A mathematical model for the computation of the oxygen dissociation curve in human blood. Biosystems. 1989;22(3):249–60. 10.1016/0303-2647(89)90066-x. [DOI] [PubMed] [Google Scholar]
- 41.Murray AJ, Montgomery HE, Feelisch M, et al. Metabolic adjustment to high-altitude hypoxia: from genetic signals to physiological implications. Biochem Soc Trans. 2018;46(3):599–607. 10.1042/BST20170502. [DOI] [PubMed] [Google Scholar]
- 42.Bar-Even A, Flamholz A, Noor E, et al. Rethinking glycolysis: on the biochemical logic of metabolic pathways. Nat Chem Biol. 2012;8(6):509–17. 10.1038/nchembio.971. [DOI] [PubMed] [Google Scholar]
Associated Data
This section collects any data citations, data availability statements, or supplementary materials included in this article.
Data Availability Statement
The datasets during and/or analyzed during the current study available from the corresponding author on reasonable request.