

ABSTRACT
Rotavirus (RV) accounts for 19.11% of global diarrheal deaths. Though GAVI assisted vaccine introduction has curtailed RV induced mortality, factors like RV strain diversity, differential infantile gut microbiome, malnutrition, interference from maternal antibodies and other administered vaccines, etc. often compromise vaccine efficacy. Herein emerges the need of antivirals which can be administered adjunct to vaccination to curb the socio-economic burden stemming from frequent RV infection. Cognisance of pathogen-perturbed host cellular physiology has revolutionized translational research and aided precision-based therapy, particularly for viruses, with no metabolic machinery of their own. To date there has been limited exploration of the host cellular metabolome in context of RV infection. In this study, we explored the endometabolomic landscape of human intestinal epithelial cells (HT-29) on RV-SA11 infection. Significant alteration of host cellular metabolic pathways like the nucleotide biosynthesis pathway, alanine, aspartate and glutamate metabolism pathway, the host citric acid cycle was observed in RV-SA11 infection scenario. Detailed study further revealed that RV replication is exclusively dependent on glutamine metabolism for their propagation in host cells. Glutamine metabolism generates glutamate, aspartate, and asparagine which facilitates virus infection. Abrogation of aspartate biogenesis from glutamine by use of Aminooxyacetic acid (AOAA), significantly curbed RV-SA11 infection in-vitro and in-vivo. Overall, the study improves our understanding of host-rotavirus interactome and recognizes host glutamine metabolism pathway as a suitable target for effective therapeutic intervention against RV infection.
KEYWORDS: Rotavirus, metabolomics, glutamine metabolism, aspartate aminotransferase, antiviral
Introduction
Viruses, the otherwise ‘invalid’ microbes, are largely dependent on hosts for their sustenance and propagation. Being devoid of any metabolic or synthetic machinery, they rely on the magnanimity of their hosts to provide the necessary energy and raw materials (amino acids/nucleotides) required to make their own copies).1 Over the years, viruses have co-evolved with hosts, developing strategies to subvert host cell physiology in favor of virus replication and often sabotaging the host as a consequence of their interference. Rigorous research on host-virus interactome has helped us gain significant insights regarding the utilization of host factors for the infection and multiplication of viruses within hosts. The advent of omics-based technologies has further broadened our understanding of viral pathogenesis and are being increasingly explored to identify host proteins, RNAs, and metabolites in favor of virus infection, besides generating options for fruitful therapeutic interventions2,3
Metabolomics, which facilitates profiling of the small molecule compounds core to various host cellular biochemical pathways, is a comparatively new inductee into the ‘omics’ family.4,5 It is more closely linked to a disease/infection phenotype because of being downstream to the genes and proteins at work. Metabolomics is being increasingly used in host-virus interaction studies to annotate infection biomarkers and predict infection severity and outcome.6,7 Detailed study of cellular metabolome in virus infection started off with Human Cytomegalovirus (HCMV), an enveloped dsDNA virus which was found to modify the host central carbon metabolism pathway (involving glucose and glutamine) to suit its replication in the cellular host.8,9 Studies thereafter on DNA viruses like Herpes Simplex Virus (HSV)10 and Vaccinia virus (VACV)11 have demonstrated differential orchestration of glucose and glutamine metabolism for their multiplication. Biased utilization of glucose for replication of RNA viruses like Influenza A (IAV)12 and Dengue Virus (DENV),13 or, of glutamine for replication of human Rhinovirus (RhV),14 Respiratory Syncytial virus (RSV)15) and Severe Acute Respiratory Syndrome-Coronavirus-2 (SARS-CoV-2)16 have been reported.
Host cell fatty acid synthesis has always been favorably harnessed by multiple DNA and RNA viruses8,17–2223–25 Almost all of the viruses induce upregulation of the fatty acid synthase enzyme, FASN and targeted inhibition of FASN by small molecule inhibitors was found to decrease virus replication26,27 As viral genome replication generates high demand for nucleotides, it is imperative for all viruses to tap into the host cellular purine/pyrimidine pool. HCMV infection was found to increase cellular level of metabolites of the pyrimidine metabolism pathway like carbamoyl aspartate, UTPs and CTPs.8 Besides HCMV, HSV-1,10 Picornaviruses,28 and porcine delta coronaviruses (PCDV)29 alter host pyrimidine or purine metabolism. Human IAV strain, PR8 infection in cells, triggered reduction of purine nucleotide triphosphates (ATP, GTP) with concurrent increase in purine and pyrimidine nucleotide diphosphates and monophosphates (ADP, AMP, GDP, GMP, CDP, CMP).12 A study in 202230 established that SARS-CoV-2 infection in Caco2 cells was accompanied by increase in cellular levels of UTP, UDP and UMP.
Among diarrheagenic viruses, RV, a segmented dsRNA virus of the Sedoreoviridae family secures a spot at the top, owing to its infection-related morbidity, especially among children aged below 5 years. RV accounts for 19.11% of global diarrheal deaths.31 RV primarily infects the cells of the intestinal villi (enterocytes)32 and subverts multiple host responses for its perpetuation. RV multiplication entails alteration of host protein chaperone system and intracellular calcium metabolism,33,34 cell-cycle components,35 ubiquitin-proteasome system,36 endocytosis components,37 host microRNA population38,39 DNA damage response pathway,39 and cellular redox response pathway.40,41 A few studies elucidating virulence mechanism of RV have pointed to the indispensable role of host cellular lipids in RV replication.26,42–44 Drugs, disrupting lipid homeostasis (lipolysis/lipogenesis) in cells, like triascin C (inducing disintegration of lipid droplets) or C75 (FASN inhibitor) decreased RV replication26,43,45 Besides, RV replication was also abrogated on use of compounds like gemcitabine and brequinar, inhibitors of the enzyme dihydro-orotate dehydrogenase, an important enzyme in the pyrimidine biosynthesis pathway.46 But no extensive study regarding remodeling of the human cellular metabolome in RV infection has been conducted to date. Therefore, in order to expand our understanding of virus induced changes in host cell metabolome, we chose to conduct metabolomics analyses of HT-29 cells infected with simian rotavirus strain RV-SA11. From the list of most significantly altered metabolic pathways in RV infection, we chose to elaborately investigate the role of the central carbon metabolism pathway, involving glutamine and its metabolites, in RV infection scenario in this study.
Materials and methods:
Cell culture and rotavirus infection
The in-vitro experiments relating to this study were carried out mostly in HT-29. Additionally, the monkey kidney epithelial cell line, MA104, was also used for a few experiments. HT-29 cells were propagated in high glucose DMEM media with 10% FBS (fetal bovine serum) and 1% antibiotic-antimycotic solution, while MA104 cells were harvested in MEM media with 10% FBS and 1% antibiotic-antimycotic solution. The cells were maintained in a pre-sterilized humified CO2 incubator with temperature set to 37°C and CO2 levels at 5%. Cells were sub-cultured as and when needed. Cell culture adapted strain of rotavirus, RV-SA11 was used for all in-vitro and in-vivo experiments. Prior to infection of HT-29, the virus was activated using 10 μg/μL of acetylated trypsin, incubated at 37°C water-bath for 1 hour and added to pre-washed HT-29 or MA104 cells in normal serum free DMEM media (with 5 mM glucose and 2 mM glutamine) at an M.O.I. (multiplicity of infection) approximating to 3. The time of virus addition to cells was recorded as 0 hour (h) post infection. Drugs and media supplements were added to cells at 1 h post adsorption.
UHPLS based mass spectrometry for metabolomics
Sample preparation for UHPLC
Cellular lysates of HT-29 cells: (a) mock-infected and (b) infected with simian RV strain SA11 at two time-points: 6 h.p.i. and 12 h.p.i. (hours post infection) were subjected to endo-metabolomic analyses in triplicates (n = 3; where n indicates number of replicates). For this, HT-29 cells were grown in 100 mm cell-culture dishes. Cells were counted using a hemocytometer and seeded accordingly, to maintain same density of cells in each dish. At 90% confluency levels, cells were either (a) mock infected or (b) infected with RV-SA11 at an approximate M.O.I. of 3 (Supplementary Figure S1. D) and maintained for 6 h (Set A) and 12 h (Set B) respectively in DMEM containing 5 mM glucose and 2 mM glutamine. At the end of the respective time points, the media was removed from the culture dishes, and the cells were washed with approximately 5 mL warm PBS (3–5 s). The PBS was decanted and 10 mL of liquid nitrogen was added to the cells for rapid quenching to arrest further metabolic changes. When the liquid nitrogen had almost evaporated, 1.5 mL of cold aqueous 80% MeOH, (8:1 methanol:H20) (v/v) was added to the cells, and swirled for 2–3 min. The cells were scraped and aliquoted in 2 mL microcentrifuge tube. The aliquots were freeze-thawed and sonicated for 30 sec in pulse mode. Sonicated samples were stored in −80º (8–12 h) for freezing, followed by centrifugation at 30,000 rpm for 30 min. DNA content of the resultant supernatant was quantified prior to subjecting the samples for UHPLC. The samples in the 2 mL tube were then freeze dried and shipped in dry ice to the DBT-SAHAJ National facility, Rajiv Gandhi Centre for Biotechnology (RGCB), Kerala for mass-spectrometry-based metabolomics.
Metabolomic profiling and analyses
Extracted freeze-dried samples were reconstituted in methanol (volume normalized as per the sample DNA concentrations so that final concentration was 1 ng/μL). The Vanquish UHPLC system coupled with Eclipse Orbitrap Mass Spectrometer, in heated electrospray ionization (H-ESI) mode ((Thermo Fisher Scientific), was used for untargeted metabolomics (LC-MS/MS (Data dependent acquisition)) of the samples. Chromatographic separation of the samples was carried out in Waters RP column, 2.1 × 150 mm, 1.8 um particle size at a flow rate of 0.350 mL/min. The mobile phases were: (i) phase A; 0.1% formic acid in water and (ii) phase B: 0.1% formic acid in methanol. Gradient used for UHPLC over a total run time of 15 mins was/0.5, 5/50, 6/98, 12/98, 13/0.5, 13.1/0.5, 15/Stop (time [min]/% phase B). Column temperature was maintained at 45°C, the autosampler was set to 5°C and sample injection volume was 5 µL. A full scan with a mass resolution setting of 120,000 over a scan range of 100–1000 m/z was set for the Eclipse Orbitrap Mass Spectrometer in dual polarity modes and the analytes were thereby recorded. To obtain MS/MS fragment spectra, data-dependent acquisition was carried out (Supplementary excel file 1). Solvent blanks were used to create exclusions lists, mark background components, and filter the background components from the results table. A pooled quality control (QC) sample prepared by mixing equal aliquots from each processed sample was used for compound identification. Data processing was done using the compound discoverer 3.3 software encompassing mzCloud (ddMS2) and ChemSpider (formula or exact mass). Feature identification was based on accurate mass, isotope pattern, MS/MS fragment scoring and retention time matching to a preexisting workflow library (Untargeted Metabolomics with Statistics Detect Unknowns with ID using Online Databases and mzLogic). Compounds were mapped to biological pathways using Metabolika. The peak areas of the identified compounds were transformed into log 10 area and p-value of per group ratio was calculated by a one-way ANOVA (Analysis of variance) model with Tukey as post-hoc test.
Compounds with p-values less than 0.2 and fold change either greater than or less than zero were considered for further analyses. The Human Metabolome database (HMDB) and the Kyoto Encyclopedia of Genes and Genomes (KEGG) software were used to annotate HMDB47 or KEGG I.D.48 to the filtered compounds. Based on fold changes in peak area intensities of the identified compounds, heatmap was generated for the control and RV SA11-infected group along with principal component analyses (PCA) for the samples using ClustVis.49 The HMDB/KEGG I.D.s for the compounds were fed into the Metaboanalyst 6.0 software50 for pathway enrichment analysis. Bubble plots with bigger bubbles and with more intense red color was indicative of greater importance of the pathway and higher statistical significance respectively. The Venn diagram representing commonly altered metabolites at both 6 and 12 h of RV infection was constructed using DeepVenn.51
Reagents and antibodies
General reagents for cell culture like DMEM media without glucose, glutamine and phenol red, FBS, Trypsin-EDTA (TE) and antibiotic/antimycotic were purchased from Thermo Fisher Scientific, USA (Table 1). Media supplements and small molecule inhibitors of different cellular metabolic enzymes, MTT reagents and protease and phosphatase inhibitor cocktails was obtained from Merck (Sigma-Aldrich) (Table 1). Small molecule inhibitors like L-DON, CB-839 and R-162 were dissolved in DMSO to make stock solutions while AOAA stock solutions were prepared in water as the dissolution agent. The media supplements were dissolved in DMEM media without glucose, glutamine and phenol red containing 0.2 (N) hydrochloric acid. Antibodies relevant to our study were procured from Abcam, Cell Signaling Technology, Abclonal and Santa Cruz Biotechnology (Table 1). The antibody against RV non-structural protein, NSP5 raised in rabbits was gifted by the Department of Virology and Parasitology, Fujita Health University School of Medicine, Aichi, Japan. 5 nmol Flexi-tube siRNA (pre-designed) against ASNS was ordered from Qiagen (FLEXITUBE SIRNA 5 nmol (GG ID: SI02776956).
Table 1.
List of reagents and antibodies used for this study.
| Sl No. | Reagent/Antibody name | Manufacturer | Catalogue No. |
|---|---|---|---|
| 1. | DMEM powder, high glucose,pyruvate | Gibco | 12800017 |
| 2. | MEM powder | Gibco | 61100061 |
| 3. | DMEM without glucose, glutamine, phenol red | Invitrogen | A1443001 |
| 4. | FBS | Invitrogen | 10270106 |
| 5. | Trypsin with 0.05% EDTA | Invitrogen | 25300062 |
| 6. | Antibiotic Antimycotic | Invitrogen | 15240062 |
| 7. | D(+)-Glucose | Sigma | G7021 |
| 8. | L-Glutamine | Sigma | G8540 |
| 9. | Glutamic acid | Sigma | G1251 |
| 10. | Dimethyl 2-oxoglutarate | Sigma | 349631 |
| 11. | L-Aspartic Acid | Sigma | A7219 |
| 12. | L-Asparagine | Sigma | A4159 |
| 13. | Oxaloacetic Acid | Sigma | O7753 |
| 14. | 3-(4,5-dimethylthiazolyl-2)-2,5-diphenyltetrazolium bromide | Sigma | M5655 |
| 15. | L-DON | Sigma | D-2141 |
| 16. | GLS inhibitor III- CB-839 | Sigma | 5.33717 |
| 17. | GDH inhibitor, R162 | Sigma | 5380980001 |
| 18. | O-Carboxymethyl hydroxylamine hemihydrochloride/Aminooxyacetic acid(AOAA) | Sigma | C13408 |
| 19. | Protease inhibitor cocktail | Sigma | P2714 |
| 20. | Phosphatase inhibitor cocktail | Sigma | P5726 |
| 21. | Anti-Glutaminase C antibody [EPR19525] | Abcam | ab202027 |
| 22. | Anti-Phosphoribosyl pyrophosphate amidotransferase antibody | Abcam | ab125864 |
| 23. | Glutamate Dehydrogenase 1/2 (D9F7P) Rabbit mAb | Cell Signaling | 12793 |
| 24. | GOT1 (E4A4O) Rabbit mAb | Cell Signaling | 34423 |
| 26. | Phospho-CAD (Ser1859) Antibody | Cell Signaling | 12662 |
| 27. | ASNS Rabbit mAb | Abclonal | A1030 |
| 28. | SLC25A12 Rabbit mAb | Abclonal | A21129 |
| 29. | Rotavirus capsid antibody (2B4) | Santa Cruz Biotechnology | sc -101,363 |
| 30. | AATM Antibody (E-7) | Santa Cruz Biotechnology | sc -271,702 |
| 31. | beta Actin Antibody (C4) | Santa Cruz Biotechnology | sc -47,778 |
Cell viability assay
Cell viability of HT-29 cells in the presence and absence of different media supplements and drugs was determined through the MTT assay as per manufacturer’s protocol. At around 80% confluency, normal cellular media of HT-29 cells (grown in 24 well plates) was replaced with media containing the desired supplement/s like, DMEM with 25 mM/12.5 mM/5 mM/0 mM glucose and 4 mM/2 mM/0 mM glutamine, individually or using combinations, like, DMEM with 5 mM glucose and 2 mM or 4 mM each of glutamine, glutamic acid, alpha-ketoglutarate, aspartic acid, asparagine and oxaloacetic acid. The cells in such differential media conditions were incubated for a period of 24 h to determine their effect on cell viability. Small molecule inhibitors or siRNAs like CB-839, R-162, AOAA, siNC and siASNS were added to HT-29 cells maintained in 5 mM glucose and 2 mM glutamine containing DMEM media in dose dependent manner over a period of 24 h to determine the 50% cellular cytotoxicity levels. Percentage cell viability was determined based on the optical density (O.D.) using the formula: (O.D.Sample-O.D.Blank) X 100/(O.D.Control-O.D.Blank).40 O.D.Control was HT-29 cells maintained in 5 mM glucose or 2 mM glutamine containing DMEM with 0.2(N) HCl for determination of cell viability in different media supplements or that containing respective drug solvents (DMSO/H20).
Plaque assay
Plaque assay was used to determine the viral titer. For this, 6-well dishes seeded with HT-29 cells at 70–80% confluency were infected with a range of serial dilutions of the RV-SA11 strain (102 to 108-fold) for 60 min. The media was decanted and cells were washed once with PBS. 0.7% agar (in 1 × MEM) having 1 μg of acetylated trypsin/mL was added over the cells. Following this, a second layer of agar constituted of 0.7% agar (in 1 × MEM and 0.1% neutral red) was added at 36–48 h.p.i. The plates were maintained at 37 ◦C till plaques were visible. Viral Plaque Forming Unit (PFU) was calculated thus as PFU/mL (Initial stock) = [(1/dilution factor) × (number of plaques) × {1/(mL of inoculum/plate)}].52 50% inhibitory concentration (IC50) of the different drugs were determined using viral plaque assay and calculated using a non-linear regression model in GraphPad Prism software: Y = Bottom + (Top − Bottom)/(1 + 10(LogIC50 − X) × hill slope).
Biochemical assays
Glutamine uptake rates as well as the intracellular glutamine/glutamate levels of mock-infected and RV-SA11 infected HT-29 cells at 6 and 18 h.p.i., were determined using the Promega Glutamine/Glutamate-Glo™ Assay (J8021) assay kit following manufacturer’s instructions. For quantification of glutamate/glutamine from cells, cells were quenched and deproteinised with Inactivation Solution I and II as per manufacturer’s instructions and intracellular glutamate and glutamine quantified in terms of Relative Luminescence Units (RLU). Intracellular aspartate at 6 and 18 h.p.i. was measured through a colorimetric assay using the Aspartate assay kit from Abcam (ab102512) as per kit protocol. The Aspartate Aminotransferase Activity Assay Kit (ab105135, Abcam) was used to measure the activity of aspartate transaminase/glutamate oxaloacetate transaminase in mock, infected and inhibitor (AOAA) treated uninfected and infected mice intestinal tissue lysates from 3 μg of protein as per manufacturer’s instructions.
Quantitative real-time PCR (qRT-PCR)
Total RNA from RV-SA11 infected and inhibitor/supplement treated HT-29 cells and mice intestinal tissue homogenates was extracted using Trizol reagent (RNAIso Plus, Takara Bio, Cat No. 9109) following protocol supplied by manufacturer. Extracted RNA (1 μg) was used to prepare cDNA following the standard protocol.53 Real-time PCR was performed from 1 μL of the prepared cDNA in at least three replicates using the PowerUp™ SYBR™ Green Master Mix (Applied Biosystems, Cat No. A25742) in ABI 7500 machine. Primers used for real time were specific to RV structural gene, VP6 (FP: 5’-AGGCAAGAGTACGCAATACC-3'; RP: 5'-TCCTCCCTAGACGGTGAATAA-3'); NSP4 (FP: 5'-GAAATGAGACGCCAGCTAGAA-3'; RP: 5'-GTCGTTTGCACCGTCAATTTAT-3'), and the housekeeping gene 18S (FP: 5'-CACGGACAGGATTGACAGATT-3'; RP: 5'-GCCAGAGTCTCGTTCGTTATC-3').
Western Blot
Cell lysates were prepared by washing the HT-29 cells with prechilled PBS following by lysis using the radio-immunoprecipitation assay (RIPA) buffer. Protein concentration in the cell lysates was estimated using the Pierce™ BCA Protein Assay Kit (Thermo Scientific™). Equal concentration of protein extract was mixed with a protein sample buffer and incubated in a heat block set to 95 degrees for 10 min, followed by separation on SDS-PAGE. Protein was transferred on Polyvinylidene Fluoride (PVDF) membrane using the Bio-Rad semi-dry transfer apparatus. Immunoblotting was carried out using specific primary antibodies and their respective HRP-conjugated secondary antibodies (Invitrogen, Thermo Fisher Scientific). The blots were finally developed using chemiluminescent reagent (Millipore), visualized with the help of ChemiDoc Imaging System (Bio-Rad). Quantitative analysis of the blots, i.e. calculation of relative fold changes with respect to the first lane, was done after normalization against the housekeeping protein, β-actin, using the Image Lab 6.0.1 software, Biorad.
Transfection
Transfection of negative control siRNA and siRNA targeting ASNS (Flexitube 5 nmol siASNS, Qiagen; (GG ID: SI02776956)) in HT-29 cells was done using the Lipofectamine™ RNAiMAX reagent (Invitrogen) following the manufacturer’s instructions.
Immunofluorescence microscopy
HT-29 or MA104 cells were seeded on a coverslip placed in a 35 mm cell culture dish. At around 40–50% confluency, the cells were infected with RV-SA11 in DMEM media containing 5 mM glucose and increasing concentrations of glutamine (0,1,2,3,4 mM) and incubated for either 9 or 12 h.p.i. 4% paraformaldehyde (in PBS) followed by 4–5 washes with PBS, and permeabilization using blocking buffer containing 3% BSA in PBS and 0.1% Triton X-100 overnight. At the end of 24 h, the cells were washed once in PBS and incubated overnight at 4°C with specific primary antibody against NSP5. Next day, the coverslips were washed with PBS and stained with Dylight 488-conjugated anti-rabbit secondary antibodies (Jackson Laboratories Inc., West Grove, PA) for 1 h at room temperature. After washing in chilled PBS, mounting of coverslips was done using 4′,6′ -diamidino-2-phenylindole (DAPI) (Vector Laboratories, Burlingame, CA) to stain the nuclear DNA. Imaging was done with the help of the LSM 710 Axioplan microscope (Zeiss) (63×/1.4NA, oil immersion). Analyses of the generated images were done by Zen Blue software. Number of RV infected cells (‘x’) maintained in media with 5 mM of glucose and varying amounts of glutamine was calculated as the mean of ‘x’ from three different fields of cells maintained in respective media conditions. ‘x’ for each field was counted as (Number of cells with punctate viroplasms/Total number of DAPI positive cells) X100.
Rotavirus infection and treatment in-vivo in BALB/C suckling mice
In-vivo experiments with regard to RV-SA11 infection were carried out following the already established method54,55 For each experimental group, a total of 5 mice (n = 5) were taken. BALB/c suckling mice aged around 4 days were inoculated with either the vehicle (suspension medium for the drug, AOAA) or with simian rotavirus strain RV-SA11 using an oral gavage. 12 h after the inoculation, the pups were administered with the 1st dose of the drug AOAA at 5 or 10 or 20 mg/kg/day as required. Treatment was continued for 3 consecutive days at an interval of 24 h. At 48 h, that is, after the 2nd dose of drug, one set of control (vehicle or drug treated) and infected (RV-SA11 inoculated and AOAA treated) were sacrificed and dissected to obtain the small intestinal tissue. Small intestinal tissue homogenate was prepared for measuring the GOT/AAT enzyme activity in the mock, infected and treated group of mice. For the rest, treatment was continued till the 3rd day. After 3 days (72 h) after the administration of the 1st virus inoculum, stool samples were collected from infected and drug treated mice pups, and the number of RV particles were quantified using Premier®Rotaclone® (Meridian Bioscience, Inc.) following manufacturer’s instructions. Thereafter, the mice were sacrificed, small intestine was collected and intestinal homogenates prepared using Dounce homogenizer to check viral RNA transcripts (VP6, NSP4) and viral protein expression (for VP6) in the infected and drug-treated mice. The dissected small intestine at the end of 72 h was preserved in 4% formalin for the purpose of HE staining. All the in-vivo experiments were carried out adhering to the national animal-handling norms and with approval of institutional animal ethics committee.
H& E staining of mice tissue
Histopathological changes were assessed in the liver, kidney, and small intestine from control and AOAA treated mice. Formalin fixed tissues were dehydrated following the order: ethyl alcohol [50, 70, and 90% (v/v)], xylene/ethyl alcohol solution [50 and 90% (v/v)], and then twice in xylene. The transparent tissue section was then embedded in paraffin and subjected to microtome sectioning of 4-μm thickness. The sectioned tissue was then de-paraffinated in the reverse order used for dehydration followed by staining with hematoxylin-eosin (HE) for approximately 8 min. Post staining, the sections were analyzed at 10X and 40X magnification using the Nikon NIS BR Microscope.
Statistical analysis
The p-value in experiments such as cell viability assay, virus yield assay, viral transcript quantification and biochemical assays was determined using the one-way ANOVA statistical test in the Graphpad Prism software (version 5). The Mean ± standard deviation (SD) of at least three independent experiments (n ≥ 3) was considered for analyses.
Results
Endo-metabolomic analyses of RV-SA11 infected HT-29 cells reveal differential regulation of host metabolites and metabolic pathways in favor of virus replication
To identify differentially regulated metabolites/metabolic pathways in RV infection scenario, endo-metabolomic analyses of mock and RV-SA11 infected HT-29 cells were performed in triplicates (n = 3). HT-29 cells, mock or infected with RV-SA11 (M.O.I. 3), were maintained till 6 and 12 h.p.i., lysed, extracted, and finally subjected to UHPLC-MS in dual polarity mode. Differentially regulated metabolites, statistically significant (p ≤ 0.05) or of suggestive significance (0.05 < p < 0.2) (https://doi.org/10.6084/m9.figshare.26394838.v1.), were considered further for PCA plot generation, heatmap generation and pathway analysis (Figure 1).
Figure 1.
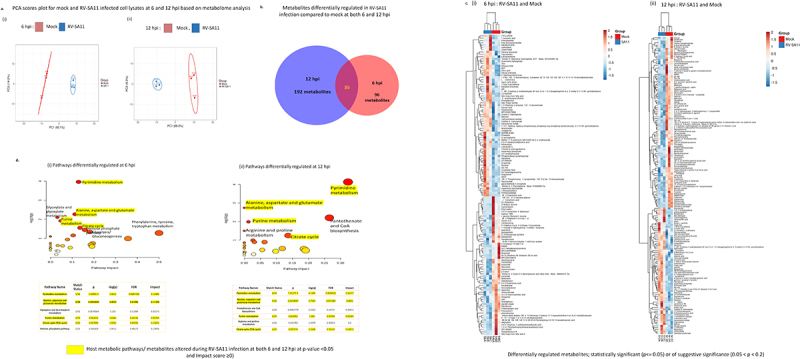
Profiling of host cellular metabolome during RV infection in HT-29 cells. Metabolomic analyses was performed in n = 3 samples each of mock and RV-SA11 infected HT-29 cells. (a) PCA (Principal component analysis) of mock (red) and RV-SA11 (M.O.I. = 3) infected HT-29 cells (blue) at (i) 6 h (ii) 12 h post RV-SA11 infection revealed differential clustering of mock and infected cells based on altered regulation of metabolites. (b) Intersecting venn diagram depicting 131 and 227 altered metabolites at 6 (red) and 12 h.pi. (blue) respectively in RV-SA11 infected cellular lysates compared to mock, with 35 common metabolites (p < 0.2) differentially altered at both 6 h.p.i. and 12 h.p.i. (c) Heatmap analyses of mock and RV infected HT-29 cells at (i) 6 h.p.i. And (ii) 12 h.p.i. depicted differentially regulated metabolites at p < 0.2. Blue indicates downregulation and red indicates upregulation. (d) Bubble plots representing the most significantly altered cellular metabolic pathways during RV infection. Pathway analysis was done by mapping the differentially regulated metabolites (p < 0.2) to host cellular biochemical pathways using their HMDB/KEGG I.D.s and screening the hits against the KEGG pathway database in the Metaboanalyst software. The top 5 pathways with impact score ≥ 0 and false discovery rate (FDR) <0.7 at (i) 6 h.p.i. and (ii) 12 h.p.i. are represented in adjoining table. Circle size is indicative of pathway impact (bigger circle; greater impact), while, color/gradient of the circle (from red to yellow) indicates the level of statistical significance. (deeper red indicates higher-log10(p) value and increased significance).
PCA score plots generated from the obtained metabolites (p < 0.2) revealed segregated clustering of the control and RV-SA11 infected group at both the time-points hinting at altered intra-cellular –metabolic profile in case of RV-SA11 infection compared to uninfected controls (Figure 1a). Among the total metabolites identified through LC-MS, around 131 and 227 metabolites were found to be altered (p < 0.2) in RV-SA11 infected HT-29 cells at 6 and 12 h.p.i., respectively (Figure 1c; Supplementary pdf 2; Supplementary pdf 5). At 6 h.p.i., 71 metabolites out of total 131 (p < 0.2) were found to be upregulated (log2 FC > 0) (Supplementary pdf 3) while rest 60 metabolites were downregulated (log2 FC < 0) (Supplementary pdf 4). At 12 hpi, 87 and 140 metabolites out of the total 227 metabolites were found upregulated and downregulated respectively (Supplementary excel file 6; Supplementary excel file 7). Around 35 altered metabolites were common in both 6 and 12 h.p.i. group (Figure 1b). Metabolites of the nucleotide metabolism pathway like epiguanine (7 -methylguanine), N, N-Dimethylguanosine, Cytidine triphosphate (CTP), cyclic Thymine Monophosphate (cyclic TMP) were found to be upregulated at both 6 and 12 h.p.i. Differential regulation of other metabolites involved in polyamines and peptide biosynthesis (like spermine, ala-met) and the glucose, glutamate and aspartate metabolism pathway (such as citric acid, pyruvic acid, L-glutamine, L-asparagine, ureidosuccinic acid (N-carbamoyl aspartate)) were also observed in RV-SA11 infected cells with respect to mock-infected cells (Figure 1c; Supplementary Figure S1. C).
HMDB ID of the differentially regulated metabolites/compounds with p-values <0.2 from both time-points (6 and 12 h.p.i.) were obtained and fed to the MetaboAnalyst software to identify pathways and signaling networks modified in context of RV Infection. Pathway analysis at 6 h.p.i. identified altered metabolites belonging predominantly to 5 pathways, namely the purine and pyrimidine metabolism pathway; the alanine, aspartate and glutamate pathway, the citric acid cycle pathway and the pentose phosphate pathway (at p ≤ 0.05 and FDR < 1) (Figure 1d). Bubble plots at 12 h.p.i. also revealed majority of the altered metabolites as intermediates of the pyrimidine metabolism and the alanine aspartate and glutamate metabolism pathway (p ≤ 0.05 and FDR < 0.2) (Figure 1d). Besides these, at 12 h.p.i., the other pathways with considerable impact were the purine metabolism pathway, the citric acid cycle and the pantothenate and CoA biosynthesis pathway (p ≤ 0.05 and FDR < 1) (Figure 1d). Simultaneous enrichment analysis of the differential metabolites based on the KEGG database (overview of top 25 enriched metabolite sets) revealed high enrichment ratios for the pyrimidine metabolism and the alanine aspartate glutamate metabolism pathway at statistically significant levels (p < 0.05) at both the timepoints (Supplementary Figure S1. A (i-iii), Supplementary Figure S1. B (i-iii)).
Glutamine, the principal metabolite governing host cellular alanine, aspartate, glutamate (AAG) pathway, plays a pro-viral role in RV-SA11 infection
The alanine aspartate glutamate metabolism pathway is potentially impacted by RV infection, predominantly at 6 h.p.i., i.e. the early infection stage (Figure 1d). This is highly likely, owing to increased demand of metabolites and amino acids for viral nucleotide and protein synthesis. Glutamine, an important precursor of both the metabolites, glutamate and aspartate, is crucial to the AAG metabolism pathway. Interestingly, heatmap analysis at 6 h.p.i. in mock vs. RV infected HT-29 cells, revealed decreased levels of glutamine (Figure 1c (i); Supplementary excel file 4) suggesting role of glutamine in RV infection. Therefore, we wanted to further investigate whether the depletion of glutamine has any effect on RV replication.
To assess the functional significance of glutamine depletion, the glutamine consumption rates (in terms of Relative Luminescence Units (RLU)) in extracellular media of mock and RV-SA11 infected HT-29 cells at increasing timepoints (0 h.p.i., 6 h.p.i.,12 h.p.i. and 18 h.p.i.) were determined. The total glutamine and glutamate as well as only glutamate present in the cellular media at any timepoint were determined in RLU and the sole glutamate concentration was deducted from the aforementioned value to get the RLU of glutamine. Lower RLU value of glutamine in cellular media indicated greater uptake of glutamine by cells. Consumption of glutamine from cellular media in the mock HT-29 cells increased with time, with the major consumption rates observed between 6 and 12 h.p.i. whereas for RV-SA11 infected HT-29 cells, glutamine consumption rates more prominently increased at the earlier time point, i.e., 6 h.p.i. (compared to mock-infected control) suggesting increased requirement of glutamine by RV-SA11 infected HT-29 cells early during infection (Figure 2a). In addition to this, intracellular glutamine levels were also measured at an early (6 h.p.i.) and late time-point (18 h.p.i.) in deproteinized cellular extracts of HT-29 cells (Supplementary Figure S2. A (i-iii)). With respect to un-infected controls, the glutamine levels were lower (Supplementary Figure S2. A (iii)) while the glutamate levels were higher in the RV-SA11 infected cellular extracts at 6 h.p.i. (Supplementary Figure S2. A (ii)). Glutamine and glutamate levels dropped in both control and infected cellular extracts at later time-points (18 h.p.i.) though the reduction was greater for RV-SA11 infected cells compared to the control cells (Supplementary Figure S2. A (ii, iii)).
Figure 2.
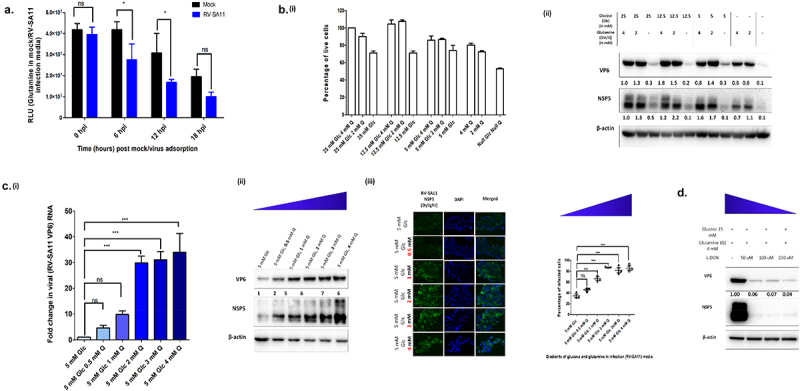
Rotavirus replication in human intestinal epithelial cells is dependent on host cellular glutamine. (a) Rates of consumption of glutamine from cellular media of mock and RV-SA11 infected HT-29 cells were determined in Relative Luminescence Units (RLU) using the Promega Glutamine/Glutamate Glo assay kit at increasing timepoints. Increased uptake of glutamine was evident in RV-SA11 infected cells at 6 and 12 h.p.i. compared to the mock HT-29 cells (p ≤ 0.05; F = 16.82, df = 1) (b) (i) HT-29 cell survivality was measured through MTT assay after incubating cells for 24 h in varied concentrations of glucose and glutamine. (ii) Expression of RV-VP6 and RV-NSP5 was determined through immunoblotting using specific antibodies, in cellular lysates of RV-SA11 infected HT-29 cells (12 h.p.i), in DMEM media with varied concentrations of glucose and glutamine. The blots were normalized against the internal loading control, β-actin. Absence of glutamine from media during RV-SA11 infection substantially decreased VP6 and NSP5 protein synthesis. (c) (i) Relative fold changes in transcript levels of RV-VP6 was quantified using SYBR-Green based qRT-PCR assay after normalization with 18S internal control. Significant increase in VP6 transcript levels was observed on increasing glutamine concentration in infection media above 1 mM (p ≤ 0.05, F = 53.27, df = 5). Each bar in the bar graph is a representation of the mean ± SD of a minimum of three replicates. (ii) RV-VP6 and RV-NSP5 protein levels were analyzed by western blot analysis. Immunoblotting results demonstrated similar trend of increase in RV-SA11 VP6 and NSP5 with increasing gradients of glutamine in infection media. (iii) Total number of viroplasm positive cells (HT-29) in increasing concentrations of glutamine (0, 0.25, 1, 2, 3 and 4 mM) in special DMEM media containing 5 mM glucose was also determined through confocal microscopy. Total number of viroplasm positive cells increased when glutamine concentration in infection media was 1 mM or more (p ≤ 0.05, F = 45.32, df = 5). (d) Disrupting glutamine utilisation by treating RV -infected HT-29 cells with the glutamase inhibitor, L-DON, in a dose dependent manner, was found to drastically reduce RV-VP6 protein levels. Test of significance used was two-way ANOVA for glutamine uptake assay and one-way ANOVA for the rest followed by post-hoc Tukey test comparing all pairs of columns (ns denotes p value not significant, *p ≤ 0.05, **p ≤ 0.01, ***p ≤ 0.001).
The indispensability of glutamine for RV-SA11 infection in host cells was thereafter tested by varying the concentrations of glucose and glutamine in infection media (Figure 2b). Initially, the limiting concentration of glucose and glutamine required for HT-29 cell survivality was determined through MTT cytotoxicity assay. For comparison of RV-SA11 infectivity with respect to cell survivality, 3 sets of media having glucose concentration 25 mM, 12.5 mM and 5 mM with gradually decreasing glutamine concentration (i.e. 4 mM, 2 mM and 0 mM) for each were prepared. Media with only 4 mM or 2 mM of glutamine, or no glucose and glutamine, was also taken. Cell (HT-29) viability was first measured by incubating the cells in different media conditions over a period of 24 h. For media containing 25 mM, 12.5 mM and 5 mM glucose with either 4 mM or 2 mM of glutamine, cell viability remained greater than 85%. Eliminating glutamine from the media in presence of 25 mM, 12.5 mM or 5 mM glucose resulted in ~ 25% cell death. When cells were maintained in either 4 mM or 2 mM of glutamine with no glucose, cell death rates were ~ 19% and ~ 27% respectively. Only 50% cells survived in absence of both glucose and glutamine from the media (Figure 2b (i)).
In parallel, HT-29 cells were infected with RV-SA11 and after 12 h.p.i., VP6 and NSP5 expression was assessed by immunoblotting to determine any changes in viral infectivity (Figure 2b(ii)). It was noted that the absence of glutamine from infection media significantly decreased virus infection irrespective of glucose concentration. Compared to rotaviral protein levels in media containing 25 mM glucose with 4 mM glutamine, ≥70% decrease in viral protein levels was observed when glutamine was absent from glucose containing media. Rather, it was interesting to note that no significant change in expression of VP6/NSP5 occured in the presence of 2/4 mM glutamine in infection media with varying concentrations of glucose. Stripping infection media of both glucose and glutamine severely affected viral protein synthesis with levels nearing zero. Comparing viral infectivity and cell survivality in glucose/glutamine deficient media, glutamine deficiency resulted in ~ 70-80% decrease in viral protein synthesis against 28% reduction in cell viability while absence of glucose resulted in only ~ 20% decrease in viral protein synthesis against 20% reduction in cell viability. Also, to remove any bias in cell line dependent variation in viral protein synthesis in response to specific nutrient (glucose/gradient) availability, similar experiment was carried out in MA104 cells with concurrent observations (Supplementary Figure S2. D (i-ii), Supplementary Figure S2. E; Supplementary Figure S2. F). Overall the results suggested preference of glutamine over glucose by RV during infection.
Since RV-SA11 replication was impaired in absence of glutamine which could not be rescued by glucose, the expression of viral RNA and protein was further confirmed in presence of increasing gradients of glutamine (0, 0.5, 1, 2, 3, 4 mM) in DMEM containing 5 mM glucose (Figure 2c). On increasing the concentration of glutamine in infection media, we observed dose-dependent increase in VP6 transcripts, and VP6 and NSP5 protein levels (specially upto 2 mM glutamine) (Figure 2c). Increased percentage of cells infected by RV-SA11 was also observed by immunofluorescence staining of viroplasms (Figure 2c).
To establish the pro-viral role of glutamine, RV-SA11 infected HT-29 cells were treated with the known glutamine antagonist, L-DON (Figure 2d). L-DON, a structural analogue of glutamine, antagonizes the action of different glutamine utilizing enzymes by covalently binding to their catalytic sites and inhibiting their action. Based on previous reports of low cell cytotoxicity of L-DON (R.L,56 HT-29 cells were treated with increasing concentrations of L-DON (50, 100, 250, 500 and 1000 μM) to assess cytotoxicity. No significant change in cell survivality was noted in presence of L-DON (Supplementary Figure S2. C). RV-SA11 infected cell extracts of HT-29 cells, treated with L-DON (50–250 μM), were immunoblotted for assessing impact on RV infection in DMEM with high glucose (25 mM) and glutamine (4 mM) concentration. >90% decrease in viral protein levels was observed in cells tested with L-DON, confirming the importance of glutamine utilization during RV replication (Figure 2d).
RV-SA11 infection triggers differential regulation of enzymes involved in glutamine metabolism pathway
Metabolomic analyses of RV-SA11 infected HT-29 cells had revealed that the glutamate-aspartate metabolic pathway is differentially regulated in host cells at the time of infection (Figure 1). Glutamine lies at the nexus controlling the production of amino acids like glutamate, aspartate and asparagine (Figure 3a). Thus, we wanted to look elaborately into the glutamine catabolism pathway leading to the generation of glutamate and aspartate and understand its significance in context of RV infection. For this, we checked the time dependent expression of glutamine/glutamate catabolizing enzymes like glutaminase (GLS), glutamate dehydrogenase (GLUD1/2) and glutamate oxaloacetate transaminase (GOT1/2) in RV-infected HT-29 by immunoblotting (Figure 3b). GLS was found to be elevated in RV-SA11 infected HT-29 cells compared to the mock-infected controls, thereby hinting at increased glutamate production from glutamine. For the enzymes catalyzing breakdown of glutamate, we observed slightly diminished expression of GLUD, during early time point of infection (6 h.p.i.) followed by restoration later during infection (12–24 h.p.i.). On the contrary, expression of the mitochondrial isoform of the glutamate-oxaloacetate transaminase enzyme, GOT2 (also known as aspartate aminotransferase or AAT), catalyzing the simultaneous conversion of glutamate and oxaloacetate to alpha ketoglutarate and aspartate, respectively, was found to be upregulated at early time points of infection. At the later stages, GOT2 levels were similar as mock infected controls. Furthermore, the levels of aspartate catabolizing enzymes, like cytosolic glutamate oxaloacetate transaminase (GOT1) and asparagine synthetase (ASNS) were also checked. GOT1 expression was lower than that in mock-infected cells at all timepoints. Interestingly, ASNS protein expression was significantly upregulated at initial time-points of infection followed by decline during later timepoints (18 and 24 h.p.i.) of infection.
Figure 3.
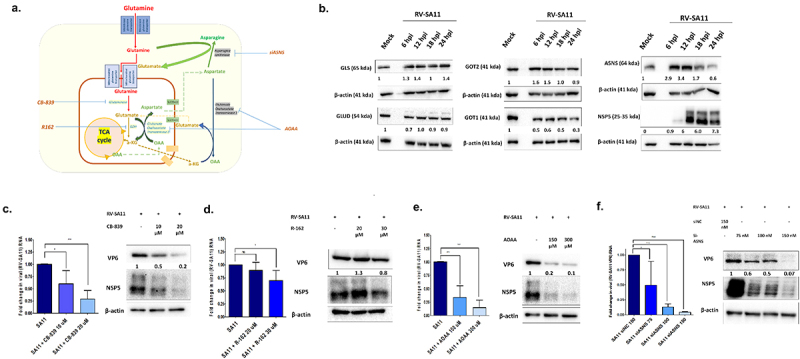
RV infection in HT-29 cells is associated with altered regulation of different enzymes of glutamine metabolism pathway; functional inhibition of which decreases rotavirus replication. (a) Schematic diagram of the glutamine metabolism pathway in host cells. (b) Protein level expression of enzymes involved in glutamine metabolism: glutaminase (GLS: 65 kda), glutamate dehydrogenase (GLUD: 54 kda)), glutamate oxaloacetate transaminase 1 & 2 (GOT1 and GOT2: 41 kda) and asparagine synthetase (ASNS: 64 kda) was quantified in whole cell lysates of HT-29 cells at 6, 12, 18 and 24 h.p.i. and compared to the un-infected controls. The protein expression levels were normalized with respect to the internal loading control, β-actin. RV-NSP5 expression was also assessed as a marker of virus infection. Compared to the mock-infected HT-29 cells, increased protein expression was observed for GLS, GOT2 and ASNS, at early time-points. (C-E) RV- SA11 infected cells were treated with the increasing concentrations of functional inhibitors of (c) GLS (CB-839 (10 - 20 μM) (D) GLUD (R-162 (20,30 μM) and (E) AOAA (0,150 and 300 μM) 1 h post infection and maintained for 12 h in DMEM containing 5 mM glucose and 2 mM glutamine. Viral RNA transcripts (VP6) were quantified in infected and drug-treated cells after normalization with housekeeping gene, 18S. Each bar in the bar graph represents mean ± SD of a minimum of three replicates. Significant decrease in viral RNA was evident on treatment with inhibitors CB-839 (p ≤ 0.05, F = 18.82, df = 2) and AOAA (p ≤ 0.05, F = 45.16, df = 2). Whole cell lysates were also used for Western blotting to determine changes in viral proteins, VP6 and NSP5 normalized against loading control, β-actin. Reduced levels of RV-VP6 and NSP5 proteins were evident in cells treated with CB-839 and AOAA. For R162 treatment, the decline in RV-SA11 protein or transcripts were not as significant as observed on treatment with CB-839 or AOAA. (f) HT-29 cells were transfected with negative control siRNA (150 nM) or siASNS (75, 100 and 150 nM) and subsequently infected with RV-SA11 followed by incubation till 12 h.p.i. The relative transcript expression level of VP6 RNA was quantified after total cellular RNA isolation and qRT-PCR. Western blotting was used to visualize RV-SA11 VP6 and NSP5 proteins. siASNS transfection at 100 and 150 nM concentration significantly reduced RV-SA11 RNA (p < 0.05, F = 18.78, df = 3) and protein synthesis. One way ANOVA followed by post-hoc Tukey’s test comparing all pair of columns was used to determine level of significance (*p ≤ 0.05, **p ≤ 0.01, ***p ≤ 0.001).
To validate functional significance of these enzymes, RV-SA11 infected HT-29 cells were treated with functional inhibitors/siRNAs of these enzymes. CC50 and IC50 levels of the small molecule inhibitors or siRNAs, namely CB-839 against GLS, R-162 against GLUD, AOAA against GOT2/1 and siASNS against ASNS, was determined initially (Supplementary Figure S3. A (i-iv)). Gradual decline at both RV-SA11 VP6 transcript and RV-SA11 VP6 and NSP5 protein was observed on treatment with increasing doses of CB839 (GLS inhibitor) (Figure 3c), AOAA (GOT2/1 inhibitor) (Figure 3e) and siASNS (Figure 3f). No significant decline in viral transcript or protein was observed on treatment with the GLUD inhibitor, R162 (Figure 3d). This result corroborated with the observation that GLUD level was slightly downregulated early during RV infection (Figure 3b). Therefore, GLUD might not play any significant role in favoring virus replication. The meager reduction observed in viral transcript/protein on treatment with 30 μM of R162 could be a result of induced cytotoxicity due to treatment dose of R162 near to the CC50 levels (Supplementary Figure S3. A (ii)).
Addition of endo-metabolites like aspartate or asparagine to glutamine-depleted or glutamine metabolism-abrogated cells rescue RV infection
Once the pro-viral role of glutamine in RV replication was established, next we checked whether different intermediates of the glutamine metabolism pathway could complement the absence/abrogation of glutamine in media during RV infection. Changes in RV SA11 protein levels in media containing 2 mM and 4 mM of different supplements were assessed and compared to 5 mM glucose (treated as the negative control), and, 5 mM glucose with 2 mM of glutamine (treated as the positive control) (Figure 4a–e). Besides adding supplements at equimolar amounts as glutamine (that is, 2 mM), a higher dose of 4 mM was also taken, to compensate for the differential absorption and turnover rates of the supplements57–59 Replenishing glutamine depleted media with 2 or 4 mM of glutamate (E), alpha-ketoglutarate (aKG) or oxaloacetate (OAA) that directly feed into the TCA cycle, caused minimal rescue (<50%) in RV-SA11 replication as measured by expression of RV proteins (Figure 4a–e). Addition of 4 mM of aspartate (D) caused around 50% increase in RV-SA11 expression (Figure 4c). Significant rescue of RV-SA11 VP6 and NSP5 expression was observed when 2 mM (>40%) or 4 mM of asparagine (>80%) was added (Figure 4d). As 4 mM concentration of various intermediates was more effective, rescue experiments using combinations of metabolites resulting from different enzymatic reactions core to glutamine metabolism pathway were also performed (Figure 4f). Substantial rescue near to or exceeding the expression levels of RV in 5 mM glucose − 2 mM glutamine containing infection media, was observed in presence of 4 mM of asparagine along with 4 mM glutamate/4 mM alpha-ketoglutarate/4 mM oxaloacetate, the effect being most pronounced in cells treated with 4 mM asparagine and 4 mM alpha-ketoglutarate. Increase in RV proteins was also noteworthy when 4 mM aspartate was used along with 4 mM alpha-ketoglutarate, which are the end products of reaction catalyzed by the enzyme GOT2. Quantification of RV-SA11 VP6 transcripts in infected HT-29 cells subjected to similar experimental conditions (Supplementary Figure S4. A-F), further established that the effect of metabolite depletion/repletion had an overall impact on viral replication and was not restricted solely to viral protein synthesis. These observations testify to the fact that glutamine and its catabolism generating intermediates like glutamate, alpha-ketoglutarate, aspartate and specially asparagine are important for effective RV replication and propagation in host cells.
Figure 4.
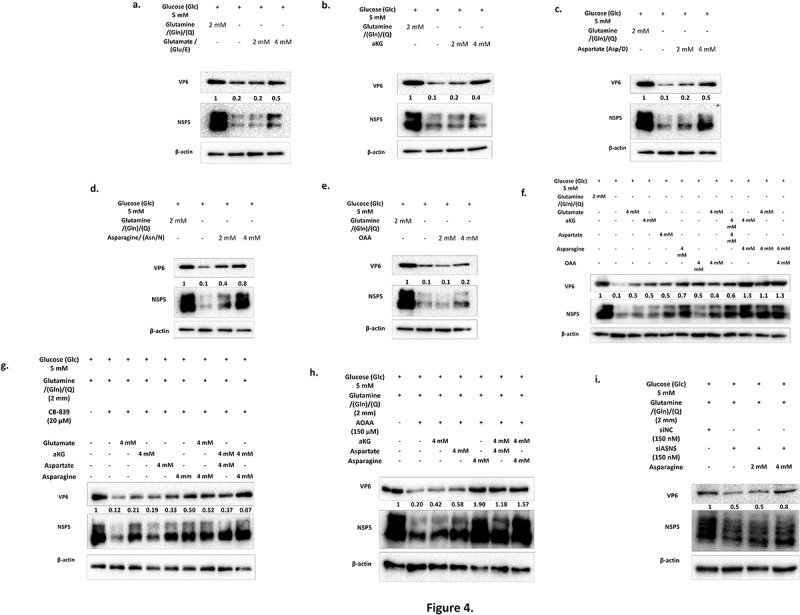
Aspartate and asparagine supplementation to glutamine depleted/inhibitor treated HT-29 cells with RV-SA11 infection substantially rescues virus replication. (a-e) HT-29 cells were infected with RV-SA11 (M.O.I. 3) and incubated for 12 h in media containing 5 mM glucose and 2 mM glutamine; 5 mM glucose with no glutamine and 5 mM glucose with 2 and 4 mM each of glutamate, alpha-ketoglutarate, aspartate, asparagine and oxaloacetate. Expression levels of RV-VP6 and NSP5 proteins were determined by immunoblotting with specific antibodies and the quantified relative fold change (with respect to the first lane) was calculated after normalization against the housekeeping protein, β-actin. The low level of RV proteins in glutamine depleted media was mostly restored on addition of 2 mM and 4 mM of aspartate or asparagine to the media (DMEM with 5 mM glucose). (f) Intermediates of the glutaminolysis pathway (4 mM) were added individually or in combination in RV infected cells maintained in glutamine depleted media and changes in expression of RV proteins was assessed by immunoblotting. Asparagine either solely or in combination with other intermediates like alpha-ketoglutarate, glutamate or oxaloacetate was able to maximally restore RV infection in glutamine depleted media. (G-I) HT-29 cells infected with RV-SA11 were treated with inhibitors/siRNA targeting GLS, GOT1/2 and ASNS. Rescue experiments were performed by addition of intermediates downstream to the step catalyzed by the enzymes targeted with their functional inhibitors and viral protein levels checked through immunoblotting RV-VP6 and NSP5 protein levels were found mostly restored on addition of aspartate or asparagine, either singly or in combination with other supplements.
To further confirm our results, rescue experiments with the metabolites were performed in RV-SA11 infected HT-29 cells treated with siRNAs/inhibitors (Figure 4g–i). 20 μM CB-839 caused notable decline in RV transcript/protein synthesis which was rescued minimally by use of its immediate product glutamate but significantly in 4 mM aspartate, 4 mM asparagine or a combination of 4 mM each of alpha-ketoglutarate and aspartate or 4 mM each of alpha-ketoglutarate and asparagine (Figure 4g; Supplementary Figure S4. G). Similar results were obtained on supplementing AOAA treated RV-infected HT-29 cells with aspartate and asparagine singly or in combination (Figure 4h; Supplementary Figure S4. H). Furthermore, 4 mM asparagine supplementation in siASNS transfected HT-29 cells with RV-SA11 infection also resulted in increased RV transcripts or proteins (Figure 4i; Supplementary Figure S4. I), thereby underscoring the importance of both of the gamma-nitrogen containing amino acids, i.e. glutamine and asparagine in RV replication.
Aminooxyacetic acid (AOAA), the functional inhibitor of the glutamate oxaloacetate transaminase enzyme, attenuates RV-SA11 infection in suckling BALB/C mice
Based on in-vitro cellular cytotoxicity data and inhibitory effect on RV-SA11, AOAA was chosen for in-vivo administration and determination of anti-RV potency. Initially, the cytotoxicity of AOAA was assessed in suckling mice model. For this, 4-day old suckling mice were administered with vehicle (H2O) or increasing doses of AOAA (5 mg/kg/day, 10 mg/kg/day or 20 mg/kg/day) for three consecutive days and their body weights were recorded. No significant difference in body weight was observed between untreated and treated mice (Supplementary Figure S5. A). HE staining of tissue sections obtained from organs like liver and kidney revealed no notable differences in tissue morphology between untreated mice or mice treated with up to 20 mg/kg/day of AOAA (Supplementary Figure S5. C). To assess the anti-RV activity of AOAA, 4-day old suckling mice were inoculated with rotavirus strain, RV-SA11. At 12 h post infection with RV-SA11, the mice were administered with two doses of AOAA (5 mg/kg/day and 10 mg/kg/day) for three consecutive days (Figure 5a). At the end of third day, the mice were sacrificed and RV-VP6 protein expression was assessed in small intestinal homogenates of sacrificed mice (Figure 5b). Furthermore, reduced levels of RV-NSP4 and VP6 transcripts were also noted in AOAA treated (10 mg/kg/day) mice compared to untreated RV-SA11 infected mice (Figure 5c). Quantification of viral particles in fecal samples of RV-SA11 infected and AOAA treated (at 10 mg/kg/day dosage) mice displayed significant reduction in viral particle shedding on treatment (Figure 5d). To find out whether the antiviral activity of AOAA was indeed mediated through decrease in AAT activity, AAT enzyme activity was assessed in intestinal homogenates of vehicle-treated (nuclease-free water) mock, RV infected and AOAA treated suckling mice (Figure 5e). GOT/AAT activity was found to be low in vehicle treated mice which was reduced on AOAA treatment. On the contrary, GOT/AAT activity was highly elevated in intestinal lysates of RV-SA11 infected mice which was reduced in AOAA treated virus infected mice. HE stained histological tissue sections of small intestine of mock, RV-SA11 infected and RV-SA11 infected AOAA (10 mg/kg/day) treated mice revealed gradual restoration of normal villi morphology post treatment, compared to the severely damaged villi morphology in RV-SA11 infected mice (Figure 5f).
Figure 5.
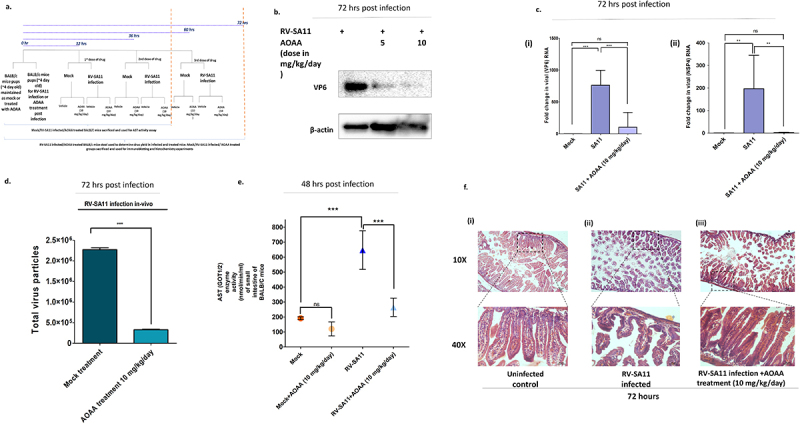
Aminooxyacetic acid, a known inhibitor of aspartate transaminases, displays potent anti-rotaviral efficacy in-vivo in BALB/C suckling mice. (a) workflow of RV-SA11 infection and treatment in BALB/C mice. (a) Four-day old suckling BALB/C mice pups were chosen for the experiment. For each experimental setup, n = 5 mice pups were taken. Mice were infected with RV-SA11 and AOAA was administered after 12 h of virus inoculation as described in methods. Expression of RV-VP6 was determined in intestinal tissue homogenates of RV-SA11 infected and drug treated (AOAA at 5 mg/kg and 10 mg/kg) mice by Western blotting using antibody specific to VP6. Expression of VP6 protein was normalized to the housekeeping gene, β-actin. (b) Total RNA was extracted from intestinal tissue homogenates of infected and treated mice and the levels of viral RNA, VP6 and NSP4 were quantified with respect to housekeeping gene, 18S. Each bar in the plotted graph is a representation of mean ± SD fold change of at least three replicates. Significant decline in VP6 (p ≤ 0.05, F = 28.41, df = 2) and NSP4 transcripts (p ≤ 0.05, F = 10.39, df = 3) in mice intestinal homogenates was observed on treatment with AOAA. (C) Stool samples were collected from RV-SA11 infected and AOAA (10 mg/kg/day) treated suckling mice and total virus particles were quantified in the stool samples at 72 h.p.i. Total virus particles in stool of AOAA treated RV infected suckling pups at the end of 72 h was significantly less than those with RV-SA11 infection (p ≤ 0.05, t = 72.35, df = 4). (d) Intestinal tissue homogenates were prepared from untreated and AOAA treated mice pups with and without RV-SA11 infection and aspartate aminotransferase activity was measured from the homogenates using the colorimetric aspartate aminotransferase assay kit from Abcam. AOAA treatment significantly reduced the intestinal aspartate aminotransferase enzyme activity in the mice pups, which was otherwise highly elevated in virus infection (p ≤ 0.05, F = 38.71, df = 3) (e) HE staining of small intestinal tissue section of 4-day-old mice uninfected, infected with RV-SA11, infected and treated with AOAA (10 mg/kg/day) were done to identify changes in tissue morphology. Restoration of damaged intestinal villi morphology was observed in AOAA (10 mg/kg/day) treated RV infected mice. Scale bars taken were 30 µm. Unpaired t-test (for comparing the results of viral titre determination in mice stool samples) or the one-way ANOVA followed by post-hoc Tukey’s test comparing all pair of columns, was used to determine level of significance (*p ≤ 0.05, **p ≤ 0.01, ***p ≤ 0.001).
Discussion:
In the present study, cellular metabolomics of RV infected HT-29 cells revealed modulations of host cell metabolic pathways, especially the nucleotide metabolism pathway (pyrimidine and purine), the alanine aspartate glutamate pathway and citric acid cycle during virus infection. Interestingly, it was found that RV, like VACV, show skewed reliance on glutamine compared to glucose for effective replication. The presence of glucose in infection media along with glutamine supported RV-SA11 RNA and protein synthesis, thus, glucose’s role in RV replication cannot be completely eschewed. Rather it can be hypothesized that in the presence of glutamine, glucose might additionally support RV replication in cells, by adding to the pool of ribose phosphates (for nucleotide biosynthesis), ATP or TCA cycle intermediates, in face of greater demand of these metabolites in virus infection scenario. Increased levels of phosphoribosyl pyrophosphates (PRPP) and glyceraldehyde-3-phosphate (G3P) at 6 h.p.i. of RV-SA11 infection (products of the pentose phosphate pathway shunting out of glycolysis pathway) might attest for the same (Supplementary pdf 3). As for increased citrate and pyruvate levels, it will be interesting to check their source, which might be either glucose (through increased glycolysis and influx into TCA cycle) or glutamine (through reductive carboxylation pathway). A very recent study60 on porcine rotaviruses has highlighted the importance of glutamine in promoting virus infection by channelizing glutamine toward replenishment of TCA cycle intermediates like alpha ketoglutarate. But alpha ketoglutarate supplementation was not able to completely restore the absence of glutamine, which indicates that glutamine might have a more extensive role to play in RV infection.
Glutamate and aspartate production necessitates the presence of glutamine as the parental source. Use of L-DON, a competitive inhibitor of glutamine, impaired RV replication possibly by preventing its utilization as a substrate by enzymes such as GLS, ASNS, CAD or PPAT which either converts glutamine to glutamate or utilizes its amido-group or gamma nitrogen for asparagine production or nucleotide generation respectively. RV infection in host cells indeed upregulated the expression of certain enzymes like GLS, GOT2 and ASNS especially at early times of infection (6–12 h.p.i.), where viral genome replication, protein translation and amassing of other building blocks for complete viral progeny formation takes place. Previous studies have shown that RV triggers host cellular G1 to S phase transition35 and S/G2 interphase arrest)61,62 during early infection, to create a suitable niche for usurping host cellular replication machinery for virus replication and protein translation. As replication/translation steps require abundant supply of nucleotides and amino acids, it is imperative of cells to increase expression of enzymes catalyzing their production.
The enzyme GOT2 (or AAT) catalyzes the transamination of glutamate and oxaloacetate to generate alpha ketoglutarate and aspartate. Aspartate is utilized in de-novo biosynthesis of pyrimidine nucleotides or used in conjunction with glutamine to generate amino acids like asparagine. Aspartate and asparagine can both contribute to viral protein synthesis and asparagine might also take over as the dominant amino acid sustaining cellular needs of amino acids when glutamine cataplerosis rates are high.61,63,64 Targeted inhibition of enzymes participating in glutamine catabolism decreased RV infection except for treatment with small molecule inhibitor against glutamate dehydrogenase. GLUD and GOT2, both act upon glutamate to produce alpha ketoglutarate. GLUD utilizes glutamate as the sole substrate65 while GOT2 supports the transamination reaction involving both glutamate and oxaloacetate to promote alpha Ketoglutarate and aspartate generation66,67 Since protein expression levels of GLUD remain unchanged in virus infection, it is possible that GOT2 compensates for alpha ketoglutarate production, additionally generating aspartate. Also, it was found that inhibition of GLUD by R162 did not substantially impact RV infection. This observation is also consistent with a previous study reporting only 3% decrease in RV-SA11 titer on use of the flavonoid epigallocatechin gallate (EGCG), another established inhibitor of the GLUD enzyme.68 The dispensability of GLUD in RV infection could be due to its regulation by mTOR which is supressed during early hours (4–8 h.p.i.) of RV infection39 and is known to modulate GLUD activity by regulation of its upstream factors like CREB-2 and SIRT-4.69
Reduced RV transcription/protein expression was observed in presence of GOT inhibitor AOAA and siRNA targeting ASNS. This effect on virus replication/translation could be rescued on supplementing glutamine depleted or inhibitor treated infection media with aspartate or asparagine suggesting that aspartate and asparagine act as pro-viral factors for RV replication in cells. Glutamine catabolism plays a pivotal role in generation of aspartate and asparagine.70 Aspartate formation is aided by glutamate and oxaloacetate in the mitochondria. Aspartate then gets transported to the cytoplasm by the antiporter, SLC25A12 in exchange of glutamate.71 Intracellular aspartate levels post RV infection, was found to be elevated during early infection (6 h.p.i.) (Supplementary Figure S2. B). Increased GOT2 protein expression (Figure 3b) during early hours of RV infection also attests for the same. Herein, consistently increased expression of the SLC25A12 protein in RV-SA11 infection compared to uninfected controls was observed (Supplementary Figure S3. B). SLC25A12 is a calcium binding mitochondrial transporter protein.72 RV infection, which is accompanied by increased calcium spikes early during infection,73 might induce the activity of SLC25A12 transporters, coupling increased calcium availability with increased expression of SLC25A12 protein. This might facilitate higher glutamate and aspartate transport across mitochondria. The aspartate transported out of mitochondria can participate either in nucleotide biosynthesis pathway, or in asparagine biosynthesis or fuel the malate aspartate shuttle. Downregulation of the GOT1 enzyme, especially at later time points of RV infection reduces the possibility of aspartate being channelized down the malate aspartate shuttle. Rather, increased p-CAD (Supplementary Figure S3. B) and ASNS levels (Figure 3b) suggest preferential utilization of aspartate for nucleotide or asparagine biosynthesis. Interestingly, supplementation of AOAA treated infection media with 4 mM aspartate had less restorative effect on viral RNA and protein compared to 4 mM of asparagine (Figure 4h). There are recent reports, regarding asparagine’s fundamentality in cell survival and proliferation processes. Besides accentuating protein synthesis on increased cellular demands, asparagine also supports mTORC1 activity and nucleotide biosynthesis63,74 often taking over for glutamine during high glutamine catabolism or limited glutamine supply. As virus entry into the cells exorcises them to increase protein and nucleotide synthesis, asparagine’s role in virus infection has gained recognition in the recent times. Studies on viruses such as, Kaposi’s Sarcoma associated Herpesviridae (KSHV),75 VACV76 and rhabdoviruses77 have established asparagine’s role, complementary to glutamine in protein and nucleotide synthesis. Our present study, investigating the role of the glutamine catabolism pathway during RV infection in intestinal cells, is further proof of asparagine’s beneficial role in virus replication.
AOAA is a pan transaminase inhibitor, but it has been shown to reduce the enzymatic activity of both GOT1 and GOT2 significantly.78 AOAA treatment in cells infected with RV-SA11 decreased the enzyme activity of aspartate transaminases in vitro (data not shown) and in-vivo (Figure 5e). Moreover, as the downstream products of GOT2, i.e., aspartate and especially asparagine were able to rescue RV-SA11 infection, this implies that GOT activity generating aspartate and asparagine is important for RV infection. Moreover, the rescue of RV-SA11 on aspartate/asparagine supplementation coupled to initial increases in GOT2 protein expression is also indicative of its superiority over GOT1. As no specific inhibitors targeting GOT2 or ASNS are available commercially, effect of AOAA was assessed in mice model. Consistent to the previous studies with AOAA in mice models for colitis79 and post-infarction cardiac dysfunction,80 no cytotoxicity was observed in mice with AOAA treatment upto 20 mg/kg/day (Supplementary Figure S5). AOAA treatment in RV-SA11 infected mice revealed profound decrease in RV replication accompanied by decrease in activity of AAT enzyme activity. RV-SA11 infection severely damaged small intestinal villi morphology in infected mice which was found to be partially restored following AOAA treatment.
Use of omics-based platforms for biomarker identification and drug target discovery is being increasingly employed in infectious diseases. Our study elucidates the alteration of the metabolic landscape of human intestinal cells infected with RV. This study underscores the crucial role that glutamine and its metabolites like glutamate, aspartate and asparagine play during RV infection. The study also identifies the host aspartate transaminase enzyme as a suitable target for antiviral drug development besides unraveling the antiviral potency (in-vitro and in-vivo) of AOAA, a small molecule inhibitor of host cellular aspartate transaminase enzyme.
Supplementary Material
Acknowledgments
Authors acknowledge the DBT-SAHAJ Metabolomics/Mass Spectroscopy Facility at the Rajiv Gandhi Centre of Biotechnology, Thiruvanthapuram Kerala for performing the LC-MS/MS metabolomics of samples sent to them by the Division of Virology, ICMR-NICED. Authors extend their gratitude to Dr. Mahadeb Lo and Ms. Priyanka Saha for their help during sample processing for Metabolomics.
Funding Statement
Authors would like to thank the Human Resources Department, Department of Health Research for providing grant and fellowship for this study to Ms. Suvrotoa Mitra under the ICMR-DHR Young Scientist Scheme (No. R.12014/14/2021-HR) and the Japan Initiative for Global Research Network on Infectious Diseases (J-GRID) from the Ministry of Education, Culture, Sports, Science and Technology in Japan (MEXT) and Japan Agency for Medical Research and Development (AMED) (grant no.: JP24wm0125004).
Disclosure statement
No potential conflict of interest was reported by the author(s).
Author contributions
MCS and SM conceptualized the study. SM, RS (Rakesh Sarkar), AM and MCS designed the experiments. SB and RS (Ranjana Sharma) helped with the in-vitro experiments. RDC contributed to design and execution of in-vivo experiments. AG contributed to imaging experiments. SM, RDC and MCS contributed to drafting and revising the manuscript. KK and S-IM helped with funding and infrastructure for carrying out the experiments related to this study. All authors read and approved the final manuscript.
Data availability statement
Metadata of the metabolomics analyses of mock and RV-SA11 infected cellular lysates at 6 and 12 h.p.i. has been deposited in FigShare and made available publicly under following DOIs:
https://doi.org/10.6084/m9.figshare.26356354.v1.
https://doi.org/10.6084/m9.figshare.26394838.v1.
Other relevant raw data will be made available on reasonable request to the author.
Ethical statement
The animal study was reviewed and approved by Institutional Animal Ethical Committee (IAEC), ICMR-National Institute of Cholera and Enteric Diseases (Proposal Number PRO/190/- Nov 2022–25; Certificate No. NICED/CPCSEA/68/GO/(25/294)/2022-IAEC/MC/1)
Supplementary material
Supplemental data for this article can be accessed online at https://doi.org/10.1080/19490976.2024.2428425
References
- 1.Whitaker-Dowling P, Youngner JS.. Virus-host cell interactions. Encycl Of Virol. 1999;1957:1961. DOI: 10.1006/rwvi.1999.0343 [DOI] [Google Scholar]
- 2.Khan MM, Ernst O, Manes NP, Oyler BL, Fraser ID, Goodlett DR, Nita-Lazar A. Multi-omics strategies uncover host–pathogen interactions. ACS Infect Dis. [2019 Mar 11]. 5(4):493–21. doi: 10.1021/acsinfecdis.9b00080. [DOI] [PubMed] [Google Scholar]
- 3.Gomes F, Alfson K, Junqueira M. The application of OMICS technologies to interrogate host-virus interactions. Front Cell Infect Microbiol. [2022 Nov 14]. 12:1050012. doi: 10.3389/fcimb.2022.1050012. [DOI] [PMC free article] [PubMed] [Google Scholar]
- 4.Oliver SG, Winson MK, Kell DB, Baganz F. Systematic functional analysis of the yeast genome. Trends In Biotechnol. [1998 Sep 1]. 16(9):373–378. doi: 10.1016/S0167-7799(98)01214-1. [DOI] [PubMed] [Google Scholar]
- 5.Kell DB, Oliver SG. The metabolome 18 years on: a concept comes of age. Metabolomics. 2016. Sep. 12(9):1–8. doi: 10.1007/s11306-016-1108-4. [DOI] [PMC free article] [PubMed] [Google Scholar]
- 6.Passalacqua KD, Purdy JG, Wobus CE, Mehle A. The inert meets the living: the expanding view of metabolic alterations during viral pathogenesis. PloS Pathog. [2019 Jul 25]. 15(7):e1007830. doi: 10.1371/journal.ppat.1007830. [DOI] [PMC free article] [PubMed] [Google Scholar]
- 7.Sumbria D, Berber E, Mathayan M, Rouse BT. Virus infections and host metabolism—can we manage the interactions? Front Immunol. [2021 Feb 3]. 11:594963. doi: 10.3389/fimmu.2020.594963. [DOI] [PMC free article] [PubMed] [Google Scholar]
- 8.Munger J, Bajad SU, Coller HA, Shenk T, Rabinowitz JD. Dynamics of the cellular metabolome during human cytomegalovirus infection. PloS Pathog. 2006. Dec. 2(12):e132. doi: 10.1371/journal.ppat.0020132. [DOI] [PMC free article] [PubMed] [Google Scholar]
- 9.Chambers JW, Maguire TG, Alwine JC. Glutamine metabolism is essential for human cytomegalovirus infection. J Virol. [2010 Feb 15]. 84(4):1867–1873. doi: 10.1128/JVI.02123-09. [DOI] [PMC free article] [PubMed] [Google Scholar]
- 10.Vastag L, Koyuncu E, Grady SL, Shenk TE, Rabinowitz JD, Lagunoff M. Divergent effects of human cytomegalovirus and herpes simplex virus-1 on cellular metabolism. PloS Pathog. [2011 Jul 14]. 7(7):e1002124. doi: 10.1371/journal.ppat.1002124. [DOI] [PMC free article] [PubMed] [Google Scholar]
- 11.Fontaine KA, Camarda R, Lagunoff M, Frueh K. Vaccinia virus requires glutamine but not glucose for efficient replication. J Virol. [2014 Apr 15]. 88(8):4366–4374. doi: 10.1128/JVI.03134-13. [DOI] [PMC free article] [PubMed] [Google Scholar]
- 12.Ritter JB, Wahl AS, Freund S, Genzel Y, Reichl U. Metabolic effects of influenza virus infection in cultured animal cells: intra-and extracellular metabolite profiling. BMC Syst Biol. 2010. Dec. 4(1):1–22. doi: 10.1186/1752-0509-4-61. [DOI] [PMC free article] [PubMed] [Google Scholar]
- 13.Fontaine KA, Sanchez EL, Camarda R, Lagunoff M, Sandri-Goldin RM. Dengue virus induces and requires glycolysis for optimal replication. J Virol. [2015 Feb 15]. 89(4):2358–2366. doi: 10.1128/JVI.02309-14. [DOI] [PMC free article] [PubMed] [Google Scholar]
- 14.Gualdoni GA, Mayer KA, Kapsch AM, Kreuzberg K, Puck A, Kienzl P, Oberndorfer F, Frühwirth K, Winkler S, Blaas D, et al. Rhinovirus induces an anabolic reprogramming in host cell metabolism essential for viral replication. Proc Natl Acad Sci USA. [2018 Jul 24]. 115(30):E7158–65. doi: 10.1073/pnas.1800525115. [DOI] [PMC free article] [PubMed] [Google Scholar]
- 15.Martin-Vicente M, González-Riaño C, Barbas C, Jimenez-Sousa MÁ, Brochado-Kith O, Resino S, Martinez I. Metabolic changes during respiratory syncytial virus infection of epithelial cells. PloS one. [2020 Mar 26]. 15(3):e0230844. doi: 10.1371/journal.pone.0230844. [DOI] [PMC free article] [PubMed] [Google Scholar]
- 16.Greene KS, Choi A, Chen M, Yang N, Li R, Qiu Y, Lukey MJ, Rojas KS, Shen J, Wilson KF et al. Inhibiting glutamine metabolism blocks coronavirus replication in mammalian cells. bioRxiv. 2023; 2023–2029. doi: 10.1101/2023.09.27.559756. [DOI] [Google Scholar]
- 17.Yang W, Hood BL, Chadwick SL, Liu S, Watkins SC, Luo G, Conrads TP, Wang T. Fatty acid synthase is up‐regulated during hepatitis C virus infection and regulates hepatitis C virus entry and production. Hepatology. 2008. Nov. 48(5):1396–1403. doi: 10.1002/hep.22508. [DOI] [PMC free article] [PubMed] [Google Scholar]
- 18.Heaton NS, Perera R, Berger KL, Khadka S, Dj L, Kuhn RJ, Randall G. Dengue virus nonstructural protein 3 redistributes fatty acid synthase to sites of viral replication and increases cellular fatty acid synthesis. Proc Natl Acad Sci USA. [2010 Oct 5]. 107(40):17345–17350. doi: 10.1073/pnas.1010811107. [DOI] [PMC free article] [PubMed] [Google Scholar]
- 19.Bhatt AP, Jacobs SR, Freemerman AJ, Makowski L, Rathmell JC, Dittmer DP, Damania B. Dysregulation of fatty acid synthesis and glycolysis in non-Hodgkin lymphoma. Proc Natl Acad Sci USA. [2012 Jul 17]. 109(29):11818–11823. doi: 10.1073/pnas.1205995109. [DOI] [PMC free article] [PubMed] [Google Scholar]
- 20.Nchoutmboube JA, Viktorova EG, Scott AJ, Ford LA, Pei Z, Watkins PA, Ernst RK, Belov GA, Semler BL. Increased long chain acyl-Coa synthetase activity and fatty acid import is linked to membrane synthesis for development of picornavirus replication organelles. PLOS Pathog. [2013 June 6]. 9(6):e1003401. doi: 10.1371/journal.ppat.1003401. [DOI] [PMC free article] [PubMed] [Google Scholar]
- 21.Greseth MD, Traktman P, Alwine JC. De Novo fatty acid biosynthesis contributes significantly to establishment of a bioenergetically favorable environment for vaccinia virus infection. PLOS Pathog. [2014 Mar 20]. 10(3):e1004021. doi: 10.1371/journal.ppat.1004021. [DOI] [PMC free article] [PubMed] [Google Scholar]
- 22.Limsuwat N, Boonarkart C, Phakaratsakul S, Suptawiwat O, Auewarakul P. Influence of cellular lipid content on influenza a virus replication. Arch Virol. 2020. May. 165(5):1151–1161. doi: 10.1007/s00705-020-04596-5. [DOI] [PMC free article] [PubMed] [Google Scholar]
- 23.Dias SS, Cunha-Fernandes T, Souza-Moreira L, Soares VC, Lima GB, Azevedo-Quintanilha IG, Santos J, Pereira-Dutra F, Freitas C, Reis PA, et al. Metabolic reprogramming and lipid droplets are involved in zika virus replication in neural cells. J Neuroinflammation. [2023 Mar 8]. 20(1):61. doi: 10.1186/s12974-023-02736-7. [DOI] [PMC free article] [PubMed] [Google Scholar]
- 24.Hulse M, Johnson SM, Boyle S, Caruso LB, Tempera I, Jung JU. Epstein-barr virus-encoded latent membrane protein 1 and B-cell growth transformation induce lipogenesis through fatty acid synthase. J Virol. [2021 Jan 28]. 95(4):10–128. doi: 10.1128/JVI.01857-20. [DOI] [PMC free article] [PubMed] [Google Scholar]
- 25.Chu J, Xing C, Du Y, Duan T, Liu S, Zhang P, Cheng C, Henley J, Liu X, Qian C, et al. Pharmacological inhibition of fatty acid synthesis blocks SARS-CoV-2 replication. Nat Metab. 2021. Nov. 3(11):1466–1475. doi: 10.1038/s42255-021-00479-4. [DOI] [PMC free article] [PubMed] [Google Scholar]
- 26.Gaunt ER, Zhang Q, Cheung W, Wakelam MJ, Lever AM, Desselberger U. Lipidome analysis of rotavirus-infected cells confirms the close interaction of lipid droplets with viroplasms. J Gener Virol. 2013. Jul. 94(7):1576–1586. doi: 10.1099/vir.0.049635-0. [DOI] [PMC free article] [PubMed] [Google Scholar]
- 27.Aliyari SR, Ghaffari AA, Pernet O, Parvatiyar K, Wang Y, Gerami H, Tong AJ, Vergnes L, Takallou A, Zhang A, et al. Suppressing fatty acid synthase by type I interferon and chemical inhibitors as a broad spectrum anti-viral strategy against SARS-CoV-2. Acta Pharmaceutica Sin B. [2022 Apr 1]. 12(4):1624–1635. doi: 10.1016/j.apsb.2022.02.019. [DOI] [PMC free article] [PubMed] [Google Scholar]
- 28.Van Nguyen T, Kasantikul T, Piewbang C and Techangamsuwan S. Evolutionary dynamics of canine kobuvirus in Vietnam and Thailand reveal the evidence of viral ability to evade host immunity. Sci Rep. 2024;14(1). doi: 10.1038/s41598-024-62833-2. [DOI] [PMC free article] [PubMed] [Google Scholar]
- 29.Su G, Liu J, Duan C, Fang P, Fang L, Zhou Y and Xiao S. Enteric coronavirus PDCoV evokes a non-Warburg effect by hijacking pyruvic acid as a metabolic hub. Redox Biol. 2024;71. doi: 10.1016/j.redox.2024.103112 103112. [DOI] [PMC free article] [PubMed] [Google Scholar]
- 30.Qin C, Rao Y, Yuan H, Wang TY, Zhao J, Espinosa B, Liu Y, Zhang S, Savas AC, Liu Q, et al. SARS-CoV-2 couples evasion of inflammatory response to activated nucleotide synthesis. Proc Natl Acad Sci USA. [2022 June 28]. 119(26):e2122897119. doi: 10.1073/pnas.2122897119. [DOI] [PMC free article] [PubMed] [Google Scholar]
- 31.Du Y, Chen C, Zhang X, Yan D, Jiang D, Liu X, Yang M, Ding C, Lan L, Hecht R, et al. Global burden and trends of rotavirus infection-associated deaths from 1990 to 2019: an observational trend study. Virol J. [2022 Oct 20]. 19(1):166. doi: 10.1186/s12985-022-01898-9. [DOI] [PMC free article] [PubMed] [Google Scholar]
- 32.Ramig RF. Pathogenesis of intestinal and systemic rotavirus infection. J Virol. [2004 Oct 1]. 78(19):10213–10220. doi: 10.1128/JVI.78.19.10213-10220.2004. [DOI] [PMC free article] [PubMed] [Google Scholar]
- 33.Chattopadhyay S, Basak T, Nayak MK, Bhardwaj G, Mukherjee A, Bhowmick R, Sengupta S, Chakrabarti O, Chatterjee NS, Chawla-Sarkar M, et al. Identification of cellular calcium binding protein calmodulin as a regulator of rotavirus A infection during comparative proteomic study. PLOS ONE. [2013 Feb 20]. 8(2):e56655. doi: 10.1371/journal.pone.0056655. [DOI] [PMC free article] [PubMed] [Google Scholar]
- 34.Chang-Graham AL, Perry JL, Strtak AC, Ramachandran NK, Criglar JM, Philip AA, Patton JT, Estes MK, Hyser JM. Rotavirus calcium dysregulation manifests as dynamic calcium signaling in the cytoplasm and endoplasmic reticulum. Sci Rep. [2019 Jul 25]. 9(1):10822. doi: 10.1038/s41598-019-46856-8. [DOI] [PMC free article] [PubMed] [Google Scholar]
- 35.Bhowmick R, Banik G, Chanda S, Chattopadhyay S, Chawla-Sarkar M. Rotavirus infection induces G1 to S phase transition in MA104 cells via Ca+ 2/Calmodulin pathway. Virology. [2014 Apr 1]. 454–455:270–279. doi: 10.1016/j.virol.2014.03.001. [DOI] [PMC free article] [PubMed] [Google Scholar]
- 36.López T, Silva-Ayala D, López S, Arias CF. Replication of the rotavirus genome requires an active ubiquitin-proteasome system. J Virol. [2011 Nov 15]. 85(22):11964–11971. doi: 10.1128/JVI.05286-11. [DOI] [PMC free article] [PubMed] [Google Scholar]
- 37.Silva-Ayala D, López T, Gutiérrez M, Perrimon N, López S, Arias CF. Genome-wide RNAi screen reveals a role for the ESCRT complex in rotavirus cell entry. Proc Natl Acad Sci USA. [2013 June 18]. 110(25):10270–10275. doi: 10.1073/pnas.1304932110. [DOI] [PMC free article] [PubMed] [Google Scholar]
- 38.Chanda S, Nandi S, Chawla‐Sarkar M. Rotavirus‐induced miR‐142‐5p elicits proviral milieu by targeting non‐canonical transforming growth factor ββββ signalling and apoptosis in cells. Cellular Microbiol. 2016. May. 18(5):733–747. doi: 10.1111/cmi.12544. [DOI] [PubMed] [Google Scholar]
- 39.Mukhopadhyay U, Chanda S, Patra U, Mukherjee A, Komoto S, Chawla‐Sarkar M. Biphasic regulation of RNA interference during rotavirus infection by modulation of Argonaute2. Cellular Microbiol. 2019. Dec. 21(12):e13101. doi: 10.1111/cmi.13101. [DOI] [PMC free article] [PubMed] [Google Scholar]
- 40.Patra U, Mukhopadhyay U, Sarkar R, Mukherjee A, Chawla-Sarkar M. RA-839, a selective agonist of Nrf2/ARE pathway, exerts potent anti-rotaviral efficacy in vitro. Antiviral Res. [2019 Jan 1]. 161:53–62. doi: 10.1016/j.antiviral.2018.11.009. [DOI] [PubMed] [Google Scholar]
- 41.Banerjee S, Sarkar R, Mukherjee A, Mitra S, Gope A, Chawla-Sarkar M. Rotavirus-induced lncRNA SLC7A11-AS1 promotes ferroptosis by targeting cystine/glutamate antiporter xCT (SLC7A11) to facilitate virus infection. Virus Res. [2024 Jan 2]. 339:199261. doi: 10.1016/j.virusres.2023.199261. [DOI] [PMC free article] [PubMed] [Google Scholar]
- 42.Eichwald C, Arnoldi F, Laimbacher AS, Schraner EM, Fraefel C, Wild P, Burrone OR, Ackermann M. Rotavirus viroplasm fusion and perinuclear localization are dynamic processes requiring stabilized microtubules. PLoS One. 2012 7(10): e47947. doi: 10.1371/journal.pone.0047947. [DOI] [PMC free article] [PubMed] [Google Scholar]
- 43.Cheung W, Gill M, Esposito A, Kaminski CF, Courousse N, Chwetzoff S, Trugnan G, Keshavan N, Lever A, Desselberger U. Rotaviruses associate with cellular lipid droplet components to replicate in viroplasms, and compounds disrupting or blocking lipid droplets inhibit viroplasm formation and viral replication. J Virol. [2010 Jul 1]. 84(13):6782–6798. doi: 10.1128/JVI.01757-09. [DOI] [PMC free article] [PubMed] [Google Scholar]
- 44.Criglar JM, Estes MK, Crawford SE. Rotavirus-induced lipid droplet biogenesis is critical for virus replication. Front Physiol. [2022 Mar 23]. 13:836870. doi: 10.3389/fphys.2022.836870. [DOI] [PMC free article] [PubMed] [Google Scholar]
- 45.Martínez JL, Eichwald C, Schraner EM, López S, Arias CF. Lipid metabolism is involved in the association of rotavirus viroplasms with endoplasmic reticulum membranes. Virology. [2022 Apr 1]. 569:29–36. doi: 10.1016/j.virol.2022.02.005. [DOI] [PubMed] [Google Scholar]
- 46.Chen S, Ding S, Yin Y, Xu L, Li P, Peppelenbosch MP, Pan Q, Wang W. Suppression of pyrimidine biosynthesis by targeting DHODH enzyme robustly inhibits rotavirus replication. Antiviral Res. [2019 Jul 1]. 167:35–44. doi: 10.1016/j.antiviral.2019.04.005. [DOI] [PubMed] [Google Scholar]
- 47.Wishart DS, Tzur D, Knox C, Eisner R, Guo AC, Young N, Cheng D, Jewell K, Arndt D, Sawhney S, et al. HMDB: the human metabolome database. Nucleic Acids Res. [2007 Jan 1]. 35(suppl_1):D521–6. doi: 10.1093/nar/gkl923. [DOI] [PMC free article] [PubMed] [Google Scholar]
- 48.Aoki K F and Kanehisa M. (2005). Using the KEGG Database Resource. CP in Bioinf. 11(1). doi: 10.1002/0471250953.bi0112s11. [DOI] [PubMed] [Google Scholar]
- 49.Metsalu T, Vilo J. ClustVis: a web tool for visualizing clustering of multivariate data using Principal component analysis and heatmap. Nucleic Acids Res. [2015 Jul 1]. 43(W1):W566–70. doi: 10.1093/nar/gkv468. [DOI] [PMC free article] [PubMed] [Google Scholar]
- 50.Pang Z, Lu Y, Zhou G, Hui F, Xu L, Viau C, Spigelman AF, MacDonald P, Wishart DS, Li S, et al. MetaboAnalyst 6.0: towards a unified platform for metabolomics data processing, analysis and interpretation. Nucleic Acids Res. [2024 Apr 8:gkae253.52(W1):W398–W406. doi: 10.1093/nar/gkae253. [DOI] [PMC free article] [PubMed] [Google Scholar]
- 51.Hulsen T DeepVenn--a web application for the creation of area-proportional venn diagrams using the deep learning framework tensorflow. js. arXiv preprint arXiv:2210.04597. 2022 Sep 27]. [Google Scholar]
- 52.Bagchi P, Dutta D, Chattopadhyay S, Mukherjee A, Halder UC, Sarkar S, Kobayashi N, Komoto S, Taniguchi K, Chawla-Sarkar M. Rotavirus nonstructural protein 1 suppresses virus-induced cellular apoptosis to facilitate viral growth by activating the cell survival pathways during early stages of infection. J Virol. [2010 Jul 1]. 84(13):6834–6845. doi: 10.1128/JVI.00225-10. [DOI] [PMC free article] [PubMed] [Google Scholar]
- 53.Sarkar R, Patra U, Lo M, Mukherjee A, Biswas A, Chawla‐Sarkar M. Rotavirus activates a noncanonical atm‐Chk2 branch of DNA damage response during infection to positively regulate viroplasm dynamics. Cellular Microbiol. 2020. Mar. 22(3):e13149. doi: 10.1111/cmi.13149. [DOI] [PubMed] [Google Scholar]
- 54.Banerjee S, Sarkar R, Mukherjee A, Miyoshi SI, Kitahara K, Halder P, Koley H, Chawla-Sarkar M. Quercetin, a flavonoid, combats rotavirus infection by deactivating rotavirus-induced pro-survival nf-κB pathway. Front Microbiol. [2022 Aug 2]. 13:951716. doi: 10.3389/fmicb.2022.951716. [DOI] [PMC free article] [PubMed] [Google Scholar]
- 55.Sarkar R, Banerjee S, Halder P, Koley H, Komoto S, Chawla-Sarkar M. Suppression of classical nuclear import pathway by importazole and ivermectin inhibits rotavirus replication. J Antimicrob Chemother. [2022 Dec 1]. 77(12):3443–3455. doi: 10.1093/jac/dkac339. [DOI] [PubMed] [Google Scholar]
- 56.Huang RC, Panin M, Romito RR, Huang YT. Inhibition of replication of human respiratory syncytial virus by 6-diazo-5-oxo-L-norleucine. Antiviral Res. [1994 Dec 1]. 25(3–4):269–279. doi: 10.1016/0166-3542(94)90009-4. [DOI] [PubMed] [Google Scholar]
- 57.McDermott RH, Butler M. Uptake of glutamate, not glutamine synthetase, regulates adaptation of mammalian cells to glutamine-free medium. J Cell Sci. [1993 Jan 1]. 104(1):51–58. doi: 10.1242/jcs.104.1.51. [DOI] [PubMed] [Google Scholar]
- 58.Newsholme P, Procopio J, Lima MM, Tc P, Curi R. Glutamine and glutamate—their central role in cell metabolism and function. Cell Biochem And Function. 2003. Mar. 21(1):1–9. doi: 10.1002/cbf.1003. [DOI] [PubMed] [Google Scholar]
- 59.Tohyama S, Fujita J, Hishiki T, Matsuura T, Hattori F, Ohno R, Kanazawa H, Seki T, Nakajima K, Kishino Y, et al. Glutamine oxidation is indispensable for survival of human pluripotent stem cells. Cell Metab. [2016 Apr 12]. 23(4):663–674. doi: 10.1016/j.cmet.2016.03.001. [DOI] [PubMed] [Google Scholar]
- 60.Liu H, Tian H, Hao P, Du H, Wang K, Qiu Y, Yin X, Wu N, Du Q, Tong D, et al. PoRVA G9P [23] and G5P 7] infections differentially promote PEDV replication by reprogramming glutamine metabolism. PLOS Pathog. [2024 June 21]. 20(6):e1012305. doi: 10.1371/journal.ppat.1012305. [DOI] [PMC free article] [PubMed] [Google Scholar]
- 61.Zhang J, Fan J, Venneti S, Cross JR, Takagi T, Bhinder B, Djaballah H, Kanai M, Cheng EH, Judkins AR, et al. Asparagine plays a critical role in regulating cellular adaptation to glutamine depletion. Mol Cell. [2014 Oct 23]. 56(2):205–218. doi: 10.1016/j.molcel.2014.08.018. [DOI] [PMC free article] [PubMed] [Google Scholar]
- 62.Glück S, Buttafuoco A, Meier A F, Arnoldi F, Vogt B, Schraner E M, Ackermann M, Eichwald C and Zhao R Y. (2017). Rotavirus replication is correlated with S/G2 interphase arrest of the host cell cycle. PLoS ONE 12(6):e0179607. doi: 10.1371/journal.pone.0179607. [DOI] [PMC free article] [PubMed] [Google Scholar]
- 63.Krall AS, Xu S, Graeber TG, Braas D, Christofk HR. Asparagine promotes cancer cell proliferation through use as an amino acid exchange factor. Nat Commun. [2016 Apr 29]. 7(1):1–3. doi: 10.1038/ncomms11457. [DOI] [PMC free article] [PubMed] [Google Scholar]
- 64.Pant A, Yang Z. Asparagine: an Achilles heel of virus replication? ACS Infect Dis. [2020 Aug 12]. 6(9):2301–2303. doi: 10.1021/acsinfecdis.0c00504. [DOI] [PubMed] [Google Scholar]
- 65.Plaitakis A, Kalef-Ezra E, Kotzamani D, Zaganas I, Spanaki C. The glutamate dehydrogenase pathway and its roles in cell and tissue biology in health and disease. Biology. [2017 Feb 8]. 6(1):11. doi: 10.3390/biology6010011. [DOI] [PMC free article] [PubMed] [Google Scholar]
- 66.Yang H, Zhou L, Shi Q, Zhao Y, Lin H, Zhang M, Zhao S, Yang Y, Ling ZQ, Guan KL, et al. SIRT 3‐dependent GOT 2 acetylation status affects the malate–aspartate NADH shuttle activity and pancreatic tumor growth. The EMBO J. [2015 Apr 15]. 34(8):1110–1125. doi: 10.15252/embj.201591041. [DOI] [PMC free article] [PubMed] [Google Scholar]
- 67.Li Y, Li B, Xu Y, Qian L, Xu T, Meng G, Li H, Wang Y, Zhang L, Jiang X, et al. GOT2 silencing promotes reprogramming of glutamine metabolism and sensitizes hepatocellular carcinoma to glutaminase inhibitors. Cancer Res. [2022 Sep 16]. 82(18):3223–3235. doi: 10.1158/0008-5472.CAN-22-0042. [DOI] [PubMed] [Google Scholar]
- 68.Lipson SM, Karalis G, Karthikeyan L, Ozen FS, Gordon RE, Ponnala S, Bao J, Samarrai W, Wolfe E. Mechanism of anti-rotavirus synergistic activity by epigallocatechin gallate and a proanthocyanidin-containing nutraceutical. Food Environ Virol. 2017. Dec. 9(4):434–443. doi: 10.1007/s12560-017-9299-z. [DOI] [PubMed] [Google Scholar]
- 69.Csibi A, Fendt SM, Li C, Poulogiannis G, Choo AY, Chapski DJ, Jeong SM, Dempsey JM, Parkhitko A, Morrison T, et al. The mTORC1 pathway stimulates glutamine metabolism and cell proliferation by repressing SIRT4. Cell. [2013 May 9]. 153(4):840–854. doi: 10.1016/j.cell.2013.04.023. [DOI] [PMC free article] [PubMed] [Google Scholar]
- 70.Zhang J, Pavlova NN, Thompson CB. Cancer cell metabolism: the essential role of the nonessential amino acid, glutamine. The EMBO J. [2017 May 15]. 36(10):1302–1315. doi: 10.15252/embj.201696151. [DOI] [PMC free article] [PubMed] [Google Scholar]
- 71.Amoedo ND, Punzi G, Obre E, Lacombe D, De Grassi A, Pierri CL, Rossignol R. AGC1/2, the mitochondrial aspartate-glutamate carriers. Biochim et Biophys Acta (BBA)-Mol Cell Res. [2016 Oct 1]. 1863(10):2394–2412. doi: 10.1016/j.bbamcr.2016.04.011. [DOI] [PubMed] [Google Scholar]
- 72.Del Arco A, Satrustegui J. Molecular cloning of Aralar, a new member of the mitochondrial carrier superfamily that binds calcium and is present in human muscle and brain. J Biol Chem. [1998 Sep 4]. 273(36):23327–23334. doi: 10.1074/jbc.273.36.23327. [DOI] [PubMed] [Google Scholar]
- 73.Pando V, Iša P, Arias CF, López S. Influence of calcium on the early steps of rotavirus infection. Virology. [2002 Mar 30]. 295(1):190–200. doi: 10.1006/viro.2001.1337. [DOI] [PubMed] [Google Scholar]
- 74.Pavlova NN, Hui S, Ghergurovich JM, Fan J, Intlekofer AM, White RM, Rabinowitz JD, Thompson CB, Zhang J. As extracellular glutamine levels decline, asparagine becomes an essential amino acid. Cell Metab. [2018 Feb 6]. 27(2):428–438. doi: 10.1016/j.cmet.2017.12.006. [DOI] [PMC free article] [PubMed] [Google Scholar]
- 75.Zhu Y, Li T, Ramos da Silva S, Lee JJ, Lu C, Eoh H, Jung JU, Gao SJ, Meng X-J. A critical role of glutamine and asparagine γ-nitrogen in nucleotide biosynthesis in cancer cells hijacked by an oncogenic virus. MBio. [2017 Sep 6]. 8(4):10–128. doi: 10.1128/mBio.01179-17. [DOI] [PMC free article] [PubMed] [Google Scholar]
- 76.Pant A, Cao S, Yang Z, Shisler JL. Asparagine is a critical limiting metabolite for vaccinia virus protein synthesis during glutamine deprivation. J Virol. [2019 Jul 1]. 93(13):10–128. doi: 10.1128/JVI.01834-18. [DOI] [PMC free article] [PubMed] [Google Scholar]
- 77.Li F, Fu X, Luo X, Lin Q, Liang H, Niu Y, Liu L, Li N. Role of asparagine biosynthesis pathway in Siniperca chuatsi rhabdovirus proliferation. Front Microbiol. [2023 Mar 31]. 14:1165491. doi: 10.3389/fmicb.2023.1165491. [DOI] [PMC free article] [PubMed] [Google Scholar]
- 78.Du K, Hyun J, Premont RT, Choi SS, Michelotti GA, Swiderska-Syn M, Dalton GD, Thelen E, Rizi BS, Jung Y, et al. Hedgehog-yap signaling pathway regulates glutaminolysis to control activation of hepatic stellate cells. Gastroenterology. [2018 Apr 1]. 154(5):1465–1479.e13. doi: 10.1053/j.gastro.2017.12.022. [DOI] [PMC free article] [PubMed] [Google Scholar]
- 79.Li W, Yu J, Jin B, Zhang H, Zhang J, Zhang W. Protective effects of aminooxyacetic acid on colitis induced in mice with dextran sulfate sodium. Biomed Res Int. 2021;2021(1):1–13. doi: 10.1155/2021/1477345. [DOI] [PMC free article] [PubMed] [Google Scholar]
- 80.Zhao P, Zhou W, Zhang Y, Li J, Zhao Y, Pan L, Shen Z, Chen W, Hui J. Aminooxyacetic acid attenuates post‐infarct cardiac dysfunction by balancing macrophage polarization through modulating macrophage metabolism in mice. J Cellular Mol Medi. 2020. Feb. 24(4):2593–2609. doi: 10.1111/jcmm.14972. [DOI] [PMC free article] [PubMed] [Google Scholar]
Associated Data
This section collects any data citations, data availability statements, or supplementary materials included in this article.
Supplementary Materials
Data Availability Statement
Metadata of the metabolomics analyses of mock and RV-SA11 infected cellular lysates at 6 and 12 h.p.i. has been deposited in FigShare and made available publicly under following DOIs:
https://doi.org/10.6084/m9.figshare.26356354.v1.
https://doi.org/10.6084/m9.figshare.26394838.v1.
Other relevant raw data will be made available on reasonable request to the author.