

ABSTRACT
It has been proposed that cortical fine actin filaments are needed for the morphogenesis of pavement cells (PCs). However, the precise role and regulation mechanisms of actin filaments in PC morphogenesis are not well understood. Here, we found that Arabidopsis thaliana ACTIN DEPOLYMERIZING FACTOR9 (ADF9) is required for the morphogenesis of PC, which is negatively regulated by the R2R3 MYELOBLASTOSIS (MYB) transcription factor MYB52. In adf9 mutants, the lobe number of cotyledon PCs was significantly reduced, while the average lobe length did not differ significantly compared to that of wild type (Col‐0), except for the variations in cell area and circularity, whereas the PC shapes in ADF9 overexpression seedlings showed different results. ADF9 decorated actin filaments, and colocalized with plasma membrane. The extent of filament bundling and actin filament bundling activity in adf9 mutant decreased. In addition, MYB52 directly targeted the promoter of ADF9 and negatively regulated its expression. The myb52‐2 mutant showed increased lobe number and cell area, reduced cell circularity of PCs, and the PC phenotypes were suppressed when ADF9 was knocked out. Taken together, our data demonstrate that actin filaments play an important role in the morphogenesis of PC and reveal a transcriptional mechanism underlying MYB52 regulation of ADF9‐mediated actin filament bundling in PC morphogenesis.
Keywords: actin filament bundling, ADF9, MYB52, pavement cell
In Arabidopsis, the transcription factor MYB52 represses the expression of ACTIN DEPOLYMERIZING FACTOR9, leading to the decrease of actin filament bundles, thereby regulating pavement cell morphogenesis. In the myb52 mutant, the ACTIN DEPOLYMERIZING FACTOR9 activity is enhanced, promoting pavement cell morphogenesis.

INTRODUCTION
Cell shape formation is crucial for the development and morphogenesis of plant tissues and organs (Liang et al., 2018). The jigsaw puzzle‐shaped epidermal pavement cells (PCs) of Arabidopsis thaliana leaves and cotyledons provide an exciting model for understanding the formation of plant cell shapes. Arabidopsis PC development approximately involves three stages, from polygonal cells to multiple polar sites and interdigitated growth cells, and lobes form in the outgrowth regions, while the complementary regions of adjacent cells form indentations (Fu, 2002; Fu et al., 2005). The process of PC morphogenesis is highly coordinated between neighboring cells, regulated by phytohormones, cell wall components, mechanical stresses, and the cytoskeleton (Fu et al., 2005; Nagawa et al., 2010; Zhang et al., 2011; Labusch et al., 2013; Xu et al., 2014; Armour et al., 2015; Sapala et al., 2018, 2019; Altartouri et al., 2019; Haas et al., 2020; Belteton et al., 2021; Chen et al., 2022; Gao et al., 2023). It has been suggested that the initiation of lobes is prevented in microtubule‐enriched regions, while lobe elongation depends on fine actin filaments at lobe tips (Fu, 2002, 2005; Xu et al., 2010).
As one of the members of the cytoskeleton, actin filaments play an essential role in PC morphogenesis (Mathur, 2004; Szymanski and Staiger, 2018). It has been proposed that actin filaments are responsible for lobe elongation (Fu, 2002; Panteris and Galatis, 2005; Xu et al., 2010). In addition, recent detailed morphometric analyses of live cells also demonstrate that actin filament organization is concentrated at the neck regions adjacent to periclinal walls during development of lobes (Armour et al., 2015; Rosero et al., 2016). These data suggest that actin filaments are involved in PC morphogenesis; however, the mechanism of actin filaments in the regulation of PC shapes is still unclear.
ACTIN BINDING PROTEINS (ABPs) directly regulate the organization and dynamics of actin filaments (Qian et al., 2019). Several ABPs that regulate PC shapes have been reported; for example, in the ACTIN‐RELATED Protein 2/3 (ARP2/3) complex mutant plants, lobe elongation is significantly inhibited. Formin1 (FH1) mutants have larger PCs with more expansion lobes than the wild type (Li et al., 2003; Rosero et al., 2016).
Actin depolymerizing factor family is a kind of ABP that regulates the actin arrays and dynamics by their conserved severing and/or depolymerizing activity (Andrianantoandro and Pollard, 2006). Plant ADFs are involved in various biological processes, such as pollen tube polar growth, hypocotyl elongation, innate immunity, nematode infection, and stomatal movement (Clement et al., 2009; Tian et al., 2009; Zheng et al., 2013; Henty‐Ridilla et al., 2014; Inada et al., 2016; Zhao et al., 2016; Zhu et al., 2017; Qian et al., 2019). The Arabidopsis genome encodes 11 ADF proteins that are divided into four subclasses (subclasses I–IV) (Ruzicka et al., 2007). Subclass III contains ADF5 and ADF9, which evolve into actin bundling activity but lose their conserved severing and/or depolymerizing activity (Tholl et al., 2011; Nan et al., 2017). ADF9 is a flowering repressor by affecting the transcript level of FLOWERING LOCUS C (FLC) under long‐day conditions, and ADF9 mutation results in dwarfed plants (Burgos‐Rivera et al., 2008). However, the function of ADFs in PC morphogenesis is not well understood.
Transcription factors are essential for regulating gene expression in plant growth and development processes. However, few transcription factors have been identified to function in PC morphogenesis. The mechanism of transcriptional regulation in this process remains poorly understood. R2R3‐MYB (MYELOBLASTOSIS) proteins are one of the largest transcription factor families in plants that play crucial roles in the regulation of primary and secondary metabolism, cell fate and identity, developmental processes, and response to biotic and abiotic stresses (Dubos et al., 2010; Jiang and Rao, 2020). In Arabidopsis, MYB52 is a R2R3‐MYB transcription factor that is involved in the regulation of secondary wall thickening, pectin demethylesterification in seed coat mucilage, and response to drought stress (Ko et al., 2009; Park et al., 2011; Shi et al., 2018).
In this study, we found that ADF9 localizes at both actin filaments and the plasma membrane. ADF9 promotes morphogenesis of PC by increasing the actin filament bundle frequency. In addition, the R2R3 MYB transcription factor MYB52 regulates the morphogenesis of PC by directly binding the promoter of ADF9 and suppressing its expression. These results reveal the important roles of actin filaments and ADF9 in morphogenesis of PCs and describe the transcriptional regulation mechanism of PC morphogenesis.
RESULTS
ADF9 positively regulates the morphogenesis of pavement cells
To investigate whether ADF9 is involved in the morphogenesis of PCs, a T‐DNA insertion mutant of ADF9 (named adf9‐1) was identified (Figure S1A, B), a clustered regularly interspaced short palindromic repeats (CRISPR)/CRISPR‐associated nuclease 9 (Cas9)‐based mutant (named as adf9‐2) was generated (Figure S1C), and ADF9 complementation (ADF9‐COM) and overexpression (ADF9‐OE) lines were constructed by transforming ADF9 promoter (pADF9)::ADF9 and 35S::ADF9 into adf9‐1 and Columbia (Col‐0) seedlings respectively. Analysis of the gene edit of adf9‐2 by sequencing demonstrated that a 10 bp fragment was deleted, resulting in premature ADF9 translation. The quantitative real‐time polymerase chain reaction (RT‐qPCR) results revealed that the ADF9 transcript was absent in adf9‐1, while it showed a 7.42‐fold increase in ADF9‐OE #2 and a 13.45‐fold increase in ADF9‐OE #12 (Figure S1D). Additionally, the ADF9 transcript levels in ADF9‐COM #5 were similar to Col‐0 (Figure S1D).
The cotyledon phenotypes in ADF9‐OEs, adf9 mutants and ADF9‐COM #5 plants that were grown on ½ Murashige and Skoog (MS) medium for 7 d were first analyzed. Compared with Col‐0, ADF9‐OE seedlings had larger cotyledon areas, while adf9 mutant seedlings had smaller cotyledon areas, and ADF9‐COM #5 seedlings had similar cotyledon area. No difference was observed in the leaf length : width ratio between Col‐0 and all genotypes of ADF9 (Figure 1A, B). Then the PC shapes of Col‐0, ADF9‐OEs, adf9 mutants and ADF9‐COM #5 which were grown on ½ MS for 7 d were analyzed. Compared with Col‐0, the PC shapes of adf9‐1 and adf9‐2 showed significantly reduced cell area and average number of lobes, and increased cell circularity (Figure 1C, D). The PC phenotypes in adf9 mutants were restored in ADF9‐COM #5 (Figure 1C, D), suggesting that the PC phenotypes of adf9 mutants were caused by the loss of function of ADF9. The PC shapes in ADF9‐OEs had increased cell area and average number of lobes, and reduced cell circularity (Figure 1C, D). These data demonstrate that ADF9 positively regulates the morphogenesis of PC.
Figure 1.

Actin depolymerizing factor9 (ADF9) regulates morphogenesis of cotyledon pavement cells
(A) Phenotypes of cotyledons in Columbia (Col‐0), adf9‐1, adf9‐2, ADF9‐OE (overexpression) #2, ADF9‐OE #12, and ADF9‐COM (complementation) grown on ½ Murashige and Skoog (MS) medium for 7 d. Scale bars = 0.25 cm. (B) Statistical data of leaf area and length : width ratio for 7‐d‐old cotyledons of the genotypes depicted in (A). The values presented as mean ± SD, n > 30 cotyledons per genotype in each experiment. The significant differences are indicated with different letters (P < 0.05) using one‐way analysis of variance (ANOVA) and Tukey's test. (C) Cotyledon pavement cell phenotypes of Col‐0, adf9‐1, adf9‐2, ADF9‐OE #2, ADF9‐OE #12, and ADF9‐COM grown on ½ MS for 7 d. Scale bars = 100 µm. (D) Quantification of cell area, average lobe number, circularity, and average lobe length in (D). Values are means ± SD, n > 100 cells from about 30 leaves per genotype in each experiment. The significant differences are indicated with different letters (P < 0.05) using one‐way ANOVA and Tukey's test. Boxplots: the middle line of the box is the median. The upper and lower limits of the box are the upper quartile and the lower quartile. The line above and below the box represent the maximum and minimum values. Asterisks represent the mean value of samples. The dots represent the outliers.
ADF9 decorates both actin filaments and the plasma membrane
To determine the localization of ADF9 in PCs, two intramolecular ADF9‐eGFP (enhanced green fluorescent protein) fusion constructs were generated according to previously described methods (Okreglak and Drubin, 2007; Bou Daher et al., 2011; Zheng et al., 2013). The two fusion constructs were driven by the ADF9 native promoter and the insertion site for eGFP was after T7 and T13 of ADF9 respectively (Figure S2A). Separately, subcellular localization of ADF9‐eGFPT7 and ADF9‐eGFPT13 was observed, and ADF9‐eGFPT7 and ADF9‐eGFPT13 showed different subcellular localization (Figure S2B). Further analysis of the PC morphology found that only ADF9‐eGFPT7 fully rescued the phenotypes of adf9‐1 mutant (Figure S2C, D), suggesting that ADF9‐eGFPT7 is functional and the transgenic plant can be used to observe the subcellular localization of ADF9 in PCs.
To investigate the correlation of ADF9 subcellular localization and actin filaments, ADF9‐eGFPT7/adf9‐1 seedlings were crossed with fatty acid binding protein 2 (fABD2)‐mCherry lines, and the PCs of cotyledons grown on ½ MS for 4 d were used to observe ADF9 subcellular localization. Confocal microscopy observation found that the ADF9‐eGFPT7 signal overlapped with the fABD2‐mCherry and FM4‐64 signals (Figure 2A, B). A close association between GFP and mCherry signals was observed by plotting the signal intensities using ImageJ software (Figure 2C, D). The results indicated that ADF9 colocalized with actin filaments and bright dots at intervals on the plasma membrane. To confirm the membrane localization of ADF9, the membrane proteins were isolated from ADF9‐eGFPT7/adf9‐1 seedlings, a western blot experiment was performed using GFP antibody and the result was consistent with subcellular localization (Figure S2E). These results demonstrate that ADF9 is a dual‐localization protein found in the plasma membrane and actin filaments, and it plays a critical role in the morphogenesis of PCs.
Figure 2.

Actin depolymerizing factor9 (ADF9) localizes to both plasma membrane and actin filaments
(A) Subcellular localization of ADF9‐enhanced green fluorescent protein (eGFP)T7 genomic DNA (gDNA) controlled by its native promoter in the pavement cells (PCs) from fatty acid binding protein 2 (fABD2)‐mCherry seedlings. Images were processed using Z‐stacks (Z‐step size 0.4 μm) consisting of 15 individual images. Scale bars = 50 µm. (B) The 4‐d‐old seedlings that expressed ADF9‐eGFPT7 gDNA driven by native promoter dyed with FM4‐64. Scale bars = 50 µm. (C) Plot of the relative signal intensities along the line drawn in (A). It shows a strong association between the spatial localization of ADF9‐eGFPT7 and fABD2‐mCherry. (D) Plot of the relative signal intensities along the blue dotted line drawn in (B). It shows a strong association between the spatial localization of ADF9‐eGFPT7 and plasma membrane (PM).
Loss of ADF9 reduces actin filament bundling in the PCs of cotyledons
We next explored whether the organization and dynamics of actin filaments are affected when ADF9 is knocked out. We analyzed the actin arrays in Col‐0, adf9‐1 and ADF9‐COM #5 seedlings expressing lifeact‐eGFP. It appeared there were more bundled actin filaments in the PCs of Col‐0 plants than in adf9‐1 plants under the same conditions, and the PCs of ADF9‐COM #5 seedlings had similar actin arrays with that of Col‐0 (Figure 3A). We further quantified the skewness and density which are used to estimate the extent of actin filament bundling and the percentage of occupancy of actin filaments, respectively. The data showed that the skewness was significantly lower and the density of actin filaments was higher in the PCs of adf9‐1 mutant than that of Col‐0 and ADF9‐COM #5 plants (Figure 3B). These results demonstrate that ADF9 promotes actin filament bundling in the PCs.
Figure 3.

Actin depolymerizing factor9 (ADF9) promotes actin filament bundling
(A) Actin arrays in the pavement cells (PCs) of Columbia (Col‐0), adf9‐1 and ADF9‐COM (complementation) #5 cotyledons. Scale bars = 25 µm. (B) Quantification of the skewness and density of actin arrays in (A). All of the density and skewness values of Col‐0, adf9‐1 and ADF9‐COM #5 were statistically analyzed using Student's t‐test. **P < 0.01, and ***P < 0.001. Values are means ± SD, n = 3 experiments (approximately 300 images from 30 seedlings per genotype).
ADF9 is required for filaments bundling in the PCs of cotyledon
It has been reported that ADF9 promotes actin filament bundling in vitro (Nan et al., 2017), and our results showed the same actin filament bundle activity in vivo. To investigate the mechanism that ADF9 promotes actin filament bundling in the PCs, we investigated whether ADF9 contributes to the bundling and debundling events of actin filaments. We traced the formation process and quantified the frequency of actin bundling and debundling in the PCs from 5‐d‐old Col‐0, adf9‐1, and ADF9‐COM #5 seedlings expressing lifeact‐eGFP. The thick bundle was generated by zipping two adjacent filament bundles together (Movie S4) which can split into two thin actin filament bundles (Movie S5). Quantified data showed that the bundling frequency significantly decreased in adf9‐1 PCs, whereas there was no obvious difference in debundling frequency between adf9‐1 PCs and Col‐0 PCs; the bundling and debundling frequency in ADF9‐COM #5 seedlings were similar with that in Col‐0 (Figure 4B). These data demonstrate that ADF9 is required for actin filament bundling in PCs of cotyledons.
Figure 4.

Time‐lapse imaging of actin filaments revealed a reduction in the bundling frequency in actin depolymerizing factor9 (adf9) cotyledon pavement cells (PCs)
(A) Dynamics of single actin filaments in Columbia (Col‐0), adf9‐1 and ADF9‐COM (complementation) #5 cotyledon PCs. Images represent optical cuts. A filament highlighted with red dots are cut, green scissors indicate cutting events. Orange and purple dots indicate constriction of filament ends. (B) Quantification of dynamic parameters of single actin filament in the PCs of Col‐0, adf9‐1 and ADF9‐COM #5. More than 24 PCs from the Col‐0, adf9‐1 and ADF9‐COM #5 were used. Values given are means ± SE. *P < 0.05, **P < 0.01, and ***P < 0.001 by Student's t‐test.
We further analyzed the dynamics of single actin filaments in the PCs of Col‐0, adf9‐1 and ADF9‐COM #5 seedlings. Several dynamic parameters of single actin filaments were determined to confirm whether ADF9 is involved in the turnover of single filaments in PCs. We traced the single filament dynamics and quantified the severing frequency and depolymerization rate (Figure 4A; Movies S1, S2 and S3), and the results showed that both of the two parameters were significantly increased in the PCs of adf9‐1 when compared with Col‐0 and ADF9‐COM #5 plants under the same conditions (Figure 4B). Consequently, the max filament length, max filament life time, and elongation rate of actin filaments in adf9‐1 PCs were significantly reduced, compared with Col‐0 and ADF9‐COM #5 PCs (Figure 4B). These data further suggest that ADF9 is required for actin bundles in the PCs of cotyledons. Taken together, these results illustrate that ADF9 is critical for actin bundles to form heavy bundles in the PCs.
The expression of ADF9 is negatively regulated by MYB52
To investigate the potential upstream factors of ADF9 in the morphogenesis of PC, we analyzed the sequence of the ADF9 promoter and found that it contains three MYB binding site (MBS), AA(A/C) AAAC motifs that are generally targeted by MYB52. PECTIN METYLESTERASE 16 (PMEI6), a target of MYB52 which has been reported, was selected as a positive control (Figure 5A) (Franco‐Zorrilla et al., 2014; Shi et al., 2018). Electrophoretic mobility shift assays (EMSA) showed that glutathione S‐transferase (GST)‐MYB52 fusion protein bound the three target motifs (pADF9‐P1, pADF9‐P2, pADF9‐P3) of the ADF9 promoter; the shift band signals were significantly reduced when the cold probe competitors were added, and there was no mobility shift when the reaction used GST protein (Figure 5B–D). To confirm the EMSA result, we performed yeast one‐hybrid (Y1H) experiments and found that ADF9 is a MYB52 target gene (Figure S5), indicating that MYB52 specifically binds to the promoter of ADF9 in vitro. To determine whether MYB52 binds to the ADF9 promoter in vivo, 35S::HA‐MYB52 overexpression plants were generated and RT‐qPCR results showed that the relative expression level of MYB52 in the transgenic seedlings increased about 5.9‐fold (Figure S3B). Then we conducted chromatin immunoprecipitation (ChIP) followed qPCR assays. ChIP‐qPCR results revealed that the three target motifs of ADF9, along with the positive control PMEI6 (Ding et al., 2021), were significantly enriched in the ChIP with the anti‐hemagglutinin (anti‐HA) antibody, whereas the negative control ACTIN7 (ACT7) showed no enrichment (Figure 5H). These results indicate that ADF9 is a direct target gene of MYB52.
Figure 5.

MYELOBLASTOSIS52 (MYB52) recognizes Actin depolymerizing factor9 (ADF9) and negatively regulates ADF9 transcription
(A) AA(A/C) AAAC motif in the promoter regions of ADF9 and PECTIN METYLESTERASE 16 (PMEI6) and a random sequence in the promoter of ACTIN7 (ACT7) as negative controls. Arrows are employed to indicate sequences, while numbers represent the nucleotide position in relation to the initiation codon of the gene. (B, C, and D) Electrophoretic mobility shift (EMSA) for MYB52 bond to the ADF9 promoter on different positions of the MYB binding site (MBS) in vitro. The biotin‐labeled promoter sequence was supplemented with an excess of unlabeled cold probe for competition. Arrows indicate the binding signals resulting from MYB52 binding to the ADF9 promoter. (E) Analysis of the protein expression of ADF9 in total protein from cotyledons of ADF9‐enhanced green fluorescent protein (eGFP)T7 and ADF9‐eGFPT7/myb52‐2 seedlings using western blot assay, and the numbers indicate the band intensity that was quantified by densitometric analyses. (F) Fluorescence signals of ADF9‐eGFPT7 in the pavement cells (PCs) of adf9‐1 and adf9‐1 myb52‐2 cotyledons. Scale bar = 50 µm. (G) β‐glucuronidase (GUS) staining in cotyledons of different genotypes carrying pADF9::GUS. Scale bar = 500 μm. (H) Chromatin immunoprecipitation (ChIP) – quantitative polymerase chain reaction analysis of 35S‐HA‐MYB52 (MYB52‐OE (overexpression)) transgenic plants using anti‐hemagglutinin (anti‐HA) antibodies. pPMEI6 and pACT7 were positive and negative controls respectively. Data represent means ± SD of triplicates, and asterisks indicate significant differences as determined by Student's t‐test (***P < 0.001). (I) Relative expression levels of ADF9 in cotyledons of Columbia (Col‐0), myb52‐2, and MYB52‐OE seedlings. Data represent the mean ± SD of three replicates. Asterisks indicate statistical differences from Col‐0 using Student's t‐test (***P < 0.001). (J) Quantitative analysis of the relative fluorescence intensity of ADF9‐eGFPT7 in the PCs of adf9‐1 and adf9‐1 myb52‐2 cotyledons. The results represent the means ± SEs (n = 30). ***P < 0.001 (Student's t‐test). Three independent experiments were conducted. (K) Analysis of relative GUS activity in G.
To analyze the effect of MYB52 on the expression of ADF9, we identified a T‐DNA insertion mutant of MYB52 (named myb52‐2) (Figure S3A, B) and analyzed the transcript levels of ADF9 in myb52‐2 and MYB52‐OE plants. RT‐qPCR results showed that compared with Col‐0, the relative expression level of ADF9 was significantly increased in myb52‐2 but was decreased in MYB52‐OE plants (Figure 5I). In addition, we generated transgenic seedlings expressing pADF9::GUS (β‐glucuronidase) in Col‐0 and myb52‐2 mutant background. GUS staining and statistical data showed that the promoter activity was clearly increased in myb52‐2 mutants (Figure 5G, K), suggesting that ADF9 expression is negatively regulated by MYB52. To confirm the effect of MYB52 on ADF9 protein expression, we detected the relative expression of ADF9 in myb52‐2 seedlings by western blot and eGFP fluorescence signal detection, and found similar results (Figure 5E, F, J). Taken together, these findings demonstrate that MYB52 directly targets ADF9 and downregulates the expression of ADF9.
MYB52 functions as a negative regulator in the morphogenesis of PCs
We identified that ADF9 is a positive regulator of PC shapes and a direct target of MYB52. To further explore whether MYB52 is involved in morphogenesis of PCs, we analyzed the cotyledon phenotypes and PC shapes of Col‐0, myb52‐2, and MYB52‐OE that grown on ½ MS for 7 d. The cotyledon area was significantly decreased in MYB52‐OE but increased in myb52‐2 plants when compared with Col‐0, and there was no difference in leaf length: width ratio of cotyledons among Col‐0, MYB52‐OE and myb52‐2 seedlings (Figure 6A, B). In the PC morphogenesis, compared with Col‐0, cell area and lobe number were significantly increased, but cell circularity was reduced in the PCs of myb52‐2 plants. While the cell area and lobe number were significantly decreased, cell circularity was increased in the PCs of MYB52‐OE plants compared with that of Col‐0 (Figure 6C). Moreover, the average lobe length had no difference in both myb52‐2 and MYB52‐OE when compared with that of Col‐0 under the same conditions (Figure 6D). These results demonstrate that MYB52 is a negative regulator in PC morphogenesis.
Figure 6.

MYELOBLASTOSIS52 (MYB52) regulates the morphogenesis of cotyledon pavement cells (PCs)
(A) Phenotypes of cotyledons in 7‐d‐old Columbia (Col‐0), myb52‐2, and MYB52‐OE (overexpression) seedlings. Scale bars = 0.25 cm. (B) Statistical data of leaf area and length : width ratio in Col‐0, myb52‐2, and MYB52‐OE cotyledons. Values are means ± SD, n > 30 leaves per genotype in each experiment. Different letters indicate significant differences (P < 0.05) using one‐way analysis of variance (ANOVA) and Tukey's test. (C) PC phenotypes in Col‐0, myb52‐2, and MYB52‐OE grown on ½ Murashige and Skoog for 7 d. Scale bars = 100 µm. (D) Quantitative determination of cell area, circularity, average lobe number and lobe length of PCs. Values are means ± SD, n > 100 cells from about 30 leaves per genotype in each experiment. Different letters indicate significant differences (P < 0.05) using ANOVA and Tukey's test.
Mutation of ADF9 suppresses the morphogenesis of PCs in myb52‐2
MYB52 is involved in the morphogenesis of PCs and negatively regulates the expression of ADF9, suggesting that ADF9 may be needed in PC shapes regulated by MYB52. To test this hypothesis, we generated adf9‐1 myb52‐2 double mutant by crossing adf9‐1 and myb52‐2 (Figure S4). We observed the phenotypes and analyzed the leaf area and length : width ratio of cotyledons in Col‐0, adf9‐1, myb52‐2 and adf9‐1 myb52‐2; the results showed that myb52‐2 had larger cotyledons, while adf9‐1 myb52‐2 had smaller cotyledons when compared with Col‐0, which was similar to adf9‐1 plants. Leaf length : width ratio of cotyledons in all genotypes had no significant differences (Figure 7A, B). Moreover, analysis of PC morphology revealed that adf9‐1 myb52‐2 double mutants exhibited decreased cell area and lobe number, but increased cell circularity, similar to the adf9‐1 single mutant (Figure 7C, D). The results indicate that ADF9 functions genetically downstream of MYB52 in PC morphogenesis.
Figure 7.

Actin depolymerizing factor9 (ADF9) mutation suppresses the phenotypes of cotyledon pavement cells of myeloblastosis52 (myb52) mutant
(A) The cotyledon phenotypes of Columbia (Col‐0), adf9‐1, myb52‐2, and adf9‐1 myb52‐2 grown on ½ Murashige and Skoog medium for 7 d. Scale bars = 0.25 cm. (B) Quantitative analysis of leaf area and length : width ratio of the genotypes in (A). Values are means ± SD, n > 30 leaves per genotype in each experiment. The significant differences are indicated with different letters (P < 0.05) using one‐way analysis of variance (ANOVA) and Tukey's test. (C) Pavement cell (PC) phenotypes of 7‐d‐old Col‐0, myb52‐2, and adf9‐1 myb52‐2. Scale bars = 100 µm. (D) Data of cell area, average lobe number, circularity and average lobe length of the PCs in (C). Values are means ± SD, n > 100 cells from about 30 leaves per genotype in each experiment. The significant differences are indicated with different letters (P < 0.05) using one‐way ANOVA and Tukey's test.
The actin bundling activity of ADF9 is regulated by MYB52 in PCs
To further explore the function of MYB52 in regulating ADF9 in the morphogenesis of PCs, we analyzed the organizations and dynamics of actin filaments in the PCs of Col‐0, myb52‐2, and adf9‐1 myb52‐2 seedlings expressing lifeact‐eGFP. The actin filaments in PCs of myb52‐2 seedlings showed an increase in skewness and a decrease in density, while adf9‐1 myb52‐2 seedlings displayed a decrease in skewness and an increase in density, which are similar to those in adf9 mutants when compared with Col‐0 under the same conditions (Figure 8A, B), indicating that MYB52 has a different effect with ADF9 on actin arrays in PC morphogenesis. Moreover, the dynamic parameters of single actin filaments in the PCs of Col‐0, myb52‐2 and adf9‐1 myb52‐2 seedlings were quantified. Compared with Col‐0, the severing frequency and depolymerizing rates of single actin filaments in the myb52‐2 mutant were significantly decreased; the bundling frequency, elongation rate, max filament length and life time of actin filaments were clearly increased (Figure 8C). The defects of actin dynamics in myb52‐2 mutant seedlings were rescued by knocking out ADF9, and the adf9‐1 myb52‐2 seedlings displayed similar dynamic parameters of single actin filaments in adf9‐1 (Figure 8C). Thus, these data demonstrate that MYB52 negatively regulates the function of ADF9 in actin filament bundling in PCs.
Figure 8.
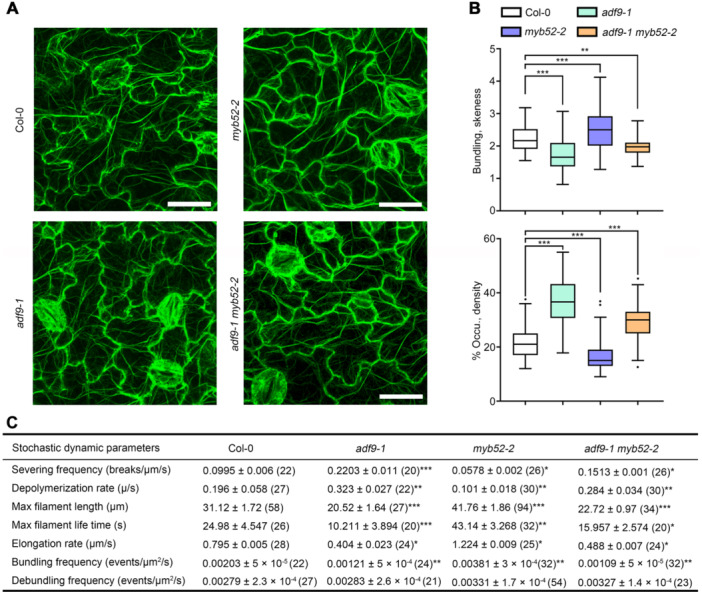
MYELOBLASTOSIS52 (MYB52) regulates Actin depolymerizing factor9 (ADF9)‐mediated actin filament bundling in the cotyledon pavement cells (PCs)
(A) Actin arrays in the PCs of Columbia (Col‐0), adf9‐1, myb52‐2, and adf9‐1 myb52‐2 grown on 1/2 Murashige and Skoog medium for 5 d. Scale bars = 25 µm. (B) Skewness and density of actin arrays in PCs of Col‐0, adf9‐1, myb52‐2, and adf9‐1 myb52‐2. All density and skewness values were statistically analyzed using Student's t‐test. *P < 0.05, **P < 0.01, and ***P < 0.001. Values are means ± SD, n = 30 cells from 10 seedlings per genotype. (C) Quantification of the dynamics parameters of single actin filaments in PCs of Col‐0, adf9‐1, myb52‐2, and adf9‐1 myb52‐2 seedlings. More than 24 cotyledon PCs from Col‐0, adf9‐1, myb52‐2, and adf9‐1 myb52‐2 were used. The given values are means ± SE. *P < 0.05, **P < 0.01, and ***P < 0.001 by Student's t‐test.
DISCUSSION
It has been reported that actin filaments play important roles in the morphogenesis of PC (Armour et al., 2015; Rosero et al., 2016). However, the mechanisms by which PC shapes are regulated by actin filaments remain largely unknown. In this study, we found that ADF9 localizes on both plasma membrane and actin filaments, and regulates the morphogenesis of PC by promoting the bundling of actin filaments. Moreover, the R2R3 MYB transcription factor MYB52 represses the expression of ADF9 and ADF9‐mediated actin filament bundling, thereby maintaining proper PC shape. Our results reveal a transcription regulation mechanism of ADF9 in the morphogenesis of PC.
ADF9 localizes to both plasma membrane and actin filaments
Investigating the precise subcellular localization of ADFs in Arabidopsis can provide critical insight into the mechanisms of actions of these proteins. However, due to the small molecular mass of the ADF protein, its function may alter when the GFP fluorescent protein tag fuses at either the N‐ or C‐terminal. In Arabidopsis, it has been reported that ADF1 binds to actin filaments in living onion peel cells through transient expression of the construction 35S::ADF1‐5×Gly Ala linker‐GFP (Dong and Hong, 2013), while ADF7 decorates actin cables in the pollen tube using an intramolecular GFP fusion strategy as previously reported (Okreglak and Drubin, 2007; Zheng et al., 2013). The precise subcellular localization of the other ADFs in Arabidopsis is still obscure, although their function has been reported. To investigate the mechanism by which ADF9 regulates PC shape, we attempted to analyze its precise subcellular localization in PCs. We generated the N‐ and C‐terminals of ADF9 fusion eGFP constructs, but the eGFP fluorescence signal could not be detected (data not shown). Then two intramolecular eGFP fusion constructs were created based on the analysis of the sequences of ADF9 and Cofilin (Figure S2).
Our findings revealed that the expression of pADF9::ADF9‐eGFPT7 in adf9‐1 seedlings led to a complete rescue of the PC shape phenotypes (Figure S2C, D), indicating the functionality of ADF9‐eGFPT7 and validating the credibility of ADF9's subcellular localization. In addition, we analyzed the sequence of ADF9 and found no transmembrane domain, suggesting that ADF9 may interact with membrane proteins and therefore is located on the membrane. However, the localization of ADF9 on the membrane and its relationship with PC shapes still need further study.
ADF9‐mediated bundling of actin filaments is required for morphogenesis of PCs
The roles of actin and ABPs in the morphogenesis of PCs are not well understood (Liu et al., 2021). In Arabidopsis, only two ABPs (ARP2/3 complex and FH1 formin) have been identified that are involved in the regulation of the morphogenesis of PCs (Li et al., 2003; Rosero et al., 2016). Arabidopsis ADF family proteins have diverse functions, such as hypocotyl elongation, tip growth, and response to biotic and abiotic stress (Clement et al., 2009; Tian et al., 2009; Zheng et al., 2013; Henty‐Ridilla et al., 2014; Inada et al., 2016; Zhao et al., 2016; Zhu et al., 2017; Qian et al., 2019). Among 11 ADFs, ADF5 and ADF9 evolve into actin bundling activity but lose their conserved severing and/or depolymerizing activities (Tholl et al., 2011; Nan et al., 2017). However, no ADFs have previously been identified to function in the morphogenesis of PCs. Here, we found that knocking out ADF9 resulted in defects in the formation of thick bundles and the bundling process in PCs, as observed through the dynamics of actin filament signals (Figure 4). This indicates that the actin bundling activity of ADF9 is important for its function in shaping PC. In the tip‐growing cells, such as root hair and pollen tube, the function of actin bundles is thought to provide molecular tracks for delivering vesicles containing wall precursors and wall loosening enzymes (Zheng et al., 2013; Armour et al., 2015). Development of PCs might involve a combination of tip growth and diffuse growth (Mathur, 2004). Our data showed that ADF9 localizes to actin filaments and plasma membrane and promotes the bundling of actin filaments. The possible mechanism of ADF9 positively regulating PC morphogenesis is that ADF9 promotes the formation of actin bundles in the PCs, provides more tracks for vesicle trafficking, and delivers vesicles to the plasma membrane of ADF9 localization. More evidence is still needed to confirm this hypothesis. On the other hand, we also noticed changes in the severing frequency, depolymerization rate, and elongation rate of actin filaments in adf9‐1 mutant. It is not clear why knocking out ADF9 resulted in these changes. Previous results have shown that the severing frequency and depolymerization frequency in the root hair of Villin1 (VLN1) mutant are increased, and the maximum filament length and maximum filament lifetime are decreased. The expression of VLN1 is inhibited by ADF7, and ADF7 inhibits the actin bundling activity of VLN1, resulting in the decrease of thick bundle formation but increase in the depolymerization frequency and turnover of actin filaments, therefore promoting the formation of root hair (Wang et al., 2020; Bi et al., 2022). Loss of ADF9 resulted in defects of actin bundles, more single actin filaments, and increased actin severing frequency and depolymerization rate; whether ADFs are involved in this process still needs to be investigated in future studies.
MYB52 directly regulates ADF9 in the morphogenesis of PCs
Transcriptional regulation is one of the key mechanisms of plant growth and development. However, the transcription factors involved in the regulation of ABPs‐mediated PC shapes have not been identified. R2R3 MYB transcription factor MYB52 negatively regulates pectin demethylesterification in the seed coat mucilage (Shi et al., 2018). MYB52 is also involved in drought tolerance and cell wall biosynthesis (Park et al., 2011). So far, the function of MYB52 in the morphogenesis of PCs is still unclear. In this study, we found that MYB52 regulates morphogenesis of PC and actin filament bundling through inhibiting ADF9 expression (Figure 9), revealing a regulation mechanism of MYB52 in PC shapes.
Figure 9.

Working model of MYELOBLASTOSIS52 (MYB52) and Actin depolymerizing factor9 (ADF9) in the morphogenesis of pavement cell in Arabidopsis
(A) In Columbia (Col‐0) plants, MYB52 directly suppresses the expression of ADF9, which leads to decreases in actin filament bundles, thereby properly controlling the morphogenesis of pavement cells (PCs). (B) In the adf9 mutant lines, loss of ADF9 resulted in a reduction of actin filament bundling, leading to suppression of PC morphogenesis. (C) In myb52‐2 plants, the expression of ADF9 was upregulated, which resulted in an increase of actin filament bundling, promoting the morphogenesis of PCs.
METHODS
Plant materials and growth conditions
In this study, all Arabidopsis plants are in the Col‐0 ecotype. The adf9‐1 (SALK_056064c) and myb52‐2 (SALK_118938) mutants were obtained from the Arabidopsis Biological Resource Center (ABRC), and both mutants were previously described (Burgos‐Rivera et al., 2008; Shi et al., 2018). The double mutant adf9‐1 myb52‐2 was generated by crossing adf9‐1 with myb52‐2. Another mutant of ADF9, referred to as adf9‐2, was generated using the CRISPR/Cas9 system (details of which are provided below). ADF9 and MYB52 OE lines were generated as described below. The primers used to identify homozygous lines are listed in Table S1. Seeds were sown on 1/2 MS medium with pH 5.8. Plants were grown at 22°C with a 16 h‐light/8 h‐dark cycle.
Generation of adf9‐2 mutant line using the CRISPR/Cas9 system in Arabidopsis
The egg cell‐specific promoter‐controlled CRISPR/Cas9 system was employed for the generation of ADF9 loss‐of‐function mutants (designated adf9‐2), as previously described (Wang et al., 2015). The pHEE401E vector was kindly provided by Prof. Qijun Chen (College of Biological Sciences, China Agricultural University). The plasmid pHEE401E‐ADF9 was constructed using primer pairs DT1‐BsF, DT1‐F0, DT2‐R0, and DT2‐BsR (Table S1). The designed single guide RNA (sgRNA) in pHEE401E vector was introduced into the Col‐0 plants. DNA was extracted from leaves of transgenic plants (T1), and the primer pair ADF9‐Cas9‐F/R (Table S1) were used to amplify the target sequence. The regions surrounding the target sites of ADF9 were sequenced to verify the mutation.
Construction of ADF9 and MYB52 related transgenic materials
To obtain ADF9 OE and complementation lines, we cloned a 1,519 bp fragment which contains ADF9 promoter and complementary DNA (cDNA) sequence from wild type genomic DNA using the pADF9‐ADF9‐F/R primers (Table S1). After sequencing, the sequence was reconstructed into the pPZP211 vector. The constructed vector was transformed into Col‐0 and adf9‐1 using Agrobacterium tumefaciens (strain GV3101) via the floral dip method (Clough and Bent, 1998). Homozygous lines were obtained through kanamycin selection. For the pADF9::GUS construct, a 1,357 bp fragment was cloned with the primers pADF9::GUS‐F/R (Table S1), which spans from 700 bp upstream of the translation start site to the second intron of ADF9 according to Ruzicka's report (2007). The cloned sequence was confirmed by sequencing and then was reconstructed into the pCAMBIA1300‐221 vector. The pCAMBIA1300‐221‐pADF9 plasmid was transformed into Col‐0 and myb52‐2 plants using Agrobacterium tumefaciens (GV3101).
MYB52‐OE was achieved by cloning the coding sequence (CDS) of MYB52, amplified using MYB52‐NdeI‐F and MYB52‐SacI‐R primers (Table S1), and cloned into the PUCHA vector. The PUCHA‐MYB52 was digested with PstI and SacI and then ligated into the pCAMBIA1300‐221 vector, resulting in the generation of pCAMBIA1300‐221‐HA‐MYB52. The pCAMBIA1300‐221‐HA‐MYB52 plasmid was transformed into Col‐0 using the Agrobacterium‐mediated floral dip method. Homozygous transgenic plants were selected using hygromycin.
Cotyledon phenotypes and PC shape analysis
Seedlings that grown on ½ MS medium for 7 d were chosen for analysis of cotyledon phenotypes and PC shapes. For cotyledon phenotype analysis, the cotyledons were collected, and the leaf area and the ratio of length to width were measured using ImageJ software. The seedlings were stained with propidium iodide and PCs were observed using a Nikon confocal laser scanning microscope employing 20× objective view and 514 nm excitation. The PCs at the apical third of the cotyledon were chosen for imaging. We captured images of a minimum of 100 PCs from 30 leaves. Measurement of the cell area, circularity, number of lobes, and average lobe length were performed using the PaCeQuant plugin in ImageJ (Möller et al., 2017). Statistical analysis was conducted using either analysis of variance (ANOVA) or t‐test in SPSS.
Plasmid construction for analyzing the subcellular localization of ADF9
We designed and generated several GFP constructs to investigate the subcellular localization of ADF9. Initially, we cloned the ADF9 CDS using specific primers and ligating it into two different vectors. For the PCM1205‐N‐GFP vector, we used the ADF9‐BamHI‐F and ADF9‐KpnI‐R primers to amplify the ADF9 CDS and subsequently ligated it into the PCM1205‐N‐GFP vector (Table S1), which resulted in the generation of PCM1205‐N‐GFP‐ADF9, where GFP was fused to the N‐terminus of ADF9. Similarly, we employed the ADF9‐XbaI‐F and ADF9‐KpnI‐R primers to amplify the ADF9 CDS and inserted it into the pSuper1300 vector (Table S1). This resulted in pSuper1300‐ADF9, where GFP was fused to the C‐terminus of ADF9.
Subsequently, we selected the insertion site for eGFP based on previously published methods for eGFP insertion (Okreglak and Drubin, 2007; Zheng et al., 2013). Briefly, we utilized the Alpha Fold Protein Structure Database online platform (https://www.alphafold.ebi.ac.uk/) to predict the structure of ADF9 (Jumper et al., 2021). Subsequently, the structure of ADF9 was analyzed using yeast cofilin as a template (PDB code 1CFY). This analysis was performed to reduce any potential errors in the predicted structure. Ultimately, eGFP was inserted after Thr7 (T7) or T13 of ADF9. The sequences of pADF9::ADF9 genomic DNA were inserted with eGFP after T7 or T13 were chemically synthesized and then cloned into pPZP211.
Subcellular localization assay
The actin filament marker line fABD2‐mCherry that was kindly provided by Prof. Jiejie Li (College of Life Science, Beijing Normal University) was crossed with ADF9‐eGFPT7/adf9‐1 to analyze the colocalization of ADF9 with actin filaments. Cotyledons of 4‐d‐old Arabidopsis seedlings were selected for observation. The images were taken with a Z‐stack using two channels simultaneously, and each layer was scanned at a thickness of 0.45 nm. A total of approximately 12–15 layers were scanned. To analyze the colocalization of ADF9 with the plasma membrane, 4‐d‐old ADF9‐eGFPT7/adf9‐1 seedlings were treated with 20 μmol/L FM4‐64 (Thermo Fisher Scientific, Waltham, Massachusetts, USA) for 5 min before observation. The images were performed with Z‐stack; each layer was scanned at a thickness of 0.45 nm. A total of approximately 12–15 layers were scanned.
RNA extraction and RT‐qPCR analysis
The total RNA from the leaves of 7‐d‐old seedlings was extracted using the Easy Pure Plant RNA kit (Transgene Products,TransGen, Beijing, China). Total cDNA was synthesized using the TransScipt One‐Step gDNA Removal and cDNA Synthesis SuperMix (Transgene Products). RT‐qPCR was performed using Roche LightCycler 480. All RT‐qPCR results are from at least three independent biological replicates, and 18S was used as an internal control. The primers used are listed in Table S1.
pADF9::GUS activity analysis
The histochemical GUS staining assay was performed using 7‐d‐old pADF9::GUS/Col‐0 and pADF9::GUS/myb52‐2 seedlings in a 37°C incubator for 12 h. The GUS staining solution containing 0.1 mol/L phosphate buffer (made from a mixture of 0.2 mol/L NaH2PO4 and 0.2 mol/L Na2HPO4 in a 14:36, v/v), 0.1 mol/L X‐gluc (dissolved in N′‐N′‐dimethylformamide), 2 mmol/L ethylenediaminetetraacetic acid, and 0.1% Triton X‐100. Subsequently, 70% ethanol plus 30% acetic acid solution were used for decolorization. The images were taken with a Nikon SMZ25 stereomicroscope.
Observation and quantitative analysis of actin arrays
To visualize the actin filaments, we introduced lifeact‐eGFP which was kindly provided by Prof. Deshu Lin (Basic Forestry and Proteomic Research Center, Fujian Agriculture and Forestry University). We crossed adf9‐1 and myb52‐2 with lifeact‐eGFP to generate adf9‐1 lifeact‐eGFP and myb52‐2 lifeact‐eGFP, respectively. The homozygotes were identified within the F2 population. Subsequently, the adf9‐1 myb52‐2 lifeact‐eGFP plants were generated by crossing adf9‐1 lifeact‐eGFP and myb52‐2 lifeact‐eGFP. Actin filaments in epidermal PCs were scanned using a Nikon laser scanning confocal microscope. The eGFP fluorescence was excited with a 488 nm laser. Gain, pinhole, laser power, and detector offset were the same in all images. Actin filaments were observed using a ×40 objective view, with each layer scanned at a thickness of 0.45 nm. A total of approximately 22–30 layers were scanned. The scanning results obtained from the confocal microscope were processed using the confocal microscope software version 4.6. To verify changes in actin arrays, the fluorescence skewness and density of actin filaments were estimated using previously reported methods (Li et al., 2012; Wu et al., 2015). The skewness and the percentage of occupancy were measured to indicate the extent of filament bundles and the density of actin filaments respectively. The experiment was repeated three times, with a minimum of 60 images selected each time, resulting in the analysis of at least 200 cells in total.
Time‐lapse imaging of signal actin filament dynamics
To visualize the dynamics of the single actin filament, PCs from 5‐d‐old seedlings of lifeact‐eGFP, adf9‐1 lifeact‐eGFP, myb52‐2 lifeact‐eGFP and adf9‐1myb52‐2 lifeact‐eGFP seedlings were selected for live cell imaging. Images were collected every 3 s using a spinning disk confocal microscope (Olympus, Shanghai, China) equipped with a Yokogawa CSU‐X1 spinning disk head. The instrument was operated with MetaMorph software (version 7.1, Molecular Devices). Gain, pinhole size, laser power, and detector offset settings were consistent in all images. eGFP was excited using a 488‐nm laser, and the emitted fluorescence was captured using a 525/50‐nm bandpass filter. To analyze the bundling and debundling frequency, a region about 20 μm2 was selected and the duration of observation was 5 min for analysis. The bundling and debundling frequencies were determined as the number of these events per unit area per unit time (events/μm2/s).
To quantify the dynamic parameters associated with single filament turnover, we analyzed several classical parameters (Staiger et al., 2009; Henty et al., 2011), including severing frequency (breaks/μm/s), depolymerization rate (μ/s), max filament length (μm), max filament lifetime (s), elongation rate (μm/s), bundling frequency, and debundling frequency. The descriptions and measurement methods for these parameters were determined and calculated roughly as previously described (Zheng et al., 2013). The dynamics of actin bundles within this region were tracked and analyzed continuously for a period of 5 min.
Electrophoretic mobility shift assays
The pGEX4T‐1‐MYB52 plasmid was kindly provided by Prof. Yingzhen Kong (College of Agronomy, Qingdao Agricultural University). The pGEX4T‐1‐MYB52 plasmid was introduced into the strain BL21 (DE3) and cultured at 37°C for 14–16 h. Expression of these recombinant proteins was induced by the adding of 0.5 mmol/L isopropyl β‐d‐thiogalactopyranoside (IPTG), followed by incubation at 16°C for 12–14 h. The GST‐tagged fusion protein was purified using glutathione‐sepharose resin (GE Amersham, Boston, Massachusetts, USA) as previously described (Shi et al., 2018; Ding et al., 2021). Probes for pADF9 (P1), pADF9 (P2), and pADF9 (P3) were generated by cloning specific regions using the primer pairs pADF9‐P1‐EMSA‐F/R, pADF9‐P2‐EMSA‐F/R, and pADF9‐P3‐EMSA‐F/R (Table S1). The purification of these probes followed the protocol provided by the Gel Extraction Kit (Omega, D2500‐02, Cambridge, UK). EMSAs were performed using the LightShift Chemiluminescent EMSA kit (catalog number 20148, Thermo Fisher Scientific) as per the manufacturer's instructions.
Chromatin immunoprecipitation
To conduct ChIP analysis, MYB52‐OE seedlings grown on ½ MS medium for 10 d were selected. The MYB52 protein was immunoprecipitated using HA antibodies. Following immunoprecipitation, DNA enrichment was carried out using specific primers designed for the ADF9 ChIP region. The primer sets used for DNA enrichment were ADF9‐ChIP‐P1‐F/R, ADF9‐ChIP‐P2‐F/R, and ADF9‐ChIP‐P3‐F/R (Table S1). ACT7‐ChIP‐F/R was the negative control and PMEI6‐ChIP‐F/R was the positive control (Table S1).
Yeast one‐hybrid assay
The shortened pADF9 fragments were cloned individually using the P1‐pA‐F/R, P2‐pA‐F/R, and P3‐pA‐F/R primers, resulting in the generation of pADF9‐P1, pADF9‐P2 and pADF9‐P3. Each of these fragments was then ligated into the pAbAi vector, resulting in the construction of pAbAi‐pADF9‐P1, pAbAi‐pADF9‐P2, and pAbAi‐pADF9‐P3. The MYB52 CDS was cloned using the MYB52‐AD‐F/R primers and inserted into the pGADT7 vector, to generate pGADT7‐MYB52. For binding analysis, pAbAi‐pADF9‐P1, pAbAi‐pADF9‐P2, and pAbAi‐pADF9‐P3 were transformed into the Y1H strain and cultured on synthetic dextrose (SD)/‐Ura medium supplemented with Aureobasidin A (AbA). The yeast was transformed using the yeast transformation kit (Coolaber). The Y1H strains containing either pGADT7‐MYB52 or pGADT7 (negative control) were transformed into the Y1H strains harboring pAbAi‐pADF9‐P1, pAbAi‐pADF9‐P2 and pAbAi‐pADF9‐P3. These transformed strains were cultured on SD/‐Leu medium supplemented with 125 ng/mL AbA.
Western blot assays
The cotyledons of transgenic seedlings grown on 1/2 MS medium for 7 d were used for western blot analysis. First, total proteins were extracted and analyzed by sodium dodecyl sulfate—polyacrylamide gel electrophoresis according to the previously described protocol (Liu et al., 2013). Plasma membrane and cytoplasmic proteins were isolated using the plant plasma membrane isolation kit (BB‐3155; BestBio, Shanghai, China). Anti‐GFP antibody (Sigma, Beijing, China) diluted 1:3,000 in Tris‐buffered saline with Tween 20 (50 mmol/L Tris, 150 mmol/L NaCl and 0.05% Tween 20 [v/v], pH 7.5) was used as primary antibody, followed by goat anti‐mouse immunoglobulin G/horseradish peroxidase secondary antibody (Solarbio, Beijing, China), which was diluted 1:10,000. These bands were detected with an ultrasensitive enhanced chemiluminescence kit (Abcam, Cambridge, UK), and the bands of Rubisco were used as protein loading controls.
Statistical analysis
Fluorescence intensity was measured using ImageJ software. Statistical analysis of relative expression of ADF9 and MYB52, and skewness and density were applied by independent sample t‐test (*P < 0.05, **P < 0.01, ***P < 0.001). For other statistics, one‐way analysis of variance (ANOVA) was conducted using SPSS software. Subsequently, a Tukey's post hoc test and least significant difference test were applied to determine significant differences. Significance was defined at a level of P < 0.05, and significant differences are indicated by distinct lowercase letters.
Accession numbers
The following are the Arabidopsis Information Resource accession numbers used in this study: ADF9 (AT4G34970), MYB52 (AT1G17950), PMEI6 (AT2G47670), and ACT7 (AT5G09810).
CONFLICTS OF INTEREST
The authors declare no conflict of interest.
AUTHOR CONTRIBUTIONS
T.Q., Y.S., X.Z., N.G., and P.J. performed the research, T.Q., T.M., and X.W. analyzed the data, and T.Q. and X.W. wrote the paper. X.W. designed the experiments, supervised the study, and revised the manuscript. All authors read and approved of its content.
Supporting information
Additional Supporting Information may be found online in the supporting information tab for this article: http://onlinelibrary.wiley.com/doi/10.1111/jipb.13762/suppinfo
Supplemental Movie Legends
Movie S1. Time‐series movie showing the severing events and depolymerization rate of a single filament in a Columbia (Col‐0) pavement cell
Movie S2. Time‐series movie showing the severing events and depolymerization rate of a single filament in an actin depolymerizing factor9‐1 (adf9‐1) pavement cell
Movie S3. Time‐series movie showing the severing events and depolymerization rate of single filament in an ACTIN DEPOLYMERIZING FACTOR9‐complementation (ADF9‐COM) #5 pavement cell
Movie S4. Time‐series movie showing the formation of a thick bundle in a Columbia (Col‐0) pavement cell
Movie S5. Time‐series movie showing the debundling event of a thick bundle in a Columbia (Col‐0) pavement cell
ACKNOWLEDGEMENTS
We thank Prof. Yingzhen Kong (Chinese Academy of Agricultural Sciences) for generously providing the plasmid of pGEX4T‐1‐MYB52, Prof. Shucai Wang (Linyi University) for providing the PUCHA, pPZP211 and pPZP211‐GFP vectors, Prof. Qijun Chen (China Agricultural University) for providing the pHEE4401E vector, Prof. Deshu Lin (Fujian Agriculture and Forestry University) for providing the seeds of lifeact‐eGFP, and Prof. Shanjin Huang (Tsinghua University), and Prof. Jiejie Li (Beijing Normal University) for providing helpful comments on the article. The research was supported by National Natural Science Foundation of China (31970661 and 32370736), Liaoning Education Foundation (JYTQN2024007) and Young and Middle‐aged Science and Technology Innovation Talent Support Program of Shenyang (RC220273).
Biographies


Qiu, T. , Su, Y. , Guo, N. , Zhang, X. , Jia, P. , Mao, T. , and Wang, X. (2024). MYB52 negatively regulates ADF9‐meditated actin filament bundling in Arabidopsis pavement cell morphogenesis. J. Integr. Plant Biol. 66: 2379–2394.
Edited by: Haiyun Ren, Beijing Normal University, China
REFERENCES
- Altartouri, B. , Bidhendi, A.J. , Tani, T. , Suzuki, J. , Conrad, C. , Chebli, Y. , Liu, N. , Karunakaran, C. , Scarcelli, G. , and Geitmann, A. (2019). Pectin chemistry and cellulose crystallinity govern pavement cell morphogenesis in a multi‐step mechanism. Plant Physiol. 181: 127–141. [DOI] [PMC free article] [PubMed] [Google Scholar]
- Andrianantoandro, E. , and Pollard, T.D. (2006). Mechanism of actin filament turnover by severing and nucleation at different concentrations of ADF/cofilin. Mol. Cell 24: 13–23. [DOI] [PubMed] [Google Scholar]
- Armour, W.J. , Barton, D.A. , Law, A.M.K. , and Overall, R.L. (2015). Differential growth in periclinal and anticlinal walls during lobe formation in Arabidopsis cotyledon pavement cells. Plant Cell 27: 2484–2500. [DOI] [PMC free article] [PubMed] [Google Scholar]
- Belteton, S.A. , Li, W. , Yanagisawa, M. , Hatam, F.A. , Quinn, M.I. , Szymanski, M.K. , Marley, M.W. , Turner, J.A. , and Szymanski, D.B. (2021). Real‐time conversion of tissue‐scale mechanical forces into an interdigitated growth pattern. Nat Plants 7: 826–841. [DOI] [PubMed] [Google Scholar]
- Bi, S. , Li, M. , Liu, C. , Liu, X. , Cheng, J. , Wang, L. , Wang, J. , Lv, Y. , He, M. , Cheng, X. , et al. (2022). Actin depolymerizing factor ADF7 inhibits actin bundling protein VILLIN1 to regulate root hair formation in response to osmotic stress in Arabidopsis. PLoS Genet. 18: e1010338. [DOI] [PMC free article] [PubMed] [Google Scholar]
- Bou Daher, F. , Van Oostende, C. , and Geitmann, A. (2011). Spatial and temporal expression of actin depolymerizing factors ADF7 and ADF10 during male gametophyte development in Arabidopsis thaliana . Plant Cell Physiol. 52: 1177–1192. [DOI] [PubMed] [Google Scholar]
- Burgos‐Rivera, B. , Ruzicka, D.R. , Deal, R.B. , McKinney, E.C. , King‐Reid, L. , and Meagher, R.B. (2008). ACTIN DEPOLYMERIZING FACTOR9 controls development and gene expression in Arabidopsis. Plant Mol. Biol. 68: 619–632. [DOI] [PMC free article] [PubMed] [Google Scholar]
- Chen, B. , Dang, X. , Bai, W. , Liu, M. , Li, Y. , Zhu, L. , Yang, Y. , Yu, P. , Ren, H. , Huang, D. , et al. (2022). The ipga1‐angustifolia module regulates microtubule organisation and pavement cell shape in Arabidopsis. New Phytol. 236: 1310–1325. [DOI] [PubMed] [Google Scholar]
- Clement, M. , Ketelaar, T. , Rodiuc, N. , Banora, M.Y. , Smertenko, A. , Engler, G. , Abad, P. , Hussey, P.J. , and de Almeida Engler, J. (2009). Actin‐depolymerizing factor2‐mediated actin dynamics are essential for root‐knot nematode infection of Arabidopsis. Plant Cell 21: 2963–2979. [DOI] [PMC free article] [PubMed] [Google Scholar]
- Clough, S.J. , and Bent, A.F. (1998). Floral dip: A simplified method for Agrobacterium‐mediated transformation of Arabidopsis thaliana . Plant J. 16: 735–743. [DOI] [PubMed] [Google Scholar]
- Ding, A. , Tang, X. , Yang, D. , Wang, M. , Ren, A. , Xu, Z. , Hu, R. , Zhou, G. , O'Neill, M. , and Kong, Y. (2021). ERF4 and MYB52 transcription factors play antagonistic roles in regulating homogalacturonan de‐methylesterification in Arabidopsis seed coat mucilage. Plant Cell 33: 381–403. [DOI] [PMC free article] [PubMed] [Google Scholar]
- Dong, C.‐H. , and Hong, Y. (2013). Arabidopsis CDPK6 phosphorylates ADF1 at N‐terminal serine 6 predominantly. Plant Cell Rep. 32: 1715–1728. [DOI] [PubMed] [Google Scholar]
- Dubos, C. , Stracke, R. , Grotewold, E. , Weisshaar, B. , Martin, C. , and Lepiniec, L. (2010). MYB transcription factors in Arabidopsis. Trends Plant Sci. 15: 573–581. [DOI] [PubMed] [Google Scholar]
- Franco‐Zorrilla, J.M. , López‐Vidriero, I. , Carrasco, J.L. , Godoy, M. , Vera, P. , and Solano, R. (2014). DNA‐binding specificities of plant transcription factors and their potential to define target genes. Proc. Natl. Acad. Sci. U.S.A. 111: 2367–2372. [DOI] [PMC free article] [PubMed] [Google Scholar]
- Fu, Y. (2002). The ROP2 GTPase controls the formation of cortical fine F‐actin and the early phase of directional cell expansion during Arabidopsis organogenesis. Plant Cell 14: 777–794. [DOI] [PMC free article] [PubMed] [Google Scholar]
- Fu, Y. , Gu, Y. , Zheng, Z. , Wasteneys, G. , and Yang, Z. (2005). Arabidopsis interdigitating cell growth requires two antagonistic pathways with opposing action on cell morphogenesis. Cell 120: 687–700. [DOI] [PubMed] [Google Scholar]
- Gao, X. , Yang, B. , Zhang, J. , Wang, C. , Ren, H. , Fu, Y. , and Yang, Z. (2023). PRL1 negatively regulates Rho GTPase‐independent and—dependent signaling pathways maintaining actin microfilament dynamic for pavement cell morphogenesis. bioRxiv. 10.1101/2023.02.28.530536 [DOI] [Google Scholar]
- Haas, K.T. , Wightman, R. , Meyerowitz, E.M. , and Peaucelle, A. (2020). Pectin homogalacturonan nanofilament expansion drives morphogenesis in plant epidermal cells. Science 367: 1003–1007. [DOI] [PMC free article] [PubMed] [Google Scholar]
- Henty, J.L. , Bledsoe, S.W. , Khurana, P. , Meagher, R.B. , Day, B. , Blanchoin, L. , and Staiger, C.J. (2011). Arabidopsis actin depolymerizing factor4 modulates the stochastic dynamic behavior of actin filaments in the cortical array of epidermal cells. Plant Cell 23: 3711–3726. [DOI] [PMC free article] [PubMed] [Google Scholar]
- Henty‐Ridilla, J.L. , Li, J. , Day, B. , and Staiger, C.J. (2014). ACTIN DEPOLYMERIZING FACTOR4 regulates actin dynamics during innate immune signaling in Arabidopsis. Plant Cell 26: 340–352. [DOI] [PMC free article] [PubMed] [Google Scholar]
- Inada, N. , Higaki, T. , and Hasezawa, S. (2016). Nuclear function of subclass I actin depolymerizing factor contributes to susceptibility in Arabidopsis to an adapted powdery mildew fungus. Plant Physiol. 170: 1420–1434. [DOI] [PMC free article] [PubMed] [Google Scholar]
- Jiang, C.‐K. , and Rao, G.‐Y. (2020). Insights into the diversification and evolution of R2R3‐MYB transcription factors in plants. Plant Physiol. 183: 637–655. [DOI] [PMC free article] [PubMed] [Google Scholar]
- Jumper, J. , Evans, R. , Pritzel, A. , Green, T. , Figurnov, M. , Ronneberger, O. , Tunyasuvunakool, K. , Bates, R. , Žídek, A. , Potapenko, A. , et al. (2021). Highly accurate protein structure prediction with AlphaFold. Nature 596: 583–589. [DOI] [PMC free article] [PubMed] [Google Scholar]
- Ko, J. , Kim, W. , and Han, K. (2009). Ectopic expression of MYB46 identifies transcriptional regulatory genes involved in secondary wall biosynthesis in Arabidopsis. Plant J. 60: 649–665. [DOI] [PubMed] [Google Scholar]
- Labusch, C. , Shishova, M. , Effendi, Y. , Li, M. , Wang, X. , and Scherer, G.F. (2013). Patterns and timing in expression of early auxin‐induced genes imply involvement of phospholipases A (pPLAs) in the regulation of auxin responses. Mol. Plant 6: 1473–1486. [DOI] [PubMed] [Google Scholar]
- Li, J. , Henty‐Ridilla, J.L. , Huang, S. , Wang, X. , Blanchoin, L. , and Staiger, C.J. (2012). Capping protein modulates the dynamic behavior of actin filaments in response to phosphatidic acid in Arabidopsis. Plant Cell 24: 3742–3754. [DOI] [PMC free article] [PubMed] [Google Scholar]
- Li, S. , Blanchoin, L. , Yang, Z. , and Lord, E.M. (2003). The putative Arabidopsis arp2/3 complex controls leaf cell morphogenesis. Plant Physiol. 132: 2034–2044. [DOI] [PMC free article] [PubMed] [Google Scholar]
- Liang, H. , Zhang, Y. , Martinez, P. , Rasmussen, C.G. , Xu, T. , and Yang, Z. (2018). The microtubule‐associated protein IQ67 DOMAIN5 modulates microtubule dynamics and pavement cell shape. Plant Physiol. 177: 1555–1568. [DOI] [PMC free article] [PubMed] [Google Scholar]
- Liu, S. , Jobert, F. , Rahneshan, Z. , Doyle, S.M. , and Robert, S. (2021). Solving the puzzle of shape regulation in plant epidermal pavement cells. Annu. Rev. Plant Biol. 72: 525–550. [DOI] [PubMed] [Google Scholar]
- Liu, X. , Qin, T. , Ma, Q. , Sun, J. , Liu, Z. , Yuan, M. , and Mao, T. (2013). Light‐regulated hypocotyl elongation involves proteasome‐dependent degradation of the microtubule regulatory protein WDL3 in Arabidopsis. Plant Cell 25: 1740–1755. [DOI] [PMC free article] [PubMed] [Google Scholar]
- Mathur, J. (2004). Cell shape development in plants. Trends Plant Sci. 9: 583–590. [DOI] [PubMed] [Google Scholar]
- Möller, B. , Poeschl, Y. , Plötner, R. , and Bürstenbinder, K. (2017). PaCeQuant: A tool for high‐throughput quantification of pavement cell shape characteristics. Plant Physiol. 175: 998–1017. [DOI] [PMC free article] [PubMed] [Google Scholar]
- Nagawa, S. , Xu, T. , and Yang, Z. (2010). RHO GTPase in plants: Conservation and invention of regulators and effectors. Small GTPases 1: 78–88. [DOI] [PMC free article] [PubMed] [Google Scholar]
- Nan, Q. , Qian, D. , Niu, Y. , He, Y. , Tong, S. , Niu, Z. , Ma, J. , Yang, Y. , An, L. , Wan, D. , et al. (2017). Plant actin‐depolymerizing factors possess opposing biochemical properties arising from key amino acid changes throughout evolution. Plant Cell 29: 395–408. [DOI] [PMC free article] [PubMed] [Google Scholar]
- Okreglak, V. , and Drubin, D.G. (2007). Cofilin recruitment and function during actin‐mediated endocytosis dictated by actin nucleotide state. J. Cell Biol. 178: 1251–1264. [DOI] [PMC free article] [PubMed] [Google Scholar]
- Panteris, E. , and Galatis, B. (2005). The morphogenesis of lobed plant cells in the mesophyll and epidermis: Organization and distinct roles of cortical microtubules and actin filaments: Research review. New Phytol. 167: 721–732. [DOI] [PubMed] [Google Scholar]
- Park, M.Y. , Kang, J. , and Kim, S.Y. (2011). Overexpression of AtMYB52 confers ABA hypersensitivity and drought tolerance. Mol. Cells 31: 447–454. [DOI] [PMC free article] [PubMed] [Google Scholar]
- Qian, D. , Zhang, Z. , He, J. , Zhang, P. , Ou, X. , Li, T. , Niu, L. , Nan, Q. , Niu, Y. , He, W. , et al. (2019). Arabidopsis ADF5 promotes stomatal closure by regulating actin cytoskeleton remodeling in response to ABA and drought stress. J. Exp. Bot. 70: 435–446. [DOI] [PMC free article] [PubMed] [Google Scholar]
- Rosero, A. , Oulehlová, D. , Stillerová, L. , Schiebertová, P. , Grunt, M. , Žárský, V. , and Cvrčková, F. (2016). Arabidopsis FH1 formin affects cotyledon pavement cell shape by modulating cytoskeleton dynamics. Plant Cell Physiol. 57: 488–504. [DOI] [PubMed] [Google Scholar]
- Ruzicka, D.R. , Kandasamy, M.K. , McKinney, E.C. , Burgos‐Rivera, B. , and Meagher, R.B. (2007). The ancient subclasses of Arabidopsis ACTIN DEPOLYMERIZING FACTOR genes exhibit novel and differential expression. Plant J. 52: 460–472. [DOI] [PubMed] [Google Scholar]
- Sapala, A. , Runions, A. , Routier‐Kierzkowska, A.‐L. , Das Gupta, M. , Hong, L. , Hofhuis, H. , Verger, S. , Mosca, G. , Li, C.‐B. , Hay, A. , et al. (2018). Why plants make puzzle cells, and how their shape emerges. eLife 7: e32794. [DOI] [PMC free article] [PubMed] [Google Scholar]
- Sapala, A. , Runions, A. , and Smith, R.S. (2019). Mechanics, geometry and genetics of epidermal cell shape regulation: Different pieces of the same puzzle. Curr. Opin. Plant Biol. 47: 1–8. [DOI] [PubMed] [Google Scholar]
- Shi, D. , Ren, A. , Tang, X. , Qi, G. , Xu, Z. , Chai, G. , Hu, R. , Zhou, G. , and Kong, Y. (2018). MYB52 negatively regulates pectin demethylesterification in seed coat mucilage. Plant Physiol. 176: 2737–2749. [DOI] [PMC free article] [PubMed] [Google Scholar]
- Staiger, C.J. , Sheahan, M.B. , Khurana, P. , Wang, X. , McCurdy, D.W. , and Blanchoin, L. (2009). Actin filament dynamics are dominated by rapid growth and severing activity in the Arabidopsis cortical array. J. Cell Biol. 184: 269–280. [DOI] [PMC free article] [PubMed] [Google Scholar]
- Szymanski, D. , and Staiger, C.J. (2018). The actin cytoskeleton: Functional arrays for cytoplasmic organization and cell shape control. Plant Physiol. 176: 106–118. [DOI] [PMC free article] [PubMed] [Google Scholar]
- Tholl, S. , Moreau, F. , Hoffmann, C. , Arumugam, K. , Dieterle, M. , Moes, D. , Neumann, K. , Steinmetz, A. , and Thomas, C. (2011). Arabidopsis actin‐depolymerizing factors (ADFs) 1 and 9 display antagonist activities. FEBS Lett. 585: 1821–1827. [DOI] [PubMed] [Google Scholar]
- Tian, M. , Chaudhry, F. , Ruzicka, D.R. , Meagher, R.B. , Staiger, C.J. , and Day, B. (2009). Arabidopsis actin‐depolymerizing factor AtADF4 mediates defense signal transduction triggered by the pseudomonas syringae effector AvrPphB. Plant Physiol. 150: 815–824. [DOI] [PMC free article] [PubMed] [Google Scholar]
- Wang, X. , Bi, S. , Wang, L. , Li, H. , Gao, B. , Huang, S. , Qu, X. , Cheng, J. , Wang, S. , Liu, C. , et al. (2020). GLABRA2 regulates actin bundling protein VILLIN1 in root hair growth in response to osmotic stress. Plant Physiol. 184: 176–193. [DOI] [PMC free article] [PubMed] [Google Scholar]
- Wang, Z. , Xing, H. , Dong, L. , Zhang, H. , Han, C. , Wang, X. , and Chen, Q. (2015). Egg cell‐specific promoter‐controlled CRISPR/Cas9 efficiently generates homozygous mutants for multiple target genes in Arabidopsis in a single generation. Genome Biol. 16: 144. [DOI] [PMC free article] [PubMed] [Google Scholar]
- Wu, S. , Xie, Y. , Zhang, J. , Ren, Y. , Zhang, X. , Wang, J. , Guo, X. , Wu, F. , Sheng, P. , Wang, J. , et al. (2015). VLN2 regulates plant architecture by affecting microfilament dynamics and polar auxin transport in Rice. Plant Cell 27: 2829–2845. [DOI] [PMC free article] [PubMed] [Google Scholar]
- Xu, T. , Dai, N. , Chen, J. , Nagawa, S. , Cao, M. , Li, H. , Zhou, Z. , Chen, X. , De Rycke, R. , Rakusová, H. , et al. (2014). Cell surface ABP1‐TMK auxin‐sensing complex activates ROP GTPase signaling. Science 343: 1025–1028. [DOI] [PMC free article] [PubMed] [Google Scholar]
- Xu, T. , Wen, M. , Nagawa, S. , Fu, Y. , Chen, J.‐G. , Wu, M.‐J. , Perrot‐Rechenmann, C. , Friml, J. , Jones, A.M. , and Yang, Z. (2010). Cell surface‐ and Rho GTPase‐based auxin signaling controls cellular interdigitation in Arabidopsis. Cell 143: 99–110. [DOI] [PMC free article] [PubMed] [Google Scholar]
- Zhang, C. , Halsey, L.E. , and Szymanski, D.B. (2011). The development and geometry of shape change in Arabidopsis thaliana cotyledon pavement cells. BMC Plant Biol. 11: 27. [DOI] [PMC free article] [PubMed] [Google Scholar]
- Zhao, S. , Jiang, Y. , Zhao, Y. , Huang, S. , Yuan, M. , Zhao, Y. , and Guo, Y. (2016). CASEIN KINASE1‐LIKE PROTEIN2 regulates actin filament stability and stomatal closure via phosphorylation of actin depolymerizing factor. Plant Cell 28: 1422–1439. [DOI] [PMC free article] [PubMed] [Google Scholar]
- Zheng, Y. , Xie, Y. , Jiang, Y. , Qu, X. , and Huang, S. (2013). Arabidopsis ACTIN‐DEPOLYMERIZING FACTOR7 severs actin filaments and regulates actin cable turnover to promote normal pollen tube growth. Plant Cell 25: 3405–3423. [DOI] [PMC free article] [PubMed] [Google Scholar]
- Zhu, J. , Nan, Q. , Qin, T. , Qian, D. , Mao, T. , Yuan, S. , Wu, X. , Niu, Y. , Bai, Q. , An, L. , et al. (2017). Higher‐ordered actin structures remodeled by Arabidopsis ACTIN‐DEPOLYMERIZING FACTOR5 are important for pollen germination and pollen tube growth. Mol. Plant 10: 1065–1081. [DOI] [PubMed] [Google Scholar]
Associated Data
This section collects any data citations, data availability statements, or supplementary materials included in this article.
Supplementary Materials
Additional Supporting Information may be found online in the supporting information tab for this article: http://onlinelibrary.wiley.com/doi/10.1111/jipb.13762/suppinfo
Supplemental Movie Legends
Movie S1. Time‐series movie showing the severing events and depolymerization rate of a single filament in a Columbia (Col‐0) pavement cell
Movie S2. Time‐series movie showing the severing events and depolymerization rate of a single filament in an actin depolymerizing factor9‐1 (adf9‐1) pavement cell
Movie S3. Time‐series movie showing the severing events and depolymerization rate of single filament in an ACTIN DEPOLYMERIZING FACTOR9‐complementation (ADF9‐COM) #5 pavement cell
Movie S4. Time‐series movie showing the formation of a thick bundle in a Columbia (Col‐0) pavement cell
Movie S5. Time‐series movie showing the debundling event of a thick bundle in a Columbia (Col‐0) pavement cell