

Abstract
Background.
Household transmission studies inform how viruses spread among close contacts, but few characterize household transmission of endemic coronaviruses.
Methods.
We used data collected from 223 households with school-age children participating in weekly disease surveillance over 2 respiratory virus seasons (December 2015 to May 2017), to describe clinical characteristics of endemic human coronaviruses (HCoV-229E, HcoV-HKU1, HcoV-NL63, HcoV-OC43) infections, and community and household transmission probabilities using a chain-binomial model correcting for missing data from untested households.
Results.
Among 947 participants in 223 households, we observed 121 infections during the study, most commonly subtype HCoV-OC43. Higher proportions of infected children (<19 years) displayed influenza-like illness symptoms than infected adults (relative risk, 3.0; 95% credible interval [CrI], 1.5–6.9). The estimated weekly household transmission probability was 9% (95% CrI, 6–13) and weekly community acquisition probability was 7% (95% CrI, 5–10). We found no evidence for differences in community or household transmission probabilities by age or symptom status. Simulations suggest that our study was underpowered to detect such differences.
Conclusions.
Our study highlights the need for large household studies to inform household transmission, the challenges in estimating household transmission probabilities from asymptomatic individuals, and implications for controlling endemic CoVs.
Keywords: children, coronaviruses, household, transmission
The seasonal, endemic human coronaviruses ([HCoVs] consisting of HCoV-229E, HCoV-NL63, HCoV-HKU1, and HCoV-OC43) are pervasive causes of respiratory illness. On average, individuals are infected by their first HCoV by age 5 and have evidence of infection with all 4 strains by age 20 [1]. Individuals are reinfected throughout their lifetime, as observed in longitudinal seroprevalence and virological studies [2].
Quantitative characterizations of transmission and risk factors for endemic HCoV are of interest now given the severe acute respiratory syndrome coronavirus 2 (SARS-CoV-2) pandemic. Comparing the epidemiology of endemic HCoV to SARS-CoV-2 may help disentangle the roles of pathogens, interventions, and population immunity in this pandemic. Understanding the current epidemiology of endemic HCoV can provide context for SARS-COV-2 as a future endemic human pathogen [3, 4].
Household studies examine the acquisition and transmission of HCoV given the presumed exposure of all household members to any infected member. Investigators can identify epidemiological factors associated with secondary household infections and characterize their spectrum of clinical severity [5]. Household studies can also identify risk factors for infection and transmission such as age [6], symptoms [7], and type of exposure [8]. However, identifying households where the index case is asymptomatic requires costly active surveillance.
We present characteristics of 223 households followed in Allegheny County, Pennsylvania, between 2015 and 2017, experiencing 121 reverse-transcriptase polymerase chain reaction (RT-PCR)-confirmed seasonal coronavirus infections. We describe age-specific attack rates, symptom frequency by age, and risk of transmission to household contacts.
METHODS
Recruitment and Follow-up
The Surveillance Monitoring of Absenteeism and Respiratory Transmission (SMART2) is a school-based study aimed at understanding the transmission of influenza and other respiratory viruses among school-aged children (5 to 19 years) and their communities in Allegheny County, Pennsylvania between December 2015 and May 2017 [9]. Consenting students from 9 kindergarten through grade 12 (K–12) schools in 3 Allegheny County districts (School Districts A–C) were prospectively followed over 2 periods (year 1, December 2015 to May 2016; and year 2, December 2016 to April 2017) for school absences related to influenza-like illness (ILI), defined as fever (>37.8°C) and either cough or sore throat.
Households were invited to participate in weekly respiratory disease surveillance during the 2 periods. Household eligibility included having at least 1 child enrolled at a participating school of the school-based study. Participant eligibility included being a parent or a household member over 18 years old providing consent, or a household member under 18 years old providing assent. Upon enrollment, heads of households (ie, parents, guardians, or members 18 years and older) completed demographic surveys (ie, number of household members, relationships, school enrollment, and grade levels). All eligible household members were surveyed on baseline demographics, including age, sex, current smoking status, and asthma. Self-reported influenza vaccination status was assessed at the end of each study year.
Households participating the first year were invited to participate in weekly surveillance in the second year, and additional households were invited to participate in the second year of the study. After the first year, school district C ended its study participation and additional eligible households from school districts A and B were invited to participate (Figure 1). We followed 164 households prospectively for the presence of ILI for 22 weeks in the first year (December 2015–April 2016) and 163 households for 16 weeks in the second year (January 2017–May 2017). In total, 947 individuals from 223 unique households were enrolled and followed. Heads of households completed weekly web-based surveys to report any symptoms experienced by household members that week and symptom onset dates. Self-reported symptoms were fever, cough, sore throat, headache, runny nose and congestion, muscle or joint pain, and nausea, vomiting or diarrhea. Households reporting an ILI event, regardless of other reported symptoms, were mailed self-administered nasal swab kits within an average of 3 days from reporting. Regardless of symptoms, all household members were asked to self-swab or receive caregiver-assisted swabbing, record the swabbing date, and return kits to study staff as quickly as possible.
Figure 1.
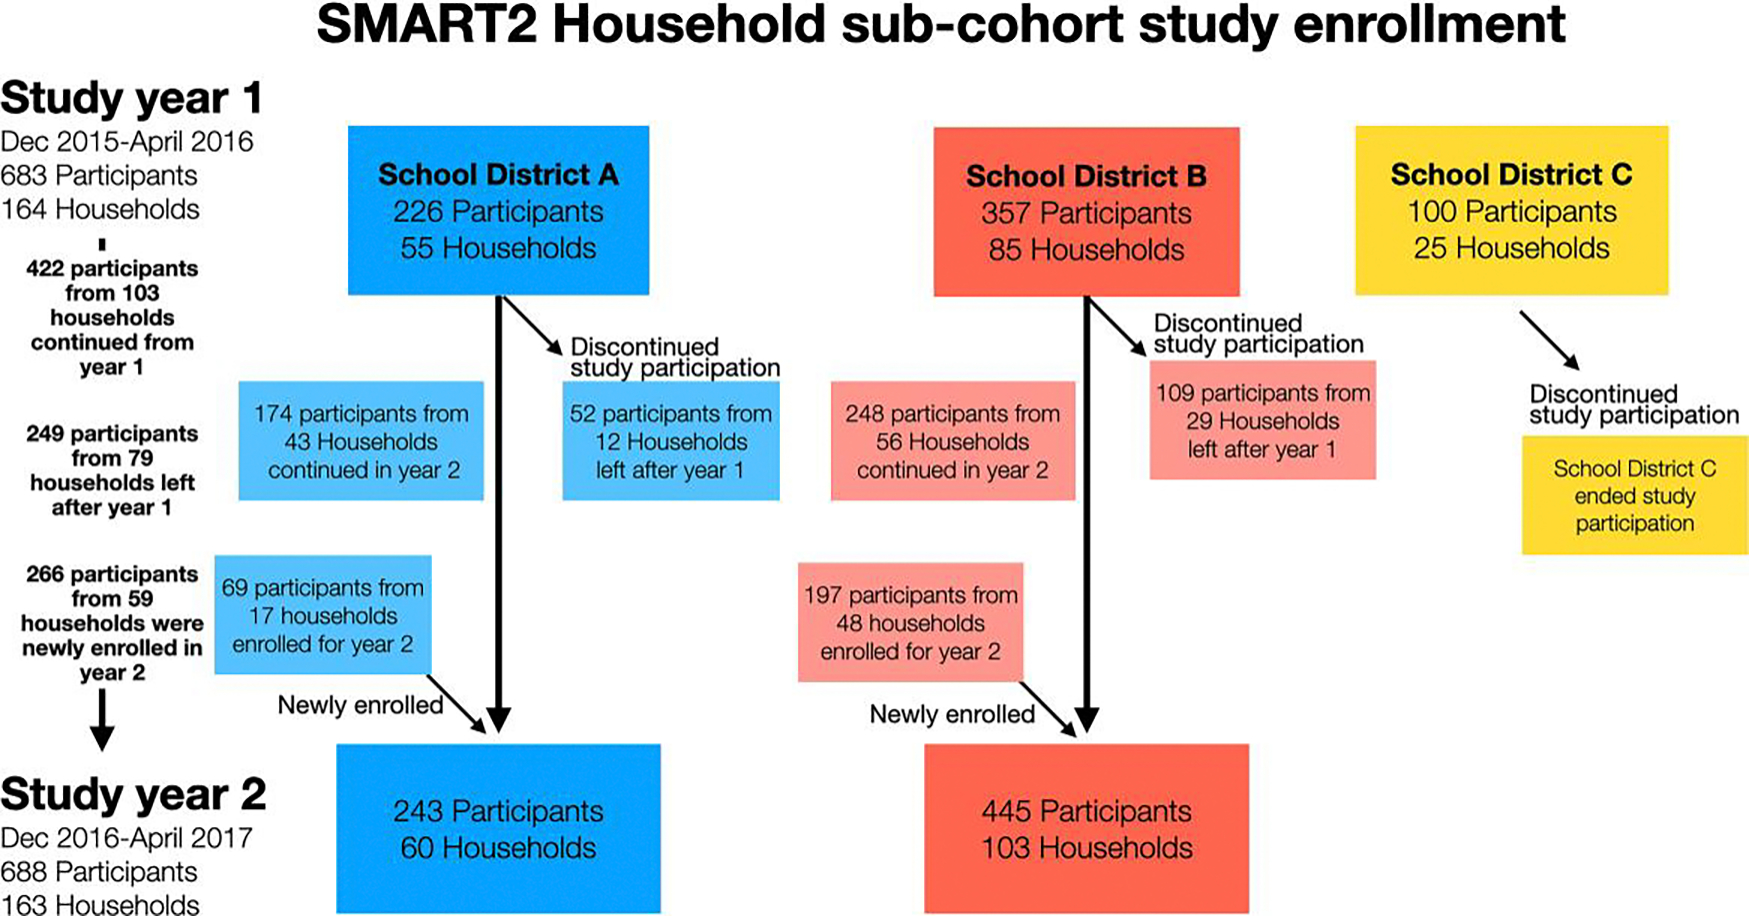
Surveillance Monitoring of Absenteeism and Respiratory Transmission (SMART2) household subcohort enrollment. School district C ended study participation after the first study year. Colors reflect different school districts participating in the study. Arrows indicate movement of participants into and out of the study during year 1 and year 2.
Laboratory Methods
Nasal swabs returned were stored in sterile transport media at 4°C and tested at the University of Pittsburgh Medical Center’s Clinical Virology Laboratory. Swabs were tested using a multiplex RT-PCR respiratory panel Genmarks RVP-RUO panel (Genmark Diagnostics, Carlsbad, CA) on the eSensor Xt-8 instrument (Luminex, Austin, TX). Specimens were tested for respiratory pathogens, including 4 human coronavirus subtypes (HCoV 229E, NL63, HKU1, and OC43). A sample with a quantitative threshold ([Qt] a quantitative value in nanoamps) value of 2 or higher was considered positive. For coronaviruses, the Genmark RVP platform is estimated to have high positive (87.7%; 81.2%–92.2%) and negative (100%; 98.8%–100%) percent agreements with a reference platform [10].
Outcome Measures
We defined a confirmed HCoV infection as an individual whose sample tested positive for human coronavirus by RT-PCR. Symptomatic infections were defined as individuals with RT-PCR-confirmed infection who self-reported any symptoms the week before and/or after sample collection, encompassing symptomatic and presymptomatic individuals. Asymptomatic infections were individuals whose swab samples tested positive for any HCoV infection by RT-PCR but reported no symptoms at the time of household survey, or the weeks before or after their sample collection.
Statistical Analysis
We report the proportion of HCoV infections by demographic and clinical characteristics. Age groups were defined as young children (<5 years), children (5–9 years), adolescents (10–19 years), adults (20–49 years), and older adults (50 years and older). We reported continuous variables as the median (interquartile range [IQR]), and categorical variables as percentages (%). We calculate household secondary attack rate (SAR) in households with at least 1 HCoV case as the number of HCoV infections minus 1 divided by household size minus 1. Exact binomial 95% confidence intervals (95% CIs) are reported for proportions.
Transmission Models
We quantified community and household coronavirus transmission during the study period using a chain-binomial model within a Bayesian framework. We modified the classical final-size approach [11] by assuming only 1 generation of within-household transmission per household-week. In this model, we use data on the infections reported in the household in 1 week rather than timing of infections, meaning there is no defined index case. Each household member is assumed susceptible at the beginning of the season and has a probability αys of acquiring HCoV infection of strain s in study season y from outside the household (ie, the community) in each calendar week. An infected household member has probability β of infecting a susceptible household member within the same week. Infected individuals have probability ps of developing any symptoms, and those developing symptoms have probability pILI of having ILI symptoms. We considered models where each of these parameters (α, β, ps, and pILI) varied by age, with separate β terms for those with and without symptoms. Supplementary Table S1 lists the model parameters, and Supplementary Table S2 describes the observed data.
We account for the 4 HCoV strains by assuming that individuals infected with one strain can only transmit that strain to susceptible individuals within the household. We maximize the sum of all 4 strain-specific log-likelihoods.
Swabbing for virologic testing was performed only in households that reported ≥1 member with ILI symptoms each week, meaning that swabbed households represent a biased sample of all households. To correct for missing data from unswabbed household-weeks, we used data on the proportion of swabbed households and distribution of non-HCoV infections with ILI within swabbed households [12]. We derived the likelihood (Supplementary Methods) for swabbed and unswabbed household-weeks under 2 assumptions: (1) individuals acquire non-HCoV infection with ILI symptoms with probability pNC and intra-household correlation parameter γ, as ILI infections are clustered within households; and (2) individuals with ILI symptoms report those symptoms with probability pr. We assume a strong prior for pr, namely, a beta distribution with mean 0.8 and variance 4 × 10⁻⁴ based on sensitivity analyses and high rate of weekly symptom reports, and we simulate the robustness of the estimated parameters to the value of pr. We perform sensitivity analyses in which we assume different prior distributions for pr and in which community acquisition of HCoV is clustered by household, following a beta-binomial distribution with probability α and intrahousehold correlation parameter γCoV.We used rstan package v2.19.2 in R to estimate posterior distributions. For each model, we ran 2000 iterations for 4 chains, with a burn-in of 1000 samples, for a total of 4000 draws from the posterior. We report the estimated median parameters and 95% credible intervals (CrIs). We estimated the proportion of HCoV infections due to transmission from asymptomatic and symptomatic individuals as follows. Using 1000 draws from the posterior distribution, we calculated the expected household attack rate and set βasymp and βsymp to 0 separately to estimate the expected household attack rate in the absence of each type of transmission. The proportional reduction in attack rate in each counterfactual was taken as the proportion of infections attributable to each mode of transmission.
We used the widely applicable information criterion (WAIC) to compare models with parameters stratified by age or symptom status. We evaluated the model by deriving the posterior distribution for the probability that a household-week was swabbed given its size and the household attack rate among swabbed households by size. To assess whether the model could correctly estimate the parameters, we simulated 500 data sets using the study design and parameter estimation as described above. We reported the median estimates across the 500 data sets and the coverage of the CrIs. Finally, we simulated studies of a similar size to the SMART2 study to estimate its power to detect differences in household transmission between symptomatic and asymptomatic individuals (Supplementary Methods).
The Institutional Review Boards of Johns Hopkins Bloomberg School of Public Health, University of Florida, University of Pittsburgh, and the US Centers for Disease Control and Prevention approved the study protocol.
RESULTS
Baseline Characteristics of SMART2 Subcohort Participants
Our subcohort study was composed of 947 participants from 223 households: 683 participants from 164 households in 2015–2016 and 688 from 163 households in 2016–2017. We excluded 10 participants (2 in year 1 and 8 in year 2) due to missing demographic data. Across both study periods, the median age was 16 years (IQR, 9–41), and half of participants were male (Table 1). Of the 334 participants attending school in 2015–2016, 87% attended K–12 school, 4% attended preschool, and 9% attended daycare, with similar patterns in 2016–2017.
Table 1.
Demographic Characteristics of Household Sub-Cohort Members
| Study Year | ||
|---|---|---|
| 2015–2016 | 2016–2017 | |
| Demographics | N=681 | N=680 |
| Median age [IQR] (years) | 16 [8–41] | 16 [8–41] |
| Age group—no. (%) | ||
| <5 | 62 (9%) | 49 (7%) |
| 5–9 | 62 (23%) | 155 (23%) |
| 10–19 | 156 (21%) | 155 (23%) |
| 20–49 | 269 (39%) | 274 (40%) |
| ≥50 | 52 (8%) | 47 (7%) |
| Male sex—no. (%) | 346 (51%) | 340 (50%) |
| Reported receiving influenza vaccine—no. (%) | 429 (63%) | 335 (49%) |
| Health conditions—no. (%) | ||
| Asthma | 74 (11%) | 73 (11%) |
| Current Smoker | 12 (2%) | 7 (1%) |
| School attendance—no. (%) | 334 | 345 |
| Attends daycare | 13 (4%) | 6 (2%) |
| Attends pre-school | 32 (9%) | 34 (10%) |
| Attends K-12 school | 288 (87%) | 298 (88%) |
| Household demographics | ||
| No. households | 164 | 163 |
| Median household size [Range] | 4 [2–7] | 4 [2–8] |
Abbreviations: IQR, Interquartile range; No., Number.
10 study participants (2 in year 1 and 8 in year 2) were excluded due to missing demographic information.
During the study, 269 ILI events in 148 households resulted in swabbing among 647 household members. In 2015–2016, 140 ILI events were reported by 110 participants (28 had repeated ILI events) resulting in swabbing of 294 members in 69 households. In year 2, 129 ILI events were reported by 118 participants (13 reporting repeated ILI events), resulting in swabbing of 353 members among 79 households. The median age of participants reporting ILI was 9 years (IQR, 5–20) in year 1 and 8 years (IQR, 6–36) in year 2 (Supplementary Figure S1A). The median time from an index case experiencing symptom onset to swabbing was 8 days (IQR, 7–10) in both years (Supplementary Figure S1B).
Characteristics of Infections
Over the study period, 121 human coronavirus infections were identified among 108 participants in 60 households (year 1, 57 infections and year 2, 64 infections) (Table 2). Male and female participants had the same (12%) proportion of infections. Of the 121 infections, 60% were caused by the HCoV-OC43 subtype, 22% were caused by HCoV-229E, 12% were caused by HCoV-HKU1, and 6% were caused by HCoV-NL63. Infections peaked during study week 8 of 2015–2016 (January) and week 7 of 2016–2017 (February) (Figure 2A), corresponding with known seasonal peak months of December–February [13, 14]. The HCoV-OC43 and HCoV-229E infections increased from 2015–2016 to 2016–2017, and no infections of HCoV-HKU1 and HCoV-NL63 were detected in 2016–2017. The proportions of asymptomatic infections were comparable across most subtypes (Supplementary Table S5). Similar log10 Qt values were observed across subtypes (Supplementary Figure S2). Infection rates by age varied by year (Figure 2B), the highest infections rates were among children ≤9 years.
Table 2.
Demographic Characteristics and Signs & Symptoms of 121 Human Coronavirus Infections
| Overall | 2015–2016 | 2016–2017 | |
|---|---|---|---|
| Demographics | n=121 (%) | n=57 (%) | n=64 (%) |
|
| |||
| Age group | |||
| <5 | 27 (22%) | 14 (25%) | 13 (20%) |
| 5–10 | 30 (25%) | 12 (21%) | 18 (28%) |
| 10–19 | 16 (13%) | 7 (12%) | 9 (14%) |
| 20–49 | 40 (33%) | 17 (30%) | 23 (36%) |
| ≥50 | 8 (7%) | 7 (12%) | 1 (2%) |
| Sex | |||
| Male sex—no. (%) | 62 (51%) | 28 (49%) | 34 (53%) |
| No symptoms | 32 (26%) | 13 (23%) | 19 (30%) |
| Reported symptoms among symptomatic infections | n=89 | n=44 | n=45 |
| Fever (>37.8°C) | 38 (42%) | 21 (48%) | 17 (38%) |
| Sore throat | 25 (28%) | 12 (27%) | 13 (29%) |
| Cough | 40 (45%) | 19 (43%) | 21(47%) |
| Headache | 23 (26%) | 12 (27%) | 11 (24%) |
| Runny nose and congestion | 55 (62%) | 25 (57%) | 30 (67%) |
| Muscle and joint pain | 12 (13%) | 7 (16%) | 5 (11%) |
| Nausea, diarrhea, and vomiting | 11 (12%) | 6 (14%) | 5 (11%) |
| Influenza-like illnessa | 39 (44%) | 24 (55%) | 15 (33%) |
Abbreviation: No., Number.
Influenza-like Illness defined as a fever (>37.8°C) and either sore throat or cough.
Figure 2.
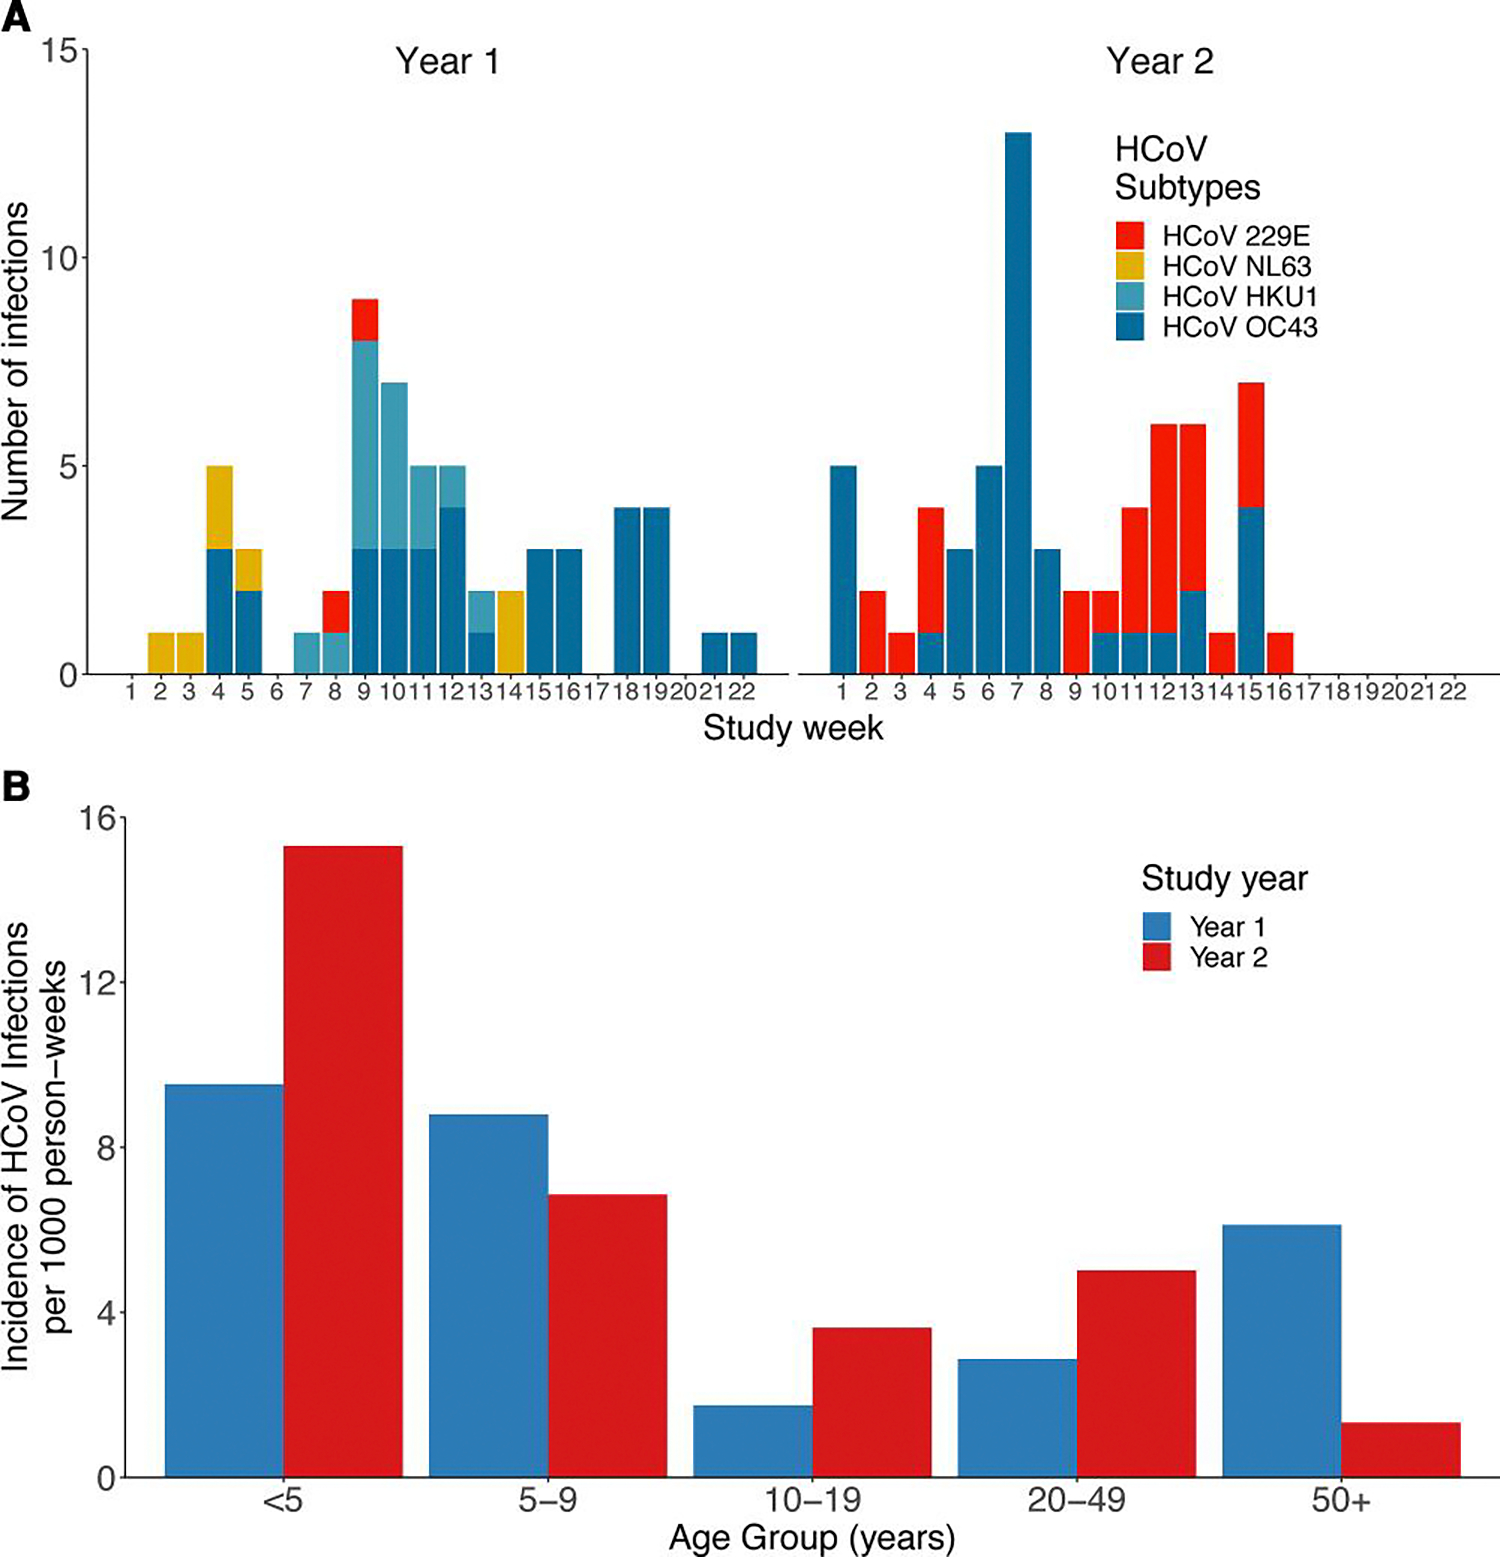
Weekly number of confirmed human coronavirus (HCoV) infections by subtype (A) and the infection rate by age group and study year (B) identified through Surveillance Monitoring of Absenteeism and Respiratory Transmission (SMART2) household weekly influenza-like illness surveillance. Year 1 was from December 2015 to April 2016 and year 2 was from January 2017 to May 2017. No HCoV-HKU and HCoV-NL63 infections were detected during the second study year.
We observed 5 HCoV coinfections (4 HCoV-OC43 and HCoV 229E coinfections and 1 HCoV-OC43 and HCoV-HKU1), 1 individual infected twice with the same strain (HCoV-OC43) 7 weeks apart, and 27 coinfections with other respiratory viruses during the study (Supplementary Table S3). Coinfection characteristics are in Supplementary Table S4. Young children had higher frequency (30%) of coinfections, but otherwise participants with and without coinfections had similar characteristics.
Among the 89 symptomatic infections, the most common self-reported symptoms were runny nose and congestion (62%), cough (45%), fever (42%), sore throat (28%), and headache (26%) (Table 2). Few participants reported joint or muscle pain (13%) or diarrhea, nausea, and vomiting (12%). Although experiencing ILI was necessary to initiate household swabbing, only 44% of symptomatic HCoV-positive participants reported ILI. Twenty-six percent of all confirmed infections were asymptomatic.
Children 9 years and younger reported more symptomatic infections than adults, but this was not statistically different (Figure 3). Children under 5 years (80% [95% CI, 59%–93%] of 25 infections) and children aged 5–9 years (82% [95% CI, 64%–94%] of 29 infections) reported higher frequencies of symptomatic infections, compared to 66% of symptoms reported by other age groups. Given the varied symptomatic infections by age, we examined infected participants’ Qt values and found no clear difference (Supplementary Figure S3), nor observed a relationship between Qt values and time from symptom onset to sample collection (Supplementary Figure S4).
Figure 3.
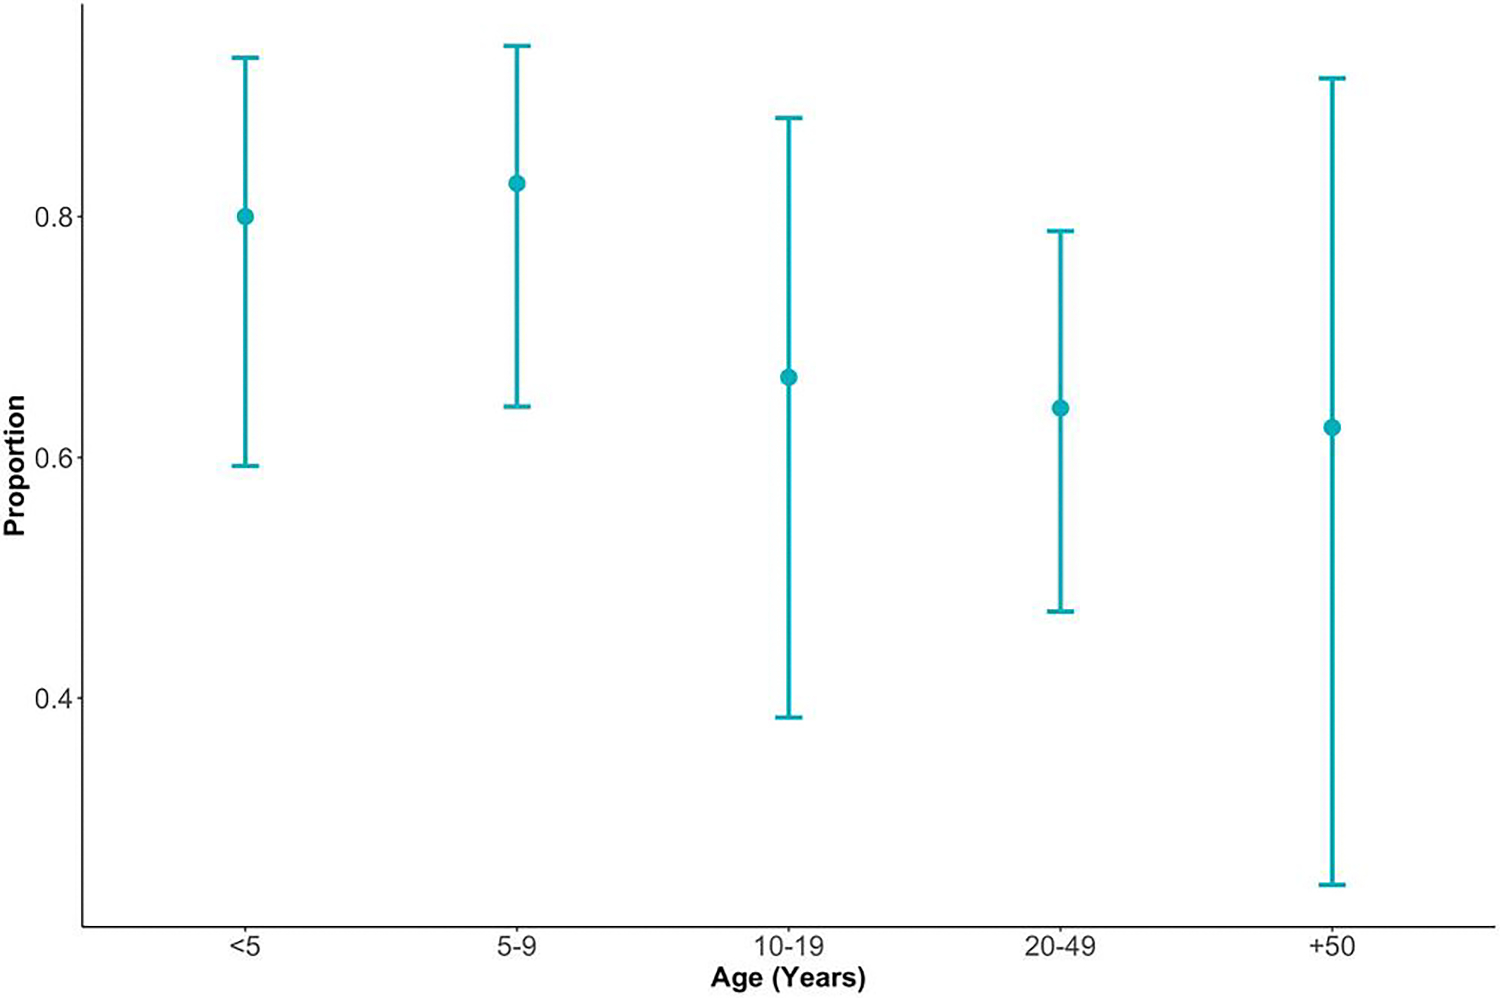
Proportion and 95% confidence intervals of symptomatic human coronavirus infections by age group (in years) from December 2015 to April 2016 and January 2017 to May 2017 in the Surveillance Monitoring of Absenteeism and Respiratory Transmission (SMART2) household weekly influenza-like illness surveillance.
Household Transmission
In households with ≥1 HCoV infection, the average household secondary attack rate was 16% (range, 0%–100%). Weekly probability of acquiring HCoV infection from the community was 7.1% (95% CrI, 5.0–10.3) and 7.6% (95% CrI, 5.5–10.3) in years 1 and 2. Community transmission probabilities varied by strain but not by age (Supplementary Table S6). The crude proportion of symptomatic infections that met the definition of ILI was 54% and 27% among children and adults, respectively. After accounting for oversampling of ILI infections among swabbed households, this probability was 4.8% (95% CrI, 3.1–7.8) and 1.6% (95% CrI, 0.7–3.1) among children and adults, respectively (relative risk, 3.0; 95% CrI, 1.5–6.9). Supplementary Table S7 shows parameter estimates without accounting for oversampling of ILI infections.
The weekly probability of a susceptible individual being infected by an infected household member was 8.8% (95% CrI, 5.6–12.9), and the probability of symptomatic infection was 59.8% (95% CrI, 49.2–70.0). The transmission model results do not provide conclusive evidence for age-related differences in within-household transmission or probability of displaying symptoms (Table 3). Although some models suggest that symptomatic individuals had higher risk of infecting household members than asymptomatic individuals, these fit the data no better than more parsimonious models. From simulations we estimate that a study of this design and size would have conclusively detected a 10-fold relative risk of household transmission comparing symptomatic to asymptomatic individuals 29% of the time and a 2-fold relative risk 11% of the time (Supplementary Table S10). Reasonable power to detect a 2-fold relative risk would require large studies (>3× the size of this study, or >669 households reporting an ILI), whereas a study twice the size would achieve >70% power to detect a 10-fold relative risk.
Table 3.
Median (95% CrI) Posterior Estimates of Weekly Household Transmission Probability of RT-PCR Confirmed Human Coronavirus Infections (β) and Probability of Symptoms Upon Infection (ps) When Stratifying Parameters by Age (<19 years vs. ≥19 years) and/or Symptom Status
| Parameter Estimate (95% CrI) |
|||||||
|---|---|---|---|---|---|---|---|
| Weekly Household Transmission Probability |
Probability of Symptoms |
||||||
| Model | WAIC | Asymp. <19y | Symp. <19y | Asymp. ≥19y | Symp. ≥19y | <19y | ≥19y |
| Null | 2642 | 0.09 (0.06,0.13) | 0.60 (0.50,0.70) | ||||
| HH transmission symptom-stratified | 2643 | 0.05 (0.01,0.14) | 0.11 (0.06,0.16) | 0.05 (0.01,0.14) | 0.11 (0.06,0.16) | 0.59 (0.48,0.70) | |
| Symptom probability age-stratified | 2643 | 0.09 (0.06,0.13) | 0.64 (0.50,0.78) | 0.56 (0.41,0.70) | |||
| HH transmission age-stratified | 2644 | 0.07 (0.01,0.15) | 0.11 (0.02,0.21) | 0.60 (0.49,0.71) | |||
| HH transmission symptom-stratified, symptom probability age-stratified | 2644 | 0.05 (0.01,0.14) | 0.11 (0.06,0.16) | 0.05 (0.01,0.14) | 0.11 (0.06,0.16) | 0.64 (0.48,0.77) | 0.55 (0.40,0.70) |
| HH transmission symptom- and age-stratified | 2646 | 0.06 (0.004,0.19) | 0.10 (0.02,0.18) | 0.08 (0.004,0.23) | 0.11 (0.02,0.22) | 0.60 (0.49,0.70) | |
| HH transmission and symptom probability age-stratified | 2646 | 0.07 (0.01,0.16) | 0.11 (0.02,0.21) | 0.64 (0.48,0.77) | 0.56 (0.41,0.69) | ||
| HH transmission symptom- and age-stratified, symptom probability age-stratified | 2648 | 0.06 (0.003,0.20) | 0.10 (0.02,0.18) | 0.07 (0.003,0.22) | 0.10 (0.02,0.19) | 0.63 (0.49,0.77) | 0.55 (0.39,0.71) |
Overall, 21% (95% CrI, 17%–26%) of infections were attributable to household transmission. The proportion attributable to asymptomatic individuals depended on whether transmissions were stratified by symptom status (average contribution was 5.5% across 4 stratified models vs 8.4% across unstratified models). The model fit household swab probabilities and attack rate among swabbed households well (Figure 4), although it slightly overestimated both. See Supplementary Results for model evaluation and simulation results.
Figure 4.
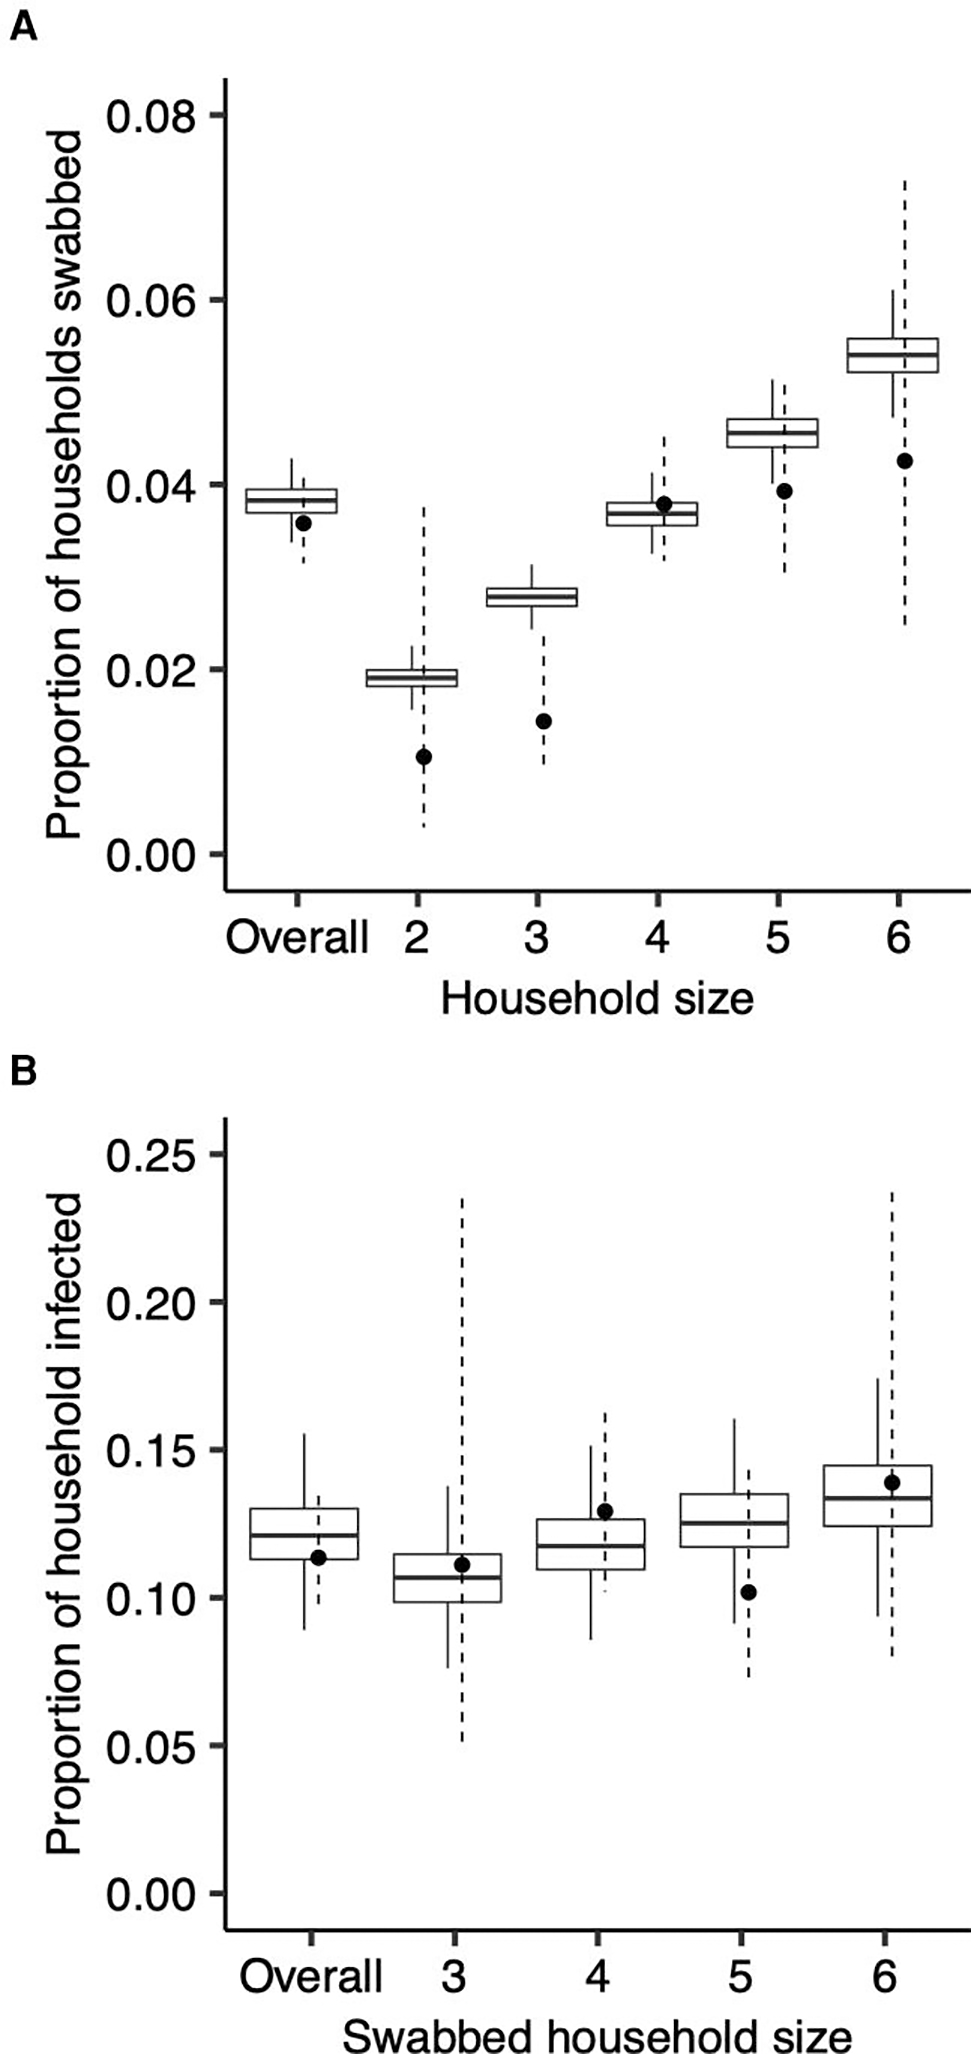
Model fit of the probability of being swabbed and of household members being infected in swabbed households. The observed and modeled probability of being swabbed, overall and by household size (A), and the observed and modeled proportion of household members infected in swabbed households, overall and by household size (B). Boxplots reflect model posteriors, and circles and corresponding error bars (dashed) reflect observed estimates and 95% binomial confidence intervals.
DISCUSSION
Using longitudinal data and correcting for missing data from unswabbed households, we estimated the probability of transmitting RT-PCR-confirmed coronavirus infections from infected individuals to household contacts of the SMART2 study. Infected children were more likely to develop ILI symptoms than infected adults, and household transmission likely occurs from both symptomatic and asymptomatic individuals.
Transmission between household members accounted for 21% of all HCoV infections. A recent longitudinal household study of symptomatic HCoV infections estimated that 9% (95% CI, 6%– 15%) of infections were acquired within the home and found transmission risk varied by strain [15]. Monto et al [14] found that 26% of symptomatic HCoV infections occurred within 14 days of exposure to a household contact infected with the same strain, representing an upper bound on the proportion of infections acquired through household transmission. Other seasonal coronavirus studies found that children, more than adults, act as primary index cases for household transmission [14, 16]. However, we found no difference in community acquisition between adults and children.
The SMART2 study predates the emergence of SARS-CoV2 and the ongoing coronavirus disease 2019 (COVID-19) pandemic and focused on 4 pre-existing (endemic) human coronaviruses. However, the comparison with household transmission of SARS-CoV-2, particularly how transmission and risk factors change as the pandemic progresses, warrants study. Early contact-tracing studies demonstrated that household contacts had a higher risk for SARS-CoV-2 acquisition than non-household contacts [17, 18], but this widely varied in SARs across household studies (0% to 74% [19]) and individual-level transmissibility [20]. Lack of symptoms were associated with lower transmissibility in a household-based contact-tracing study [21] and in a cross-sectional, household-based serosurvey [22], among others [19]. As population-level immunity from infection and vaccination, together with symptom presentation of SARS-CoV-2 infection, continues to change, active surveillance of asymptomatic individuals will become key to understand SARS-CoV-2 household transmission [23].
Our study suggests that, for endemic coronaviruses, asymptomatic individuals contribute to 20%–40% of household transmission across different models. Because of the process for choosing households to swab, there were likely a significant number of infections in unswabbed households, both asymptomatic and symptomatic. Therefore, a model failing to account for case-detection methods likely underestimated the probability of community acquisition and overestimated the probability of within-household transmission among symptomatic individuals. Conclusive evidence requires large household studies, at least twice the size of this study, designed to detect households containing only asymptomatic infections and analyzed to correct for possible bias from the swabbing process.
Children, particularly those under 5, more frequently experienced symptomatic infection in our study, suggesting they have less pre-existing immunity than older individuals. Adults reported fewer symptoms and had higher proportions of asymptomatic infections, indicating adults are still susceptible to infection, but they have some immunity. Recent studies found similar trends for seasonal coronaviruses [14, 24, 25], although these findings contrast with age-specific trends of SARS-CoV-2 infections. Early in the COVID-19 pandemic (January 2020–June 2021), adults experienced more symptomatic infections than children, with adults over 65 years experiencing hospitalization rates at least 6 times higher than adults ages 18–29 [26] and higher mortality [27]. In addition, some studies identified increasing susceptibility to infection with age [28, 29]. However, large changes in contact patterns in many settings due to nonpharmaceutical interventions to reduce SARS-CoV-2 transmission, such as school closures, potentially confounded early estimates of infection risk by age.
Household study designs have known biases: eg, index case-based investigations recruit only households with ≥1 case, making it difficult to estimate community infection rates; index cases investigations are likely to select cases with more severe disease; and following for clinical disease likely underestimates the true secondary attack rate. Household cohort studies can overcome some of these limitations, but they are logistically challenging. Our study design and analysis, combining syndromic surveillance with household swabbing, provide a method to capture symptomatic and asymptomatic infections and study the contribution of each to transmission. However, larger studies are necessary to produce robust inferences about differences in transmissibility by individual characteristics.
This study has limitations. Because the average time between reported symptoms and sample collection was 8 days, we likely missed detecting index infections, which may underestimate the true number of infections. Although we found no evidence of transmission variability by age and symptoms, our study had limited power to detect such differences. Because swabbing depended on reported ILI, households with younger children were likely overrepresented among swabbed households. We found increased probability of ILI upon symptomatic infection among children (<19 years), but there may have been further variation by age. Although we assumed that community acquisition was constant within a study season and across households, swabbed household-weeks could be at higher risk of community infection than unswabbed household-weeks (through risk factors not accounted for in our model) and may have reported symptoms differently. Ignoring this variation likely led to overestimating community acquisition parameters and underestimating household transmission. Incorporating clustering in community infections did not improve model fit, but other clustering may be present. Finally, because we treated weeks from the same household as independent, we likely overestimated the transmission parameters’ precision.
CONCLUSIONS
Our approach characterizes endemic coronavirus household transmission and accounts for missing data from unswabbed households. We highlight differences in symptom severity by age and variation in community transmission by strain. Symptomatic surveillance is an efficient approach for identifying symptomatic infections within a household, but our method of accounting for missing data from unswabbed households underscores the need for larger samples and more routine swabbing of households regardless of illness to better identify asymptomatic infections. These insights are crucial for understanding the extent of household transmission and identifying factors associated with secondary infection and can inform study designs for household transmission of SARS-CoV-2.
Supplementary Material
Financial support.
This work was funded by a grant from the US Centers for Disease Control and Prevention (Cooperative Agreement 1 U01 CK000337–01; to D. A. T. C.). The UK Research and Innovation (Grant Number MR/V038613/1) provides support to J. M. R.
Footnotes
Potential conflicts of interest. T. M. Q. received honoraria for and served on the MEICHV COVID-19 Health Equity Community Advisory Board. M. D. T. H. and D. A. T. C. reports contract from Merck (to the University of Florida) for research unrelated to this manuscript. All authors have submitted the ICMJE Form for Disclosure of Potential Conflicts of Interest. Conflicts that the editors consider relevant to the content of the manuscript have been disclosed.
Disclaimer. The findings in this article are those of the authors and do not necessarily represent the official position of the US Centers for Disease Control and Prevention.
Supplementary Data
Supplementary materials are available at The Journal of Infectious Diseases online. Consisting of data provided by the authors to benefit the reader, the posted materials are not copy-edited and are the sole responsibility of the authors, so questions or comments should be addressed to the corresponding author.
References
- 1.Huang AT, Garcia-Carreras B, Hitchings MDT, et al. A systematic review of antibody mediated immunity to coronaviruses: kinetics, correlates of protection, and association with severity. Nat Commun 2020; 11:4704. [DOI] [PMC free article] [PubMed] [Google Scholar]
- 2.Galanti M, Shaman J. Direct observation of repeated infections with endemic coronaviruses. J Infect Dis 2020; 223: 409–415. [DOI] [PMC free article] [PubMed] [Google Scholar]
- 3.Kissler SM, Tedijanto C, Goldstein E, Grad YH, Lipsitch M. Projecting the transmission dynamics of SARS-CoV-2 through the postpandemic period. Science 2020; 368:860–8. [DOI] [PMC free article] [PubMed] [Google Scholar]
- 4.Lavine JS, Bjornstad ON, Antia R. Immunological characteristics govern the transition of COVID-19 to endemicity. Science 2021; 371:741–745. [DOI] [PMC free article] [PubMed] [Google Scholar]
- 5.Tsang TK, Lau LLH, Cauchemez S, Cowling BJ. Household transmission of influenza virus. Trends Microbiol 2016; 24: 123–33. [DOI] [PMC free article] [PubMed] [Google Scholar]
- 6.Cauchemez S, Donnelly CA, Reed C, et al. Household transmission of 2009 pandemic influenza A (H1N1) virus in the United States. N Engl J Med 2009; 361:2619–27. [DOI] [PMC free article] [PubMed] [Google Scholar]
- 7.Kombe IK, Munywoki PK, Baguelin M, Nokes DJ, Medley GF. Model-based estimates of transmission of respiratory syncytial virus within households. Epidemics 2019; 27:1–11. [DOI] [PMC free article] [PubMed] [Google Scholar]
- 8.Endo A, Uchida M, Kucharski AJ, Funk S. Fine-scale family structure shapes influenza transmission risk in households: insights from primary schools in Matsumoto city, 2014/15. PLoS Comput Biol 2019; 15:e1007589. [DOI] [PMC free article] [PubMed] [Google Scholar]
- 9.Read JM, Zimmer S, Vukotich C Jr, et al. Influenza and other respiratory viral infections associated with absence from school among schoolchildren in Pittsburgh, Pennsylvania, USA: a cohort study. BMC Infect Dis 2021; 21:291. [DOI] [PMC free article] [PubMed] [Google Scholar]
- 10.Babady NE, England MR, Jurcic Smith KL, et al. Multicenter evaluation of the eplex respiratory pathogen panel for the detection of viral and bacterial respiratory tract pathogens in nasopharyngeal swabs. J Clin Microbiol 2018; 56:e01658–17. [DOI] [PMC free article] [PubMed] [Google Scholar]
- 11.Longini IM J, Koopman JS. Household and community transmission parameters from final distributions of infections in households. Biometrics 1982; 38:115–26. [PubMed] [Google Scholar]
- 12.Cousien A, Abel S, Monthieux A, et al. Assessing Zika virus transmission within households during an outbreak in Martinique, 2015–2016. Am J Epidemiol 2019; 188:1389–96. [DOI] [PMC free article] [PubMed] [Google Scholar]
- 13.Park S, Lee Y, Michelow IC, Choe YJ. Global seasonality of human coronaviruses: a systematic review. Open Forum Infect Dis 2020; 7:ofaa443. [DOI] [PMC free article] [PubMed] [Google Scholar]
- 14.Monto AS, DeJonge PM, Callear AP, et al. Coronavirus occurrence and transmission over 8 years in the HIVE cohort of households in Michigan. J Infect Dis 2020; 222:9–16. [DOI] [PMC free article] [PubMed] [Google Scholar]
- 15.Beale S, Lewer D, Aldridge RW, et al. Household transmission of seasonal coronavirus infections: results from the flu watch cohort study. Wellcome Open Res 2020; 5:145. [DOI] [PMC free article] [PubMed] [Google Scholar]
- 16.Nyaguthii DM, Otieno GP, Kombe IK, et al. Infection patterns of endemic human coronaviruses in rural households in coastal Kenya. Wellcome Open Res 2021; 6:27. [DOI] [PMC free article] [PubMed] [Google Scholar]
- 17.Cheng HY, Jian SW, Liu DP, Ng TC, Huang WT, Lin HH. Contact tracing assessment of COVID-19 transmission dynamics in Taiwan and risk at different exposure periods before and after symptom onset. JAMA Intern Med 2020; 180: 1156–63. [DOI] [PMC free article] [PubMed] [Google Scholar]
- 18.Ng OT, Marimuthu K, Koh V, et al. SARS-CoV-2 seroprevalence and transmission risk factors among high-risk close contacts: a retrospective cohort study. Lancet Infect Dis 2021; 21:333–43. [DOI] [PMC free article] [PubMed] [Google Scholar]
- 19.Madewell ZJ, Yang Y, Longini IM Jr., Halloran ME, Dean NE. Factors associated with household transmission of SARS-CoV-2: an updated systematic review and meta-analysis. JAMA Netw Open 2021; 4:e2122240. [DOI] [PMC free article] [PubMed] [Google Scholar]
- 20.Toth DJA, Beams AB, Keegan LT, et al. High variability in transmission of SARS-CoV-2 within households and implications for control. PLoS One 2021; 16:e0259097. [DOI] [PMC free article] [PubMed] [Google Scholar]
- 21.Li W, Zhang B, Lu J, et al. The characteristics of household transmission of COVID-19. Clin Infect Dis 2020; 71:1943–6. [DOI] [PMC free article] [PubMed] [Google Scholar]
- 22.Bi Q, Lessler J, Eckerle I, et al. Insights into household transmission of SARS-CoV-2 from a population-based serological survey. Nat Commun 2021; 12:3643. [DOI] [PMC free article] [PubMed] [Google Scholar]
- 23.Stockwell MS, Reed C, Vargas CY, et al. Five-year community surveillance study for acute respiratory infections using text messaging: findings from the MoSAIC study. Clin Infect Dis 2022; 75:987–95. [DOI] [PMC free article] [PubMed] [Google Scholar]
- 24.Monto AS, Malosh RE, Petrie JG, Thompson MG, Ohmit SE. Frequency of acute respiratory illnesses and circulation of respiratory viruses in households with children over 3 surveillance seasons. J Infect Dis 2014; 210:1792–9. [DOI] [PMC free article] [PubMed] [Google Scholar]
- 25.Grimwood K, Lambert SB, Ware RS. Endemic non-SARS-CoV-2 human coronaviruses in a community-based Australian birth cohort. Pediatrics 2020; 146:e2020009316. [DOI] [PubMed] [Google Scholar]
- 26.Centers for Disease Control and Prevention. Hospitalization and Death by Age. Available at: https://www.cdc.gov/coronavirus/2019-ncov/covid-data/investigations-discovery/hospitalization-death-by-age.html. Accessed 13 October 2020.
- 27.Wortham JM, Lee JT, Althomsons S, et al. Characteristics of persons who died with COVID-19—United States, February 12–May 18, 2020. MMWR Morb Mortal Wkly Rep 2020; 69:923–9. [DOI] [PubMed] [Google Scholar]
- 28.Jing QL, Liu MJ, Zhang ZB, et al. Household secondary attack rate of COVID-19 and associated determinants in Guangzhou, China: a retrospective cohort study. Lancet Infect Dis 2020; 20:1141–50. [DOI] [PMC free article] [PubMed] [Google Scholar]
- 29.Davies NG, Klepac P, Liu Y, Prem K, Jit M, Eggo RM. Age-dependent effects in the transmission and control of COVID-19 epidemics. Nat Med 2020; 26:1205–11. [DOI] [PubMed] [Google Scholar]
Associated Data
This section collects any data citations, data availability statements, or supplementary materials included in this article.