

Abstract
This paper addresses the pressing issue of diabetes, which is a widespread condition affecting a huge population worldwide. As cells become less responsive to insulin or fail to produce it adequately, blood sugar levels rise. This has the potential to cause severe health complications including kidney disease, vision impairment and heart conditions. Early diagnosis is paramount in mitigating the risk and severity of diabetes-related complications. To tackle this, we proposed a robust framework for diabetes prediction using Synthetic Minority Over-sampling Technique (SMOTE) with ensemble machine learning techniques. Our approach incorporates strategies such as imputation of missing values, outlier rejection, feature selection using correlation analysis and class distribution balancing using SMOTE. The extensive experimentation shows that the proposed combination of AdaBoost and XGBoost shows exceptional performance, with an impressive AUC of 0.968+/-0.015. This outperforms not only alternative methodologies presented in our study but also surpasses current state-of-the-art results. We anticipate that our model will significantly improve diabetes prediction, offering a promising avenue for improved healthcare outcomes in diabetes management.
Keywords: Diabetic, Outlier detection, Machine learning, AdaBoost, XGBoost, SMOTE
Subject terms: Computational biology and bioinformatics, Diseases, Health care, Health occupations
Introduction
Millions of individuals throughout the world suffer from the chronic condition diabetes. It is characterized by elevated blood sugar levels due to inadequate insulin production or utilization. Insulin plays a vital role in supplying energy to cells and regulating glucose levels. Diabetes is often undiagnosed in developing countries, which makes it a challenge to manage1. According to the 10th edition of the International Diabetes Federation (IDF) Diabetes Atlas, more than 10% of adults will have diabetes worldwide in 2021, and by 2045, there will be 700 million people living with the disease2. Diabetes patients are at a higher risk of having health complications such as heart attack, stroke, kidney failure and also it can cause permanent damage to blood vessels in the heart, eyes, kidneys, and nerves3. Even though there is no permanent cure for diabetes, early detection and prediction of diabetes may reduce the complications of the disease. Early detection increases the potential for effective changes early on, which can prevent or delay the onset of complications. Predicting diabetes is challenging because the relationship between the attributes and the outcome is not straightforward and cannot be easily distinguished by a linear boundary4. This work introduces a novel pipeline for diabetes prediction, encompassing preprocessing steps such as SMOTE(Synthetic Minority Oversampling Technique) for class imbalance handling, missing value imputation, outlier rejection, K-Fold cross-validation, and feature selection.SMOTE is a method of oversampling in which the data points of the minority classes are oversampled to balance the dataset5.SMOTE is implemented to address the class imbalance in datasets.It improves the accuracy of the model on the minority class and reduces the bias towards the majority class. By outlier rejection, the accuracy of the classifiers can be improved significantly as those data points are not good representatives of underlying distributions. In the proposed work, the missing valueshave been imputed by mean, so that mean of the data can be preserved. If data are missing completely at random, the estimate of the mean remains unbiased. Feature selection techniques are employed to reduce the number of input variables by eliminating irrelevant features and narrowing down the focus to the most important features. K-Fold cross-validation ensures that every datum is used in testing the model, thus giving a fair evaluation of the model’s performance. It is typically used to remove the bias in the dataset6. Grid search technique is employed to optimize the hyperparameters, it allows for a systematic approach to hyperparameter optimization, which can further improve the performance of the model and reduce the chance of overfitting. We conducted extensive experiments using various combinations of preprocessing techniques and machine learning classifiers, including k-Nearest Neighbors (k-NN), Random Forest (RF), Decision Tree (DT), Naive Bayes (NB), AdaBoost (AB), andXGBoost (XB), to maximize the Area Under the ROC Curve (AUC) for diabetes prediction. Instead of accuracy, we utilized AUC as the weighing metric for model selection in ensembling approach, as it remains unbiased to class distribution. Through rigorous experimentation, we sought to identify the optimal ensemble classifier by combining the best-performing preprocessing methods determined in earlier experiments with various machine-learning models.
The related works and literature survey have been presented in Sect. 2. The proposed approach, dataset description, and assessment metrics are presented in Sect. 3. The experimental findings and their interpretations are provided in Sect. 4. The paper is finished with the conclusion in Sect. 5.
Related work
Developing an accurate diabetes prediction model has been a subject of interest for several researchers. Numerous techniques have been put out in recent years for predicting diabetes. In7, the author has studied various machine learning classification algorithms: Genetic Algorithm, Decision Tree, Random Forest, Logistic Regression, SVM, and Naive Bayes. A supervised k-Nearest Neighbor machine learning algorithm was proposed in8.An ensemble approach was proposed in9 where AdaBoost, Bagging, and Random Forest were implemented. A weighted ensemble of Decision Tree, Random Forest, XGBoost, and LightGBM (LGB) was proposed in10, where they were able to attain a maximum AUC of 0.832. In4, machine learning classifiers such as AdaBoost, Decision Trees, k-nearest Neighbor, Naive Bayes, Random Forest, XGBoost, and Multilayer Perceptron were implemented. They also combine these ML models and create an ensembling classifier and they were able to achieve a maximum AUC of 0.950. In11, missing value imputation (MVI) was focused and it is incorporated in various ML-based pipelines. Nonetheless, this area of research still faces significant challenges due to the unavailability of suitable data-sets and prediction methods.Classification algorithms were used to predict diabetes in12, the result showed that Naive Bayes outperformed other algorithms with the highest accuracy of 76.30%. In13,14, results show that Random Forest with feature selection and classification obtainsan AUC value of 0.93. In15, Random Forest achieved the highest accuracy of 85.558%. In16,17, the J48 Decision treealgorithm achieved 94.44% accuracy, Random Forest achieved 94% accuracy and Naive Bayes achieved 91% accuracy. Table 1 shows the literature survey of the proposed model.
Table 1.
Literature survey.
| Author | Dataset | Limitation | Accuracy |
|---|---|---|---|
| 16 | Pima Indians Diabetes Dataset | Compares only a few ML algorithms | J48 decision tree with 94.44% accuracy, as well as Random Forest with 94% accuracy |
| 18 | Dataset of diabetes from Frankfurt hospital | Limited data preprocessing is done | Decision tree of 99% accuracy |
| 19 | Diabetes 130 | Practical Implementation is difficult | Light gradient boosting model is better performing |
| 20 | (NHANES), MIMIC-III and MIMIC-IV | Dataset is specific for a certain population | Logistic Regression model achieved the highest accuracy of 86% |
| 21 | Dataset from the TUBITAK study | The dataset size is relatively small, which may affect generalizability | The best model, an RNN-LSTM achieved an AUC of 98%. |
| 22 | T2DM database | Models used are prone to overfitting | LGBM achieved the highest accuracy at 95.2% |
| 23 | NHANES | Logistic regression may not capture complex relationships | The logistic regression model achieved an accuracy of approximately 78.26% |
Proposed framework
The dataset is gathered and subjected to preprocessing to remove any discrepancies, such as imbalanced class issues and null instances, followed by imputation of mean values to replace them. The dependent variable in the dataset is a binary classification of whether diabetes is present or not, specifically indicated as “Diabetes: Yes or No.” The proposed framework is illustrated in Fig. 1.
Fig. 1.

Proposed work.
In the proposed framework, the preprocessing techniques employed are crucial as the data contains some issues that need to be addressed before implementing the classifiers. To handle the non-uniform class distribution in the Pima-Indian-Diabetes (PID) Dataset, SMOTE has been employed. This framework also employs gradient boosting classifiers, which are ensembled to improve the accuracy of the results. The hyperparameters of the gradient boosting classifiers are optimized using the technique of grid search.
The main contribution of the proposed model:
The dataset is collected from Kaggle. The imbalanced data are balanced using SMOTE Algorithm.
The outlier rejection is performed using interquartile range method.
The essential features are extracted using correlation analysis.
Data is trained with hybrid machine learning algorithms and optimized through the grid search method.
Finally, the hybrid algorithm of AdaBoost with XGBoost is comparedwith other state of art algorithms and the hybrid algorithm has better performance.
Dataset description
The study utilizes the Pima-Indians-Diabetes dataset from the UCI ML Repository, focusing on females over 21 with Pima Indian ancestry near Phoenix, Arizona. The data-set’s relevance lies in contemporary lifestyle similarities, with 268 out of 768 patients diagnosed with diabetes. It features eight attributes and one class attribute, with a notable class imbalance affecting model training. This imbalance, where non-diabetic instances outweigh diabetic ones, could impair the efficacy of certain machine-learning algorithms and necessitates careful handling during model development. Table 2 shows the overview of the PID data set. The dataset used in the study can be accessed from the below link.
Table 2.
The overview of the PID dataset.
| Features | Description | Range |
|---|---|---|
| Pregnant | Number of pregnancies | 0–17 |
| Glucose | Results of the oral glucose tolerance test expressed in milligrams. | 0 -199 |
| Diastolic Blood Pressure | Diastolic BP expressed in (mmHg). | 0–122 |
| Skin thickness | The thickness of the triceps skinfold in millimeters. | 0–99 |
| Insulin level | Insulin level in the blood of a patient. | 0–846 |
| Body Mass Index | Weight of the patient(kg)/ height of the patient (m2) | 0–67.1 |
| Patient age | Age of the patient(years) | 21–81 |
| Diabetes pedigree | Diabetes is defined based on the heredity factor. | 0.078–2.42 |
https://www.kaggle.com/datasets/uciml/pima-indians-diabetes-database.
By preprocessing, the quality of the data can be enhanced significantly. Preprocessing has become an inevitable step in machine learning. In our framework, preprocessing includes addressing the class imbalance problem by SMOTE, rejection of outliers, imputation of missing values, and selecting features that are more relevant to the outcome.
SMOTE
Chawla et al.24 introduced SMOTE, a pioneering method in addressing imbalanced datasets. Unlike traditional oversampling approaches, SMOTE generates synthetic instances by leveraging neighboring information rather than relying solely on random duplication of existing samples. By interpolating between minority class samples, SMOTE creates new synthetic samples that retain similarities with existing instances while introducing variability. This augmentation strategy enhances the diversity of minority class representations, thereby improving the performance of machine learning models on imbalanced datasets.This is done by interpolating between existing minority class samples. Given a minority class sample  find its k nearest neighbors in the feature space. Here, the Euclidian distance is used to find these nearest neighbors and it is represented in Eq. (1).
 |
1 |
The synthetic samples are created using Eq. (2).
 |
2 |
Since  is between 0 and 1,
  is guaranteed to lie on the line segment between
  and
and  .
.
By generating synthetic samples within the convex hull of the existing minority class samples, SMOTE ensures that the new samples are plausible in the context of the existing data distribution. This approach helps in smoothing the decision boundary for the minority class, thus improving the performance of classifiers.
Outlier rejection
An outlier is a pattern that is dissimilar with respect to all the remaining patterns in the data set25. Outliers can be caused by measurement errors, data entry errors, or other factors that cause a data point to be significantly different from the rest of the data. Outliers impact the predictions of the classifier. Therefore, they need to be removed from the data.The IQR model is used for outlier detection to identify and remove outliers from the dataset.The IQR method involves calculating the interquartile range (IQR) of the data and defining a fence outside of the first and third quartiles. Any data points that fall outside of this fence are considered outliers and are removed from the dataset.In Box plots, outliers are identified based on their distance from the median or the quartiles. Specifically, an observation is considered an outlier if it falls below the lower quartile minus 1.5 times the interquartile range (IQR) or above the upper quartile plus 1.5 times the IQR26. It is shown in Eq. (3).
 |
3 |
The first quartile, third quartile, and interquartile range of the qualities are denoted as ,
, and
and  , respectively.
Missing value imputation
After outlier rejection, the missing values of the attributes should be imputed. Missing values can occur in datasets for various reasons, such as corrupt measurements, data entry errors, or incomplete data. Imputing missing values is important because it can help to reduce bias and improve the accuracy of statistical analyses and machine learning models. By imputing the missing values, the sample size can be preserved. In this framework, the missing values are imputed with the mean of the data. By imputing with mean, it can be preserved and this will not introduce any outlier during the process. It is shown in Eq. (4).
 |
4 |
where x represents the feature vector instances that are in N-dimensional space.
Feature selection
The main reason for doing feature selection is to improve the accuracy and efficiency of machine learning models by reducing the dimensionality of the data and eliminating irrelevant or redundant features. Proper feature selection enhances accuracy and decreases training time27. By calculating the inter-correlation values between attributes, Correlation Based Feature Selection (CFS) calculates the relevance of each individual attribute28. A feature subset with a correlation between the features to prevent redundancy and a high feature-class correlation to boost prediction result. It evaluates based on intrinsic data qualities, such as correlations.The feature selection is used to select the best features in order to reduce computational time. A correlation-based approach is proposed in order to minimize the high dimensionality, reduce the computational time, and select the best combinations of features so that the performance of the training and evaluation process will be increased. The correlation-based feature selection is shown in Eq. (5).
 |
5 |
Where,  is the correlation between the features
  and target feature y.
  and
and  are the mean value of x and y, respectively.
K-fold cross validation
K-fold Cross-Validation (KCV) is one of the most widely used techniques for choosing classifiers and estimating error29. The dataset has been divided into the training set and the testing set at random for the K cross-validation. The K cross-validation method folds the data into K groups. The remaining K-1 folds are utilized for training, and one-fold is used for validation and testing. Until every K fold is a test set, the method will be repeated. The efficacy of the approaches on unknown data is precisely estimated via cross-validation30. If the algorithm itself incorporates randomness, it will produce various outcomes for the same training data each time. The uncertainty in the results is not considered by cross-validation5. To compute final evaluation metrics the Eq. (6) is used,
 |
6 |
where K represents number of folds, M indicates the final performance metric for each classifier, and .
.
K-nearest neighbor
K-Nearest Neighbors (k-NN) is a simple, yet powerful, supervised learning algorithm used for classification and regression tasks. It operates based on the principle of similarity: the algorithm classifies a data point by examining the ‘k’ closest training examples in the feature space. The majority class among these neighbors determines the class label for classification, while the average (or weighted average) of the neighbors’ values determines the prediction for regression31.
Naïve Bayes
The Naive Bayes classifier is a probabilistic model based on Bayes’ Theorem, which is used for classification tasks. It assumes that the features used for classification are conditionally independent given the class label, which simplifies the computation of the posterior probabilities. Despite this simplifying assumption (which is often unrealistic in real-world scenarios), Naive Bayes can perform remarkably well and is particularly effective for large datasets and text classification tasks.
Decision Tree
A Decision Tree is a supervised learning algorithm used for both classification and regression tasks. It models decisions and their possible consequences in a tree-like structure, where each internal node represents a decision based on a feature, each branch represents an outcome of the decision, and each leaf node represents a class label (for classification) or a value (for regression). Decision Trees are known for their simplicity and interpretability.
Random Forest
Random Forest is an ensemble learning method used for classification and regression tasks. It builds multiple decision trees during training and outputs the class that is the mode (most frequent) of the classes or the mean prediction of the individual trees. The key features of Random Forest are its robustness and its ability to handle large datasets with high-dimensionality. The randomness introduced in the model helps in reducing overfitting and improves generalization.
AdaBoost and XGBoost
To increase accuracy, ensemble learning combines machine learning models. AdaBoost combines ineffective classifiers to get a strong one. Iteratively training them, it modifies instance weights for challenging classifications. This procedure sharpens attention on difficult cases, guaranteeing precise forecasts even on intricate situations, as Fig. 2 illustrates.
Fig. 2.

Working of AdaBoost.
Pseudocode for AdaBoost.
Initialize weights for all training examples.
-
Iterate over the number of boosting rounds (T):
- Train a weak learner on the current weighted dataset.
- Calculate the weak learner’s weighted error rate.
- Calculate the weak learner’s weight in the final ensemble.
- Update example weights based on the weak learner’s performance.
- Normalize example weights.
Combine weak learners into a strong classifier.
Make predictions using the weighted combination of weak learners.
Evaluate the ensemble’s performance.
Repeat Steps 2–5 until convergence or a predeterminednumber of rounds (T) is reached.
Gradient boosting is a popular technique in machine learning that works by combining multiple weak models in order to create a stronger model. XGBoost, short for “Extreme Gradient Boosting”, is an open-source library that implements gradient boosting and has become a popular choice for many machine learning practitioners. In XGBoost, each iteration of the algorithm adds a new weak model to the ensemble. The weak model is trained to minimize the residual error of the current ensemble, and its predictions are combined with those of the previous models to produce the final prediction. Figure 3 depicts the working process of XGBoost.
Fig. 3.

Working of XGBoost.
Pseudocode for XGBoost.
Initialize weights for all training examples.
-
Iterate over the number of boosting rounds (T):
- Train a weak learner on the current weighted dataset.
- Calculate the weak learner’s weighted error rate.
- Calculate the weak learner’s weight in the final ensemble.
- Update example weights based on the weak learner’s performance.
- Normalize example weights.
Combine weak learners into a strong classifier.
Make predictions using the weighted combination of weak learners.
Evaluate the ensemble’s performance.
Repeat Steps 2–5 until convergence or a predetermined number of rounds (T) is reached.
Ensembling of AdaBoost and XGBoost
A machine learning technique called ensemble model integrates numerous models into a single, more accurate predictive model. The reduction of bias and variance is the primary goal of ensemble approaches. In comparison to a single model, ensembles can assist increase the accuracy of predictions. There are numerous ways to build ensemble models, including blending, bagging, stacking, and boosting. Getting constituent models with various types of flaws is the fundamental difficulty in creating ensemble models. To improve the performance of the ensemble model, tuning can be done on the hyperparameters. By pooling the predictions of various models, ensemble approaches for classification seek to increase the single estimator’s robustness and generalizability32,33.
Results
Results for visualization
The study visualizes data attributes through various plots like histograms, density distributions, box plots, pair plots, and heatmaps to understand data characteristics. Visualization aids in revealing hidden relationships, trends, and patterns, enhancing data comprehension. Visualization reveals data skewness, kurtosis, and outlier presence, necessitating outlier removal methods. Figure 4 display attribute histograms and boxplots, respectively, highlighting density distribution and outlier presence, prompting necessary outlier removal techniques. Through visualization, data characteristics and correlations are examined, aiding in informed decision-making for data analysis and model development.
Fig. 4.

Histogram of all attributes.
Results for SMOTE
The issue with unbalanced datasets is that machine learning algorithms frequently favor the majority class, which has the negative effect of making minority class predictions less accurate. This is because having observed more instances of the majority class, the algorithm tends to predict it more frequently. This might be a problem when trying to diagnose diseases, for example, since it is crucial to correctly identify the minority class. Implementing SMOTE can boost the dataset’s representation of minority class cases, facilitating algorithm learning and enhancing prediction accuracy for the minority class. This method has been proven to work well. After applying SMOTE to our dataset, both the classes diabetes and non-diabetes seem to be balanced. This can be visualized in Fig. 5.
Fig. 5.

Outcome distribution before SMOTE and after SMOTE.
Results for preprocessing
In this work, some of the preprocessing techniques like missing values imputation, feature selection, and outlier rejection are employed to remove the noise in the data. Due to outlier rejection, the data size was reduced to 829 records. After preprocessing, the data is standardized and normalized to improve the accuracy of the model. Figure 6, displays the heatmap before and after preprocessing.
Fig. 6.

Heatmap of the data before and after outlier rejection.
Results for ML models
To assess different ML models, performance metrics such as AUC, precision, F1 score, recall, and classification accuracy have been utilized.A ROC (Receiver Operating Characteristic) curve plots the True Positive Rate/Precision (TPR) against the False Positive Rate (FPR) for various classification thresholds. The AUC quantifies the total area beneath the ROC curve, providing a single. Sensitivity/Recall measures the proportion of actual positives that are correctly identified by the model. The measures are stated in equations.
 |
 |
 |
 |
where  indicates that both the result and the model’s predictions are positive.
  denotes the model’s positive prediction, but the outcome is negative.
  states that both the result and the model’s prediction are negative.
  stands for the model’s predicted negative yet positive outcome.
Results for ensemble model
The same performance metrics that have been used to assess the ML models have been used in evaluating the ensemble classifier. Figure 7a–g shows the ROC Curve for the ML classifiers. Figure 8 depicts the ROC curve of the ensemble classifier (AdaBoost and XGBoost).Diabetes was classified using the given PID dataset with many machine learning models and boosting classifiers like AdaBoost and XGBoost, and the results show that the XGBoost model performs better than any other model in five out of six situations (Refer Table 3). XGBoost outperformed other models with AUC and Accuracy as  and
and  respectively. Then the ensembling of both AdaBoost and XGBoost is implemented which outperforms the individual classifiers in three out of four with AUC and Accuracy 0.968
 0.015 and 0.904
 0.023 respectively.
Fig. 7.
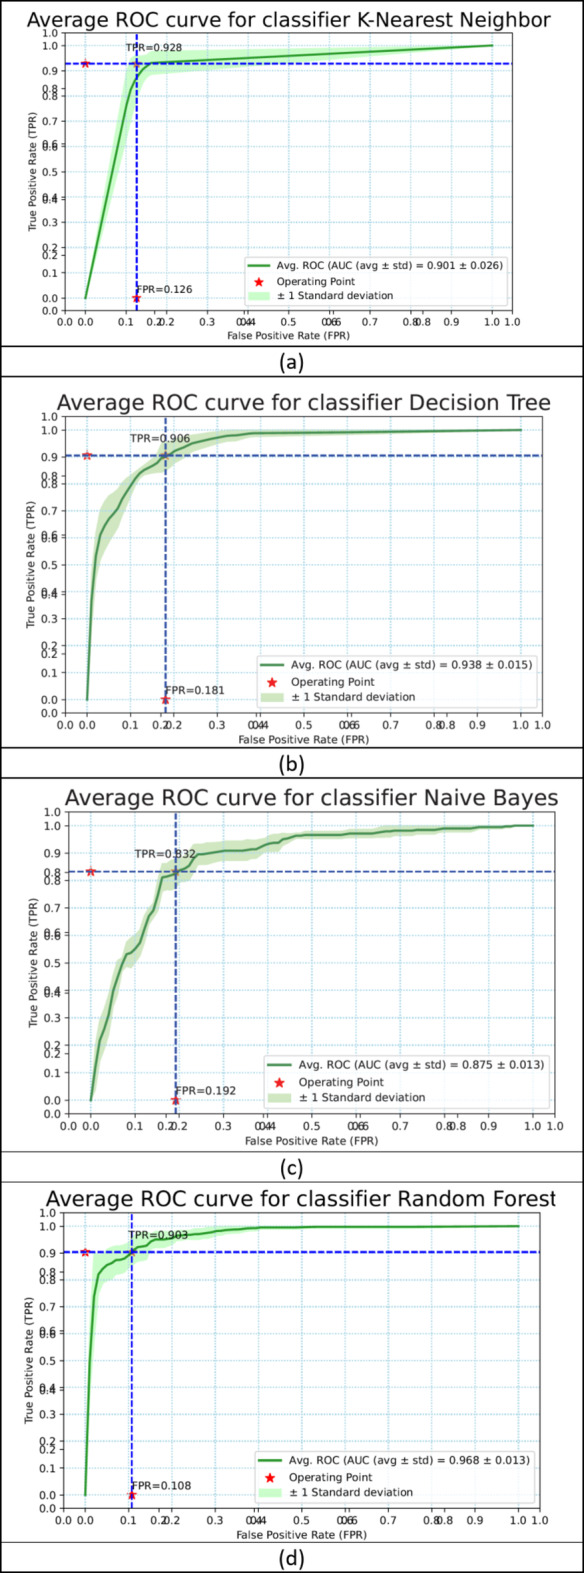
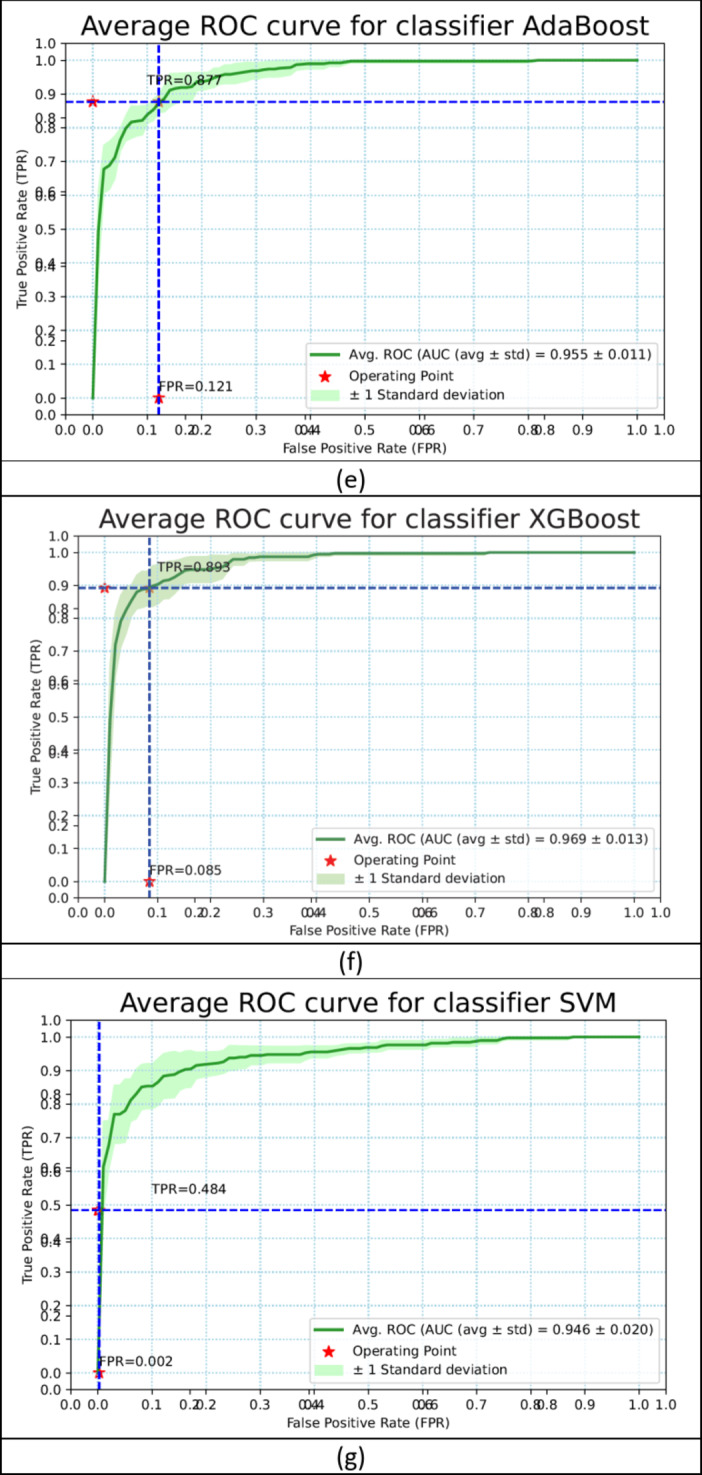
The ROC curve of the ML classifiers (a–g).
Fig. 8.

The ROC curve of the ensemble classifier (AdaBoost + XGBoost).
Table 3.
Comparison of the performance of all the classifiers implemented.
| Classifier | AUC (Avg ± Std) | Accuracy (Avg ± Std) | Sensitivity | Precision | Specificity | False Omission Rate | Diagnostic Odds Ratio |
|---|---|---|---|---|---|---|---|
| K-Nearest Neighbor | 0.898 ± 0.035 | 0.881 ± 0.025 | 0.898 | 0.859 | 0.866 | 0.097 | 56.850 |
| Decision Tree | 0.938 ± 0.007 | 0.867 ± 0.011 | 0.868 | 0.855 | 0.866 | 0.122 | 42.512 |
| Naïve Bayes | 0.867 ± 0.023 | 0.803 ± 0.022 | 0.796 | 0.790 | 0.810 | 0.184 | 16.634 |
| Random Forest | 0.963 ± 0.009 | 0.875 ± 0.018 | 0.883 | 0.883 | 0.893 | 0.107 | 63.140 |
| AdaBoost | 0.950 ± 0.007 | 0.865 ± 0.013 | 0.855 | 0.860 | 0.873 | 0.131 | 40.657 |
| XGBoost | 0.962 ± 0.012 | 0.901 ± 0.016 | 0.895 | 0.895 | 0.906 | 0.094 | 82.686 |
| AdaBoost + XGBoost | 0.968 ± 0.015 | 0.904 ± 0.023 | 0.897 | 0.902 | 0.911 | 0.093 | 89.108 |
Comparison of results
By analyzing all the results, ensembling AdaBoost and XGBoost has given the best AUC value of 0.968 ± 0.015 and accuracy of 0.904 ± 0.023. This highlights the robustness and superior performance of the ensemble approach compared to individual classifiers. The below figure represents the comparison of the performance metrics between all the models described. Figure 8 shows the ROC curve of the ensemble classifier (AdaBoost + XGBoost).
Figure 9 demonstrates the comparison of the evaluation metrics using a bar chart. Table 3 shows the comparison of the proposed algorithm with the existing state-of-the-art algorithms, underscoring the effectiveness of our methodology.
Fig. 9.

Comparison of the evaluation metrics using bar chart.
Conclusion
Millions of individuals worldwide are being fatally suffered by diabetes at an increasing rate. Our study successfully achieved the objective of predicting diabetes early using lifestyle and biological factors. Through comprehensive data analysis of patients’ lifestyles, we developed a robust framework that enhances prediction accuracy. We conducted extensive preprocessing and exploratory data analysis (EDA), including imputing missing values, identifying and rejecting outliers, and balancing classes using SMOTE. These steps were critical for maintaining dataset quality and improving prediction accuracy. The results on the PIMA Indian Dataset were compared with previous methodologies, as shown in Table 3. By combining AdaBoost and XGBoost, we achieved superior performance with an AUC of 0.968 and an accuracy of 0.904.
We chose a structured data set for the study, however, unstructured data will be taken into consideration in the future, which is a limitation. The models can be used to forecast cancer, Parkinson’s disease, heart disease, and COVID-19, or they can be recommended to other healthcare areas. The research’s wider depth includes considering additional characteristics for predicting diabetes, such as a family history of the disease, a habit of smoking or drinking, or a lack of physical activity.
Author contributions
CRediT authorship contribution statement: Pradeepa Sampath, Gurupriya Elangovan, Kaaveya Ravichandran, Vimal Shanmuganathan, Subbulakshmi Pasupathi, Tulika Chakrabarti, Prasun Chakrabarti, and Martin Margala8Pradeepa Sampath: Writing - original draft, Writing - review & editing Conceptualization, Data curation, Validation. Gurupriya Elangovan: Writing - original draft, Writing - review & editing, Conceptualization, Formal analysis, Supervision. Kaaveya Ravichandran: Conceptualization, Writing - original draft, Formal analysis, Supervision, Vimal Shanmuganathan: Conceptualization, Formal analysis, Writing - review & editing, Supervision. Subbulakshmi Pasupathi: Conceptualization, Formal analysis, Writing - review & editing, SupervisionTulika Chakrabarti: Conceptualization, Formal analysis, SupervisionPrasun Chakrabarti: Conceptualization, Formal analysis, SupervisionMartin Margala: Conceptualization, Formal analysis, Supervision and Funding.
Data availability
The data that support the findings of this study are publicly available online at Pima Indians Diabetes Dataset. (https://www.kaggle.com/code/rahulharlalka/pima-indians-diabetes-dataset-model/input1)
Declarations
Ethical approval
This article does not contain any studies with human participants or animals performed by any of the authors.
Competing interests
The authors declare no competing interests.
Footnotes
Publisher’s note
Springer Nature remains neutral with regard to jurisdictional claims in published maps and institutional affiliations.
Contributor Information
Vimal Shanmuganathan, Email: svimalphd@gmail.com.
Martin Margala, Email: martin.margala@louisiana.edu.
References
- 1.Misra, A. et al. Diabetes in developing countries. J. Diabetes. 11(7), 522–539. 10.1111/1753-0407.12913 (2019). [DOI] [PubMed] [Google Scholar]
- 2.Jensen, J. K. Risk prediction: are we there yet? Circulation. 134, 1441–1443. 10.1161/CIRCULATIONAHA.116.024941 (2016). [DOI] [PubMed] [Google Scholar]
- 3.Chou, C. Y., Hsu, D. Y. & Chou, C. H. Predicting the onset of diabetes with machine learning methods. J. Pers. Med.13(3). 10.3390/jpm13030406 (2023). [DOI] [PMC free article] [PubMed]
- 4.Hasan, M. K., Alam, M. A., Das, D., Hossain, E. & Hasan, M. Diabetes prediction using ensembling of different machine learning classifiers. IEEE Access.8, 76516–76531. 10.1109/ACCESS.2020.2989857 (2020). [Google Scholar]
- 5.Azad, C. et al. Prediction model using SMOTE, genetic algorithm and decision tree (PMSGD) for classification of diabetes mellitus. Multimed Syst.28(4), 1289–1307. 10.1007/s00530-021-00817-2 (2022). [Google Scholar]
- 6.Ganie, S. M., Pramanik, P. K. D., Bashir Malik, M., Mallik, S. & Qin, H. An ensemble learning approach for diabetes prediction using boosting techniques. Front. Genet.14, 1–15. 10.3389/fgene.2023.1252159 (2023). [DOI] [PMC free article] [PubMed] [Google Scholar]
- 7.Kaul, S. & Kumar, Y. Artificial Intelligence-based Learning techniques for diabetes prediction: challenges and systematic review. SN Comput. Sci.1(6), 1–7. 10.1007/s42979-020-00337-2 (2020). [Google Scholar]
- 8.Saxena, R. & Gupta, S. K. S. M. Role of K-nearest neighbour in detection of diabetes mellitus. Turkish J. Comput. Math. Educ.12(10), 373–376 (2021). [Google Scholar]
- 9.Laila, U., Mahboob, K., Khan, A. W., Khan, F. & Taekeun, W. An ensemble approach to predict early-stage diabetes risk using machine learning: an empirical study. Sensors. 22, 1–15. 10.3390/s22145247 (2022). [DOI] [PMC free article] [PubMed] [Google Scholar]
- 10.Dutta, A. et al. Early prediction of diabetes using an ensemble of machine learning models. Int. J. Environ. Res. Public. Health. 19, 1–25. 10.3390/ijerph191912378 (2022). [DOI] [PMC free article] [PubMed] [Google Scholar]
- 11.Hasan, M. K. et al. Missing value imputation affects the performance of machine learning: a review and analysis of the literature (2010–2021). Inf. Med. Unlocked. 27, 100799. 10.1016/j.imu.2021.100799 (2021). [Google Scholar]
- 12.Sisodia, D. & Sisodia, D. S. Prediction of Diabetes using Classification Algorithms, Procedia Comput. Sci., 132(Iccids), 1578–1585 10.1016/j.procs.2018.05.122 (2018).
- 13.Maniruzzaman, M. et al. Accurate diabetes risk stratification using machine learning: role of missing value and outliers. J. Med. Syst.42(5), 1–17. 10.1007/s10916-018-0940-7 (2018). [DOI] [PMC free article] [PubMed] [Google Scholar]
- 14.Maniruzzaman, M. et al. Comparative approaches for classification of diabetes mellitus data: machine learning paradigm. Comput. Methods Programs Biomed.152, 23–34. 10.1016/j.cmpb.2017.09.004 (2017). [DOI] [PubMed] [Google Scholar]
- 15.Nai-Arun, N. & Moungmai, R. Comparison of classifiers for the risk of diabetes prediction. Procedia Comput. Sci.69, 132–142. 10.1016/j.procs.2015.10.014 (2015). [Google Scholar]
- 16.Chang, V., Bailey, J., Xu, Q. A. & Sun, Z. Pima indians diabetes mellitus classification based on machine learning (ML) algorithms. Neural Comput. Appl. 0123456789 10.1007/s00521-022-07049-z (2022). [DOI] [PMC free article] [PubMed]
- 17.Naz, H. & Ahuja, S. Deep learning approach for diabetes prediction using PIMA Indian dataset. J. Diabetes Metab. Disord. 19(1), 391–403. 10.1007/s40200-020-00520-5 (2020). [DOI] [PMC free article] [PubMed] [Google Scholar]
- 18.Suryadevara, C. K. Issue 4 diabetes risk assessment using machine learning: a comparative study of classification algorithms. Int. Eng. J. Res. Dev.8(4), 1–10 (2023). [Google Scholar]
- 19.Jose, R., Syed, F., Thomas, A. & Toma, M. Cardiovascular health management in diabetic patients with machine-learning-driven predictions and interventions. Appl. Sci.14(5). 10.3390/app14052132 (2024). [DOI] [PubMed]
- 20.Agliata, A. et al. Machine learning as a support for the diagnosis of type 2 diabetes. Int. J. Mol. Sci.24(7). 10.3390/ijms24076775 (2023). [DOI] [PMC free article] [PubMed]
- 21.Kurt, B. et al. Prediction of gestational diabetes using deep learning and bayesian optimization and traditional machine learning techniques. Med. Biol. Eng. Comput.61, 1649–1660. 10.1007/s11517-023-02800-7 (2023). [DOI] [PMC free article] [PubMed] [Google Scholar]
- 22.Aguilera-Venegas, G., López-Molina, A., Rojo-Martínez, G. & Galán-García, J. L. Comparing and tuning machine learning algorithms to predict type 2 diabetes mellitus. J. Comput. Appl. Math.427, 115115. 10.1016/j.cam.2023.115115 (2023). [Google Scholar]
- 23.I.Olufemi, C., Obunadike, A., Adefabi & Abimbola, D. Application of logistic regression model in prediction of early diabetes across United States. Int. J. Sci. Manag Res.06(05), 34–48. 10.37502/ijsmr.2023.6502 (2023). [Google Scholar]
- 24.Kovács, B., Tinya, F., Németh, C. & Ódor, P. Unfolding the effects of different forestry treatments on microclimate in oak forests: results of a 4-yr experiment. Ecol. Appl.30(2), 321–357. 10.1002/eap.2043 (2020). [DOI] [PMC free article] [PubMed] [Google Scholar]
- 25.Bansal, R., Gaur, N. & Singh, S. N. Outlier detection: applications and techniques in data mining. In Proc. 6th Int. Conf. - Cloud Syst. Big Data Eng. Conflu. 2016, 2016, 373–377 10.1109/CONFLUENCE.2016.7508146 (2016).
- 26.An, J. et al. The importance of outlier rejection and significant explanatory variable selection for pinot noir wine soft sensor development. Curr. Res. Food Sci.6, 100514. 10.1016/j.crfs.2023.100514 (2023). [DOI] [PMC free article] [PubMed] [Google Scholar]
- 27.Ganie, S. M. & Malik, M. B. An ensemble machine learning approach for predicting Type-II diabetes mellitus based on lifestyle indicators. Healthc. Anal.2, 100092. 10.1016/j.health.2022.100092 (2022). [Google Scholar]
- 28.Howlader, K. C. et al. Machine learning models for classification and identification of significant attributes to detect type 2 diabetes. Heal Inf. Sci. Syst.10(1), 1–13. 10.1007/s13755-021-00168-2 (2022). [DOI] [PMC free article] [PubMed] [Google Scholar]
- 29.Arlot, S. & Celisse, A. A survey of cross-validation procedures for model selection. Stat. Surv.4, 40–79. 10.1214/09-SS054 (2010). [Google Scholar]
- 30.Shankar, R. S., Raju, V. S., Murthy, K. V. & Ravibabu, D. Optimized model for predicting gestational diabetes using ML techniques. In 2021 5th International Conference on Electronics, Communication and Aerospace Technology (ICECA), 1623–1629 (IEEE, 2021).
- 31.Reddy, S. S., Sethi, N., Rajender, R. & Mahesh, G. Forecasting diabetes correlated non-alcoholic fatty liver disease by exploiting Naïve Bayes Tree. EAI Endorsed Trans. Scalable Inform. Syst.10(1), e2 (2023). [Google Scholar]
- 32.Reddy, S. S., Sethi, N., Rajender, R. & Vetukuri, V. S. Non-invasive diagnosis of diabetes using chaotic features and genetic learning. In International Conference on Image Processing and Capsule Networks, 161–170 (Springer International Publishing, 2022).
- 33.Swaroop, C. R. et al. Optimizing diabetes prediction through Intelligent feature selection: a comparative analysis of Grey Wolf Optimization with AdaBoost and Ant Colony Optimization with XGBoost. In Algorithms in Advanced Artificial Intelligence: ICAAAI-2023. 8, 311 (2024).
Associated Data
This section collects any data citations, data availability statements, or supplementary materials included in this article.
Data Availability Statement
The data that support the findings of this study are publicly available online at Pima Indians Diabetes Dataset. (https://www.kaggle.com/code/rahulharlalka/pima-indians-diabetes-dataset-model/input1)