

Abstract
Understanding how canopy-scale photosynthesis responds to temperature is of paramount importance for realistic prediction of the likely impact of climate change on forest growth. The effects of temperature on leaf-scale photosynthesis have been extensively documented but data demonstrating the temperature response of canopy-scale photosynthesis are relatively rare, and the mechanisms that determine the response are not well quantified. Here, we compared leaf- and canopy-scale photosynthesis responses to temperature measured in a whole-tree chamber experiment and tested mechanisms that could explain the difference between leaf and crown scale temperature optima for photosynthesis. We hypothesized that (i) there is a large contribution of non-light saturated leaves to total crown photosynthesis, (ii) photosynthetic component processes vary vertically through the canopy following the gradient in incident light and (iii) seasonal temperature acclimation of photosynthetic biochemistry has a significant role in determining the overall temperature response of canopy photosynthesis. We tested these hypotheses using three models of canopy radiation interception and photosynthesis parameterized with leaf-level physiological data and estimates of canopy leaf area. Our results identified the influence of non-light saturated leaves as a key determinant of the lower temperature optimum of canopy photosynthesis, which reduced the temperature optimum of canopy photosynthesis by 6–8 °C compared with the leaf scale. Further, we demonstrate the importance of accounting for within-canopy variation and seasonal temperature acclimation of photosynthetic biochemistry in determining the magnitude of canopy photosynthesis. Overall, our study identifies key processes that need to be incorporated in terrestrial biosphere models to accurately predict temperature responses of whole-tree photosynthesis.
Keywords: model-data comparison; Eucalyptus tereticornis, temperature optimum; terrestrial biosphere models; forests
Introduction
Terrestrial Biosphere Models (TBMs) provide the foundation for predicting the fate of global forests in response to climate change (Zaehle et al. 2005, Medlyn et al. 2011, Rogers et al. 2017). Plant photosynthesis is one of the key processes in TBMs (Lombardozzi et al. 2015, Smith and Dukes 2017, Kumarathunge et al. 2019), meaning that robust representation of photosynthesis and its temperature response within TBMs is important for realistic prediction of the likely impact of climate change on forest growth, carbon sequestration and land–atmosphere feedback (Medlyn et al. 2015, Kala et al. 2016; D’Orangeville et al. 2018). Terrestrial Biosphere Models mechanistically represent plant photosynthesis and its response to temperature using parameterizations derived from data measured on individual leaves (Clark et al. 2011). The scaling of temperature responses from leaves to canopies determines the model projections of gross primary productivity of terrestrial ecosystems in response to warming (Huang et al. 2019). In many current TBMs, the temperature response of leaf- and canopy-scale photosynthesis are similar, with similar temperature optima (Rogers et al. 2017; Figure 1a). However, it is unclear whether this scaling of the photosynthetic temperature response from leaf to canopy in TBMs is correct as there is a dearth of empirical evidence on how leaf and canopy photosynthetic temperature responses compare. Further, the mechanisms that determine the photosynthetic temperature responses at canopy scale are not well understood, making it challenging to accurately represent canopy photosynthesis in TBMs.
Figure 1.

(a) The optimum temperature for leaf level and canopy level photosynthesis for eight models following Rogers et al. (2017). Model simulations were carried out under saturating irradiance level of 1500 μmol m−2 s−1 and vapour pressure deficit (VPD) of 1 kPa. The maximum carboxylation rate of Rubisco at 25 °C (Vcmax25) was 60 μmol m−2 s−1. Leaf area index was fixed at 3. Data for models BETHY, CLM, ED2, GDAY, JSBACH, JULES and OCN were obtained from Rogers et al. (2017); the CABLE model was run independently following the same protocol. (b) The temperature responses predicted by the Farquhar et al. (1980) photosynthesis model at light levels of 1500 and 200 umol m−2 s−1. Model simulations were carried out under two irradiance levels; 1500 and 200 μmol m−2 s−1 and vapour pressure deficit (VPD) of 1 kPa. The maximum carboxylation rate of Rubisco at 25 °C (Vcmax25) was 60 μmol m−2 s−1. The filled circles in panels (b) depicts the temperature optimum of leaf level photosynthesis.
The typical relationship between temperature and net photosynthesis at the leaf scale (Anet) is parabolic, where Anet is maximal at the optimum temperature (ToptA) and is lower at temperatures either below or above the ToptA (Battaglia et al. 1996, Gunderson et al. 2009, Crous et al. 2013, 2022). The ToptA of most C3 terrestrial plants ranges from 16 to 32 °C, and correlates well with the temperature of the growth environment (Kumarathunge et al. 2019, Crous et al. 2022). However, direct measurements of the temperature response of canopy scale photosynthesis are relatively rare. Several authors have used eddy covariance derived gross primary productivity data to quantify the temperature response of canopy photosynthesis (Niu et al. 2012; Tan et al. 2017; Huang et al. 2019). Using data from globally distributed eddy covariance sites, Niu et al. (2012) showed that the temperature response of net ecosystem exchange of different ecosystems followed a peak curve, with the optimum temperature ranging from 9 to 22 °C. The temperature response of net ecosystem exchange differs between cool- and warm-climate forests. In a high-elevation subalpine forest, the temperature optimum of net ecosystem exchange varied between 8 to 12 °C (Huxman et al. 2003). In comparison, Tan et al. (2017) reported that the temperature optimum for ecosystem scale photosynthesis for tropical forests ranged from 24 to 28 °C. These optimum temperatures for ecosystem-scale derived photosynthesis are often lower than the temperature optima for leaf-scale photosynthesis reported for the same species or plant functional type in a global analysis (Kumarathunge et al. 2019). For example, the temperature optimum for ecosystem scale photosynthesis of Arctic tundra reported by Huang et al. (2019) was at least 3 °C lower than the leaf level optimum reported by Kumarathunge et al. (2019). Similarly, temperature optima values reported by Tan et al. (2017) for Amazonian rain forest were 3 to 8 °C lower than the leaf level optima reported for the same forest by Kumarathunge et al. (2019). Crucially, the eddy covariance method has several limitations as it is not a direct measurement of canopy-scale gross primary productivity (Baldocchi 2003). Factors such as the temperature-dependence of soil respiration and water vapour pressure deficit may confound the resolution of temperature response functions of canopy scale photosynthesis derived from eddy covariance techniques (Bennett et al. 2021).
Whole-tree chambers (WTCs) overcome some limitations of the eddy covariance method by directly measuring crown scale photosynthesis (Medhurst et al. 2006; Barton et al. 2010). Whole-tree chambers directly measure the net flux of CO2 exchange between the entire tree crown and the surrounding air isolating the canopy gas exchange from CO2 evolved from the soil (Barton et al. 2012). Additionally, WTCs precisely control air temperature and relative humidity, which effectively minimizes the confounding effects of other temperature dependent factors such as VPD on the temperature response of canopy photosynthesis. Using data measured in a WTC experiment, Drake et al. (2016) reported that canopy-scale photosynthetic rates of Eucalyptus tereticornis trees measured at saturating incident light levels declined with increasing air temperature. There was no observable optimum temperature, but the data showed that this ToptA must have been lower than 16 °C (Drake et al. 2016). However, Duursma et al. (2014) reported that the optimum temperature for canopy-level photosynthesis of Eucalyptus saligna trees grown in WTCs was c. 22 °C which was lower than the leaf-level optimum temperature for photosynthesis (~25 °C) of the same trees.
There are several potential explanations for the observed difference between the temperature optima for photosynthesis at leaf- and canopy-scales. Firstly, it can be hypothesized that the lower temperature optimum of canopy photosynthesis, as observed in WTC experiments, is due to the contribution of non-light saturated leaves to the total canopy photosynthesis. Below light saturation, the rate of photosynthesis is related to the quantum yield, which declines monotonically with increasing temperature in C3 plants photosynthesis (Ehleringer and Björkman 1977, McMurtrie and Wang 1993). Figure 1b shows the temperature responses predicted by the Farquhar et al. (1980) photosynthesis model at light levels of 1500 and 200 μmol m−2 s−1. Due to self-shading and shading by neighbouring trees, much of the leaf area of a given tree canopy carries out photosynthesis at sub-saturating light levels (Ellsworth and Reich 1993), and hence the total canopy photosynthesis can be dominated by non-light saturated leaves, resulting in a lower temperature optimum.
Secondly, several studies provide evidence for significant differences in photosynthetic properties along the vertical axis of individual tree canopies following a gradient in light, including irradiance responses (Kull and Niinemets 1998; Kull and Kruijt 1999; Kull et al. 1999, Ranasinghe et al. 2015, Slot et al. 2018), photosynthetic biochemical properties (Carswell et al. 2000, Campany et al., 2016) and leaf maintenance respiration rates (Meir and Grace 2002; Weerasinghe et al. 2014). Hence, it can be hypothesized that the temperature optimum for photosynthesis is different between shade leaves and upper canopy sun-lit leaves of the same tree. If the contribution from shade leaves in a given canopy is significant, the temperature optimum for total canopy photosynthesis could be lower than the temperature optimum of upper canopy leaves. While the effect of lower maximum photosynthetic rates in the lower canopy has been explored (Kull and Kruijt 1999; Mercado et al. 2011; Mercado et al. 2009; Crous et al. 2021), the impact on the canopy temperature response has not been investigated (but see Hernandez et al 2020).
Additionally, it can be hypothesized that the observed decline in canopy photosynthesis with increasing temperature over several seasons, as observed, for example, in E. tereticornis trees (Drake et al. 2016) could be partly due to thermal acclimation of photosynthesis (Lin et al. 2012). Given the strong evidence for thermal acclimation of leaf photosynthesis (Medlyn et al. 2002b, Kattge and Knorr 2007; Way and Sage 2008; Crous et al. 2013, Lin et al. 2013, Way and Yamori 2014, Yamori et al. 2014, Yamaguchi et al. 2016, Crous et al. 2022), it is possible that longer-term effects of growth temperature on photosynthetic biochemistry could contribute to the overall temperature response of canopy photosynthesis constructed by aggregating measurements over time (e.g., Drake et al. 2016). Several studies have reported the consequences of incorporating thermal acclimation of photosynthesis into TBM for model predictions, showing improved ability to reproduce observed net ecosystem CO2 exchange (Lombardozzi et al. 2015, Smith et al. 2016, Mercado et al. 2018).
Given the need for robust quantification of photosynthetic temperature response at the canopy scale and its importance in predicting future forest and global carbon budgets, we designed this study to compare leaf- and canopy-scale temperature optima for photosynthesis. We used data from a WTC facility that measures whole-canopy photosynthesis at high temporal resolution across several seasons. We hypothesized that the observed difference between the temperature optimum for canopy and leaf photosynthesis is mainly due to the large contribution of non-light saturated leaves to total canopy photosynthesis. Additionally, we hypothesized that within-canopy gradients and seasonal temperature acclimation of photosynthetic biochemistry have a significant role in determining the temperature response of canopy photosynthesis. We tested these hypotheses using models of canopy radiation interception and photosynthesis, parameterized with leaf-level physiological data, estimates of canopy leaf area and tree dimensions. We applied the models under several different assumptions to predict whole-tree photosynthesis and evaluated the results against direct measurements of whole-tree photosynthetic flux. Our primary objective was to examine which mechanisms need to be incorporated into a model to accurately capture the temperature response of canopy photosynthesis.
Materials and methods
Whole tree chamber experiment
This study was conducted at the Hawkesbury Forest Experiment (33.62 S, 150.74 E), Richmond NSW, Australia. A detailed description of the site climatology and soil characteristics can be found in Crous et al. (2013), Aspinwall et al. (2016) and Drake et al. (2016). Briefly, the site mean annual temperature is 17 °C and the mean annual rainfall is 800 mm. The soils are low to moderately fertile sandy loam with relatively low organic matter content (~0.7%). The site contains 12 WTCs that each enclose a single tree rooted in soil. The WTCs are cylindrical in shape with a conical shaped top (9 m tall, 3.25 m in diameter and 53 m3 in volume). These chambers precisely control atmospheric CO2 concentration, air temperature, and relative humidity while measuring the net CO2 and water flux between the tree crown and atmosphere (Barton et al. 2010, Duursma et al. 2014, Drake et al. 2016). A detailed technical description of the WTCs can be found in Barton et al. (2010).
A single seedling of forest red gum (Eucalyptus tereticornis sp. tereticornis) was planted in the centre of each chamber on 12 March 2013. The air temperature of six chambers was set to track ambient temperature The remaining six chambers were set to track ambient temperature + 3 °C (i.e., the trees were warmed), but data from the elevated temperature treatment were not used in this analysis. Trees were watered fortnightly to keep them well-watered.
Measurement of canopy net photosynthesis
Six months after the seedlings were planted, a suspended transparent plastic floor was installed at a height of 45 cm from the soil surface inside each chamber in order to isolate the canopy CO2 and H2O fluxes from fluxes evolved from the soil. At this time, trees in the ambient temperature treatment averaged 3 m tall, with stem diameter at 65 cm height of 2.4 cm. Average total canopy leaf area of the trees was 3.3 m2 (Drake et al. 2016). Whole-tree net CO2 flux was measured within each chamber at 15-min intervals (Barton et al. 2010) throughout the period starting in the austral spring from 13 September 2013 (floor installed) to 26 May 2014 (final harvest started). Flux data were corrected for chamber leaks and missing data (~6% of the total) and were gap filled using an artificial neural network method driven by tree size and weather variables. A detailed description of the data gap filling is available in Drake et al. (2016).
Canopy photosynthesis simulation
We used three different leaf to canopy scaling approaches to test the stated hypotheses of this study. Firstly, we tested the ‘big-leaf’ approach (Table 1), where the tree crown was approximated as a single big leaf (Pury and Farquhar 1997). In this approach, photosynthetic capacity is assumed to decline through the canopy in proportion to the photosynthetically active radiation (PAR), allowing canopy photosynthesis to be calculated as a function of absorbed PAR (APAR) using the standard biochemical photosynthesis model of Farquhar et al. (1980) and the Medlyn et al. (2011) stomatal conductance model. Whole-canopy APAR was calculated as a function of incoming PAR and the fraction of incoming PAR (fPAR) absorbed by the tree leaf area. We calculated fPAR following Monsi and Saeki (1953) as
Table 1.
Model parameterization scenarios of tree canopy photosynthesis used in this study.
| Model | Parameterization scenario | Assumptions |
|---|---|---|
| B. Single big leaf approximation | B1 | Tree canopy assumed to behave as a single leaf. Leaf Vcmax and Jmax are scaled to the canopy accounting for leaf area index and light extinction by assuming that photosynthetic capacity is proportional to incident PAR. An iterative scheme is used to solve the leaf energy balance (Medlyn et al. 2007). Horizontal homogeneity assumed. |
| B2 | B1 + Leaf-level Vcmax and Jmax (at 25 °C) acclimate to seasonal changes in growth temperature. | |
| T. Two big leaf approximation | T1 | Tree canopy assumed to behave as two big leaves, sunlit and shaded. Leaf Vcmax and Jmax are assumed constant through the canopy). An iterative scheme is used to solve the leaf energy balance (Medlyn et al. 2007). Horizontal homogeneity assumed. |
| T2 | T1 + Leaf Vcmax and Jmax are scaled to the canopy accounting for leaf area index, canopy nitrogen and light extinction (Table 1, kn and kb parameters, respectively). Temperature response parameters of Vcmax and Jmax are assumed constant through the canopy. | |
| T3 | T2 + Leaf-level Vcmax and Jmax (at 25 °C) acclimate to seasonal changes in growth temperature. | |
| M. Multi-layer approximation | M1 | Individual crowns are represented. Each crown is divided into six layers with 12 gridpoints, making 72 sub-volumes. Radiation extinction, self-shading and shading by neighbouring trees are included in simulations. An iterative scheme is used to solve the leaf energy balance (Medlyn et al. 2007). Vcmax and Jmax are assumed constant through the six crown layers. |
| M2 | M1 + Leaf-level Vcmax and Jmax (at 25 °C) decline with crown depth following the values given in Figure S2 available as Supplementary data at Tree Physiology Online. Temperature response parameters of Vcmax and Jmax are assumed constant through the canopy. | |
| M3 | M2 + Leaf-level Vcmax and Jmax (at 25 °C) acclimate to seasonal changes in growth temperature. |
 |
(1) |
where LAI is the leaf area index and k is the canopy radiation extinction coefficient, here assumed to equal 0.5.
Secondly, we tested the ‘two-leaf’ approximation (Table 1) derived by Wang and Leuning (1998). In this approach, the tree crown is separated into a sunlit and shaded fraction, and the amount of PAR absorbed is calculated separately for the two canopy fractions. In the two-leaf model, the rate of decline of photosynthetic capacity with canopy depth is explicitly specified with an extinction coefficient on nitrogen in the canopy (kn parameter in Table 2). Both the big-leaf and two-leaf models were implemented in R (https://github.com/mdekauwe/two_leaf_at_WTC).
Table 2.
Parameter values used for simulating tree canopy photosynthesis in this study.
| Parameter | Definitions | Value | Units |
|---|---|---|---|
| V cmax25 | Maximum rate of Rubisco carboxylation | 103.6* | μmol m−2 s−1 |
| J max25 | potential rate of electron transport | 178.2* | μmol m−2 s−1 |
| Ea | Activation energy |
V
cmax: 59700 Jmax: 23800 |
J mol−1 |
| ΔS | Entropy factor |
V
cmax: 634 Jmax: 627 |
J mol−1 K−1 |
| Hd | Deactivation energy | 200,000 | J mol−1 |
| αJ | Quantum yield of electron transport rate on an absorbed-PAR basis | 0.26 | μmol mol −1 |
| θ J | Curvature of electron transport rate relationship with APAR | 0.57 | unitless |
| R L25 | Leaf respiration rate in light | 0.9 | μmol m−2 s−1 |
| Q10 | The proportional increase in Rday per 10 °C rise in temperature | 2.0 | unitless |
| g1 | A parameter related to the marginal water cost of carbon | 2.4 | kPa0.5 |
| Soil reflectance | % in three wavebands; PAR, NIR, thermal | 0.1, 0.3, 0.05 | unitless |
| Leaf reflectance | % in three wavebands; PAR, NIR, thermal | 0.093, 0.34, 0.01 | unitless |
| Leaf transmittance | % in three wavebands; PAR, NIR, thermal | 0.082, 0.49, 0.05 | unitless |
| kn (two-leaf model) | Extinction coefficient of nitrogen in the canopy | 0.3 | unitless |
| k b (two leaf model) | Light extinction coefficient | 0.5 | unitless |
*Values given are for the baseline model simulations.
These values were specified seasonally and for sun and shade leaves/different crown layers separately depending on the model simulation scenario given in Table 2.
Thirdly, we used a multilayer model, MAESTRA (https://maespa.github.io/), to simulate canopy photosynthesis. MAESTRA is an individual-tree based model of canopy CO2 flux and water balance, which calculates detailed radiation absorption, photosynthesis and transpiration of trees, growing individually or in a stand (Wang and Jarvis 1990; Duursma and Medlyn 2012). MAESTRA represents a forest canopy as an array of individual tree crowns. For each crown, spatial position (x and y co-ordinates), stem height, and several canopy metrics such as crown radius, height, leaf angle and one-sided leaf area can be specified (Duursma and Medlyn 2012). Each tree crown (target crown) is divided into several horizontal levels (typically six) and several grid points on each level, hence representing the target crown as an array of sub-volumes. For each grid point, MAESTRA calculates the sunlit and shaded fractions of leaf area, radiation transfer (PAR, NIR and long-wave), and direct and diffuse radiation fractions (Duursma and Medlyn 2012). The model calculates leaf net photosynthesis at each crown grid point using the standard biochemical photosynthesis model of Farquhar et al. (1980) and leaf-level stomatal conductance using the Medlyn et al. (2011) stomatal conductance model. Leaf temperature is calculated using an iterative approach following Medlyn et al. (2007). An exponential decline in photosynthetic capacity with canopy depth was approximated by specifying photosynthetic biochemical parameters Jmax and Vcmax for each of six canopy layers. The baseline parameter values used in these model simulations are given in Table 1.
Model parameterization
Meteorological data
We measured half hourly incident PAR, air temperature (Tair) and vapour pressure deficit (VPD) (Figure 2). Both Tair and VPD were directly measured inside the airspace of each chamber, while PAR was measured outside the chambers. A fixed ambient CO2 concentration of 400 µmol mol−1 (the WTC value) was assumed throughout the simulation period. The average daytime temperature and VPD during the canopy photosynthesis measurement period were 21.9 °C (range 13.6–31.4 °C) and 1.3 kPa (range 1.1–6.1 kPa), respectively.
Figure 2.

Meteorological data of the site during canopy photosynthesis measurement period: (a) daily mean air temperature (Tair), (b) daily mean vapour pressure deficit (D), (c) daily integrated photosynthetically active radiation (PAR). In panels (a) and (b), the shaded area depicts the daily maximum and minimum values.
Tree dimensions, canopy structure and leaf area
The total tree height, green crown height, height to crown base, tree diameter (at 65 cm above the soil surface) and crown radius in both north–south and east–west directions were measured fortnightly, throughout the canopy CO2 flux measurement period. Daily tree height increment for each tree was obtained by linearly interpolating the measured height (Drake et al. 2019). An individual-tree-specific allometric relationship was used to calculate the daily crown radius as a function of tree height. This model was developed and validated using the fortnightly measured crown width and tree height data (r2 = 0.99). Total crown leaf area of each tree was obtained from Drake et al. (2016). A detailed description of leaf area measurement and interpolation estimation can be found elsewhere (Barton et al. 2012, Drake et al. 2016).
The E. tereticornis crown was approximated as an upright cylinder and leaves were assumed to be randomly distributed within individual tree crowns. Leaf angles were assumed to be spherically distributed with five leaf angle classes. Crown leaf area density was assumed to be uniform and leaf clumping was not considered. Leaf reflectance and transmittance (400–700 nm waveband) values (Table 1) were obtained from measurements of E. saligna trees which were grown inside the same WTCs in a different experiment (Löw et al., unpublished data).
Leaf scale physiology
We characterized the optimum temperature of leaf photosynthesis using two different datasets. In both cases we used only data from the six trees measured at ambient growth temperature treatment (the elevated temperature treatment was excluded). First, leaf-level light saturated net photosynthetic rate (Asat) was measured at prevailing ambient temperatures at monthly time intervals throughout the canopy photosynthesis measurement period by Aspinwall et al. (2016), using LI-6400XT portable photosynthesis systems (Li-Cor Inc., Lincoln, NE, USA). Measurements were conducted between 10:00 a.m. and 2:00 p.m. on recent fully expanded sun-lit leaves (two or three replicate leaves per tree) at a PAR of 1500 μmol m−2 s−1 and a flow rate of 500 μmol s−1. The relative humidity inside the leaf chamber was maintained between 60–80% and the sample CO2 concentration at 400 ± 5 p.p.m. The average leaf to air vapour pressure deficit during the measurements was 1.3 kPa (range 0.7–2.7 kPa) and the values were well aligned with the average VPD of canopy scale photosynthesis measurements (1.3 kPa, range 1.1–6.1 kPa). Measurements were made on two to three replicate leaves per tree and averaged across leaves to obtain a mean value for each tree. Following Battaglia et al. (1996) we characterized the temperature response of leaf scale photosynthesis by fitting a quadratic model (Eq. 2) to these Asat measurements:
 |
(2) |
where Asat is the net photosynthetic rate (μmol m−2 s−1) at a given leaf temperature, T (°C),ToptA is the temperature optimum for photosynthesis (°C) Aopt is the net photosynthetic rate at ToptA, and the parameter b (unitless) describes the degree of curvature of the relationship. Throughout this work, we assume that leaf temperature was equivalent with the measured air temperature, which is consistent with the largely poikilothermic leaf temperatures observed for trees within this same WTC facility (Drake et al. 2020). We measured air temperature (T in Eq. 2) within each tree crown with duplicate, shielded, and aspirated thermistors (Dwyer RHP-2d2B, Michigan City, IN, USA and Mamac TE-702-A-12-A, Minneapolis, MN, USA) and assumed that canopy temperature is similar to the temperature of the surrounding air as there are strong evidence to support limited thermoregulation in leaf temperatures in Eucalyptus leaves (Drake et al. 2020). We estimated the parameters of Eq. 2 (i.e., Aopt, ToptA and b) in a non-linear mixed model framework (Zuur et al. 2009) using the nlme function within the nlme package in R version 3.5.1. Replicate WTCs were included as random effects in the model.
The second set of data consisted of photosynthetic–CO2 response curves (A/Ci). These were measured monthly on individual leaves at a standard leaf temperature of 25 °C between 10:00 a.m. and 2:00 p.m. on the same leaves used for Asat measurements under similar light intensity, flow rate and humidity conditions as for measurements of Asat by Aspinwall et al. (2016). In addition, A/Ci curves were measured on both upper canopy sun-lit leaves and lower canopy shade leaves (2–3 replicate leaves per tree) using the same method at a single time point (February 2014) by Campany et al. (2016). We used these A/Ci curves to estimate the maximum rate of Rubisco carboxylation (Vcmax) and the maximum rate of electron transport for RuBP regeneration under saturating light (Jmax) using the FvCB model (Duursma 2015). Furthermore, A/Ci curves were measured on upper canopy sun-lit leaves at five different leaf temperatures between 25 and 42 °C in three seasons, spring 2013, summer and autumn 2014. We used these data to characterize the instantaneous temperature response of Asat, Vcmax and Jmax. The temperature response of Asat was fitted using Eq. 2. The temperature responses of Vcmax and Jmax were fitted using the peaked Arrhenius function (Johnson et al. 1942):
 |
(3) |
where kTk is the process rate (i.e., Vcmax or Jmax;  mol m−2 s−1) at a given temperature, Tk (K), k25 is the process rate at 25 °C, R is the universal gas constant (8.314 J mol−1 K−1), and Ea (kJ mol−1) is the activation energy term that describes the exponential increase in enzyme activity with the increase in temperature, Hd (kJ mol−1) is the deactivation energy and ΔS (J mol−1 K−1) is the entropy term. To avoid over-parameterization, we assumed a fixed value of 200,000 J mol−1 for Hd in Eq. 3 for all trees (Dreyer et al. 2001, Medlyn et al. 2002a). We estimated the parameters of Eqn 3 (i.e., k25, Ea and ΔS) in a non-linear mixed model framework using replicate WTCs as random effects in the model.
Next, diurnally measured leaf-level photosynthesis measurements were used (see Drake et al. 2016 for a detailed description) to parameterize the stomatal conductance model. These measurements were conducted in five measurement campaigns from July 2013 to February 2014. Measurements were conducted at in-situ PAR, Tair and VPD conditions. We fitted the Medlyn et al. (2011) optimal stomatal conductance model to these data to estimate the stomatal conductance model parameters. We assumed zero minimum leaf conductance (g0) when fitting the stomatal conductance model (Duursma et al. 2018).
Finally, the estimated Vcmax and Jmax for upper canopy sun-lit leaves and lower canopy shade leaves at a single time point (as described above) were used to calculate the within-crown decline in Vcmax and Jmax in the multilayer model (Table 2). Here, we assumed that the first crown layer (crown depth = 1) is represented by the sun leaves and the sixth crown layer is represented by the shade leaves (crown depth = 6). We fitted an exponential relationship for Vcmax25 and Jmax25 with the crown depth. Based on this relationship, Vcmax25 and Jmax25 were calculated for each of the six crown layers (Figure S2a and b available as Supplementary data at Tree Physiology Online). In the two big-leaf model, the decline in photosynthetic capacity was specified using an extinction coefficient for nitrogen in the canopy, kn = 0.3 (Table 2) following Lloyd et al. (1995).
Model-data comparison and data analysis
The 15-min canopy CO2 flux measurements were averaged over hourly intervals following Duursma et al. (2014). For this analysis, the elevated temperature treatment was excluded and only data of the six trees measured at ambient growth temperatures were considered. Hence, the analysis includes a total of ~ 37,000 hourly canopy photosynthesis observations measured in six chambers over 6 months, then three chambers for the final 3 months when a drought treatment was implemented on half of the chambers. First, the ability of the three canopy scaling methods to reproduce measured hourly rates of canopy photosynthesis was evaluated, using linear regression analysis. Secondly, the temperature response of modelled canopy photosynthesis was characterized using a subset of hourly photosynthetic rates at saturating incident light levels (PAR >1200 μmol m−2 s−1) and compared with the temperature response of observed canopy photosynthesis using fitted general additive models. We considered canopy photosynthesis at saturating light levels to avoid any confounding effects of PAR on the temperature response. This subset of data spans across the day from 9 a.m. to 4 p.m. with most data concentrated during 10 a.m. to 2 p.m., well aligned with the time of leaf scale measurements (Figure S1 available as Supplementary data at Tree Physiology Online). Additionally, it allowed us to directly compare the temperature response of photosynthesis at the canopy scale with the leaf-scale response as the leaf-level temperature response was always measured at saturating light levels. We used general additive models to characterize the temperature response of canopy photosynthesis. General additive models use a data driven approach which does not assume a prior functional relationship between the variables (Rigby and Stasinopoulos 2005). We used the mgcv package in R version 3.5.1 (R Development Core Team 2018) to fit the general additive models. We included replicate WTCs as a random effect in the general additive models. Here, we considered the fitted and observed temperature response functions to be significantly different if the 95% confidence intervals were non overlapping. We used linear regression analysis to test the goodness of fit (i) between the measured and modelled hourly photosynthetic rates including all hourly net photosynthetic rates and (ii) subset of hourly net photosynthetic rates at saturating incident light levels (PAR >1200 μmol m−2 s−1). The datasets and the analysis code used for the entire analysis is publicly available through https://bitbucket.org/Kumarathunge/canscal.
Results
Optimum temperature for photosynthesis (ToptA)
Both the leaf-scale instantaneous photosynthetic temperature response (Figure 3a) and net photosynthesis measured at ambient air temperatures (Figure 3b) showed an optimum temperature within the measurement temperature range. The optimum temperature for light-saturated leaf photosynthesis estimated using instantaneous measurements (24.7 ± 1.4 °C; Figure 3a) was higher than the optimum temperature estimated from measurements at ambient air temperatures (22.1 ± 1.4 °C; Figure 3b), but the 95% CIs overlapped. Both values were above the mean daytime temperature during the experiment, which was 19.4 °C (SD 3.6 °C). In contrast, measured high-light (PAR >1200 μmol m−2 s−1) canopy-scale net photosynthesis (ACanopy; μmol m−2 s−1) declined monotonically with increasing canopy temperature (TCanopy; °C; Figure 3c) and is lower than the leaf-scale net photosynthesis at any measurement temperature. The data did not show an optimum temperature for canopy photosynthesis within the measured air temperature range. ACanopy approached zero when Tair was above 40 °C. Thus, the temperature optimum for the canopy photosynthesis of E. tereticornis trees in this experiment was at least 6–8 °C lower than the temperature optimum for light-saturated leaf net photosynthesis.
Figure 3.

The temperature response of photosynthesis at different measurement scales: (a) instantaneous temperature response of leaf photosynthesis, (b) leaf photosynthesis measured at in-situ ambient temperatures across several seasons and (c) whole-canopy photosynthesis. Filled circles in panels (a) and (b), leaf-level net photosynthesis averaged across 2–3 replicate leaves on E. tereticornis trees (n = 6) grown under ambient growth temperatures in whole-tree chambers and in panel (c) hourly rates of net photosynthesis at incident PAR > 1200 μmol m−2 s−1 expressed per unit crown leaf area (ACanopy) of the same trees (n = 6). Lines depict the fitted Eq. 2 in panels (a) and (b), general additive models in panel (c). The shaded area shows the 95% CI of predictions. Tcanopy is the measured air temperature within each tree crown with duplicate, shielded, and aspirated thermistors (Dwyer RHP-2d2B, Michigan City, IN, USA and Mamac TE-702-A-12-A, Minneapolis, MN, USA). The circle with error bars (±1SE) in panels (a) and (b) depicts the temperature optimum of leaf level photosynthesis.
Comparison of different leaf to canopy scaling models
We first modelled E. tereticornis canopy photosynthesis assuming that the tree canopy behaves as a single big-leaf (Scenario B1, Table 2 available as Supplementary data at Tree Physiology Online). This assumption was not able to accurately reproduce the measured canopy photosynthesis (Figure 4a). The model over-estimated canopy photosynthesis and had an incorrect temperature response for canopy photosynthesis at saturating PAR levels (Figure 4b). The modelled canopy photosynthesis showed an optimum temperature at ~25 °C, which was similar to the optimum temperature for leaf-scale photosynthesis estimated from instantaneous photosynthetic-temperature response measurements (Figure 4b).
Figure 4.
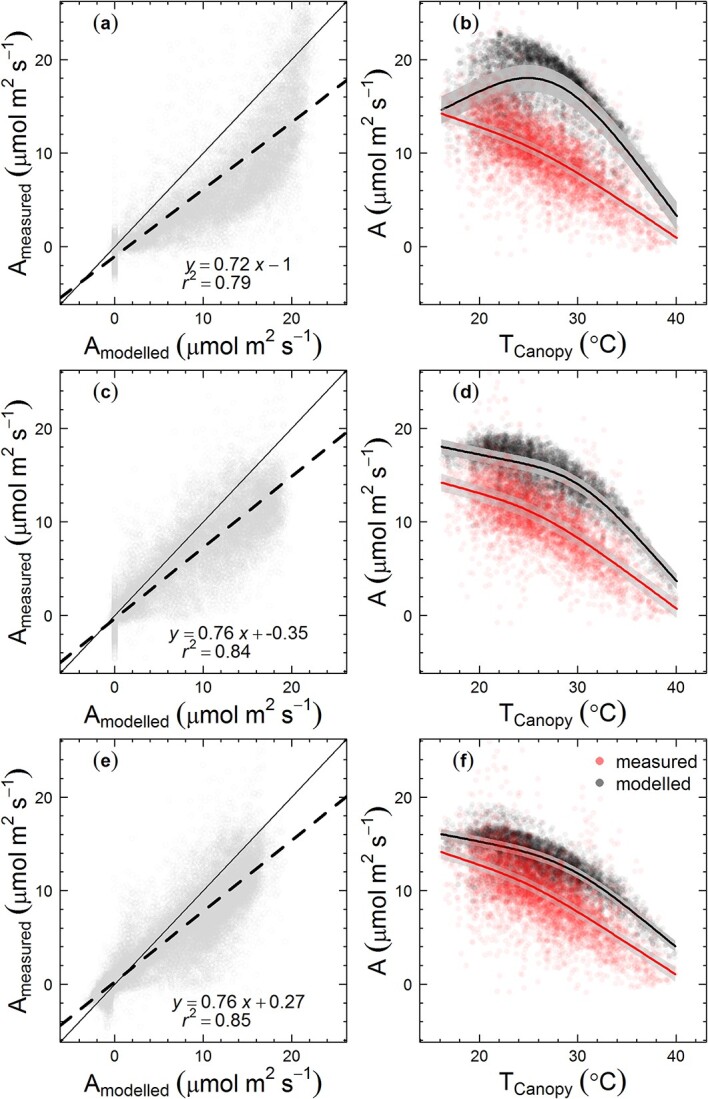
Measured vs modelled hourly rates of tree canopy net photosynthesis (Ameasured and Amodelled, respectively) and their temperature responses; (a) and (b) modelling the tree canopy as a single big leaf, (c) and (d) modelling the canopy as two big leaves (sunlit and shaded) and (e) and (f) modelling the tree canopy as multiple layers using MAESTRA (scenarios B1, T1, M1, respectively). Filled circles in panels (a), (c) and (e) depict daytime hourly net photosynthetic rates expressed per unit canopy leaf area at all PAR levels. Panels (b), (d) and (f) show hourly net photosynthetic rates at saturating light levels (PAR > 1200 μmol m−2 s−1), expressed per unit canopy leaf area. Dashed lines in panels (a), (c), (e) depict the fitted simple linear regression model and the continuous lines depict the 1:1 relationship. In panels (b), (d) and (f), lines depict the fitted general additive models with shaded areas showing the 95% CI of predictions. Results of the linear regression between the measured and modelled hourly photosynthetic rates at saturating incident light levels (PAR > 1200 μmol m−2 s−1) are given in Table 3.
Both the two big-leaf model and multilayer model (MAESTRA) with constant photosynthetic capacity (Scenarios T1, M1) showed a significant improvement in the predicted hourly canopy photosynthesis compared with the single big-leaf approximation (Figure 4c and f). The temperature response of modelled canopy photosynthesis in both the two big-leaf model and MAESTRA was much closer to the temperature response of measured canopy photosynthesis. The r2 values of the linear regression between the modelled and measured canopy photosynthesis at PAR >1200 μmol m−2 s−1 were 0.41 and 0.51 for two big-leaf model and MAESTRA, respectively. The RMSE value was decreased from 3.44 (single big leaf model) to 2.8 (two big-leaf model) and for MAESTRA, the RMSE was 2.53 (Table 3). However, for both the two big-leaf and multilayer models, there remained a systematic over-estimation in predicted canopy photosynthesis compared with the measurements at any given canopy temperature (Figure 4d).
Table 3.
Results of the linear regression analysis between measured and modelled tree canopy photosynthesis at PAR >1200 μmol m−2 s−1. Values in parentheses are standard errors of parameter estimates.
| Model | Parameterization | Intercept | Slope | r 2 | RMSE |
|---|---|---|---|---|---|
| Big leaf | B1—Baseline | 4.6 (0.23) | 0.33 (0.013) | 0.12 | 3.44 |
| B2—Seasonal acclimation in Vcmax and Jmax | 2.5 (0.22) | 0.48 (0.014) | 0.21 | 3.25 | |
| Two big-leaf | T1—Baseline | −1.9 (0.21) | 0.79 (0.014) | 0.41 | 2.80 |
| T2—Within canopy gradient in Vcmax and Jmax | −1.2 (0.21) | 0.8 (0.015) | 0.40 | 2.83 | |
| T3—Within canopy gradient and seasonal temperature acclimation in Vcmax and Jmax | 2.6 (0.17) | 0.53 (0.012) | 0.31 | 3.03 | |
| MAESTRA | M1—Baseline | −4 (0.19) | 1.1 (0.014) | 0.51 | 2.53 |
| M2—Within canopy gradient in Vcmax and Jmax | −3.5 (0.18) | 1.1 (0.014) | 0.52 | 2.51 | |
| M3—Within canopy gradient and seasonal temperature acclimation in Vcmax and Jmax | −0.24 (0.15) | 0.96 (0.014) | 0.59 | 1.80 |
Within-tree crown variation in photosynthetic biochemical parameters
A clear divergence in both Vcmax and Jmax was observed between sun and shade leaves (Figure 5). Both Vcmax and Jmax were higher for sun leaves compared with shade leaves (Figure 5, ANOVA; P < 0.05). Vcmax25 was 21% lower in shade leaves relative to the upper canopy sun leaves. Similarly, Jmax25 was 26% lower in shade leaves, similar to data from an independent study on the same species (Crous et al. 2021).
Figure 5.

The maximum rate of carboxylation by the enzyme ribulose-1,5-bisphosphate carboxylase-oxygenase (Vcmax; panel a) and the potential rate of electron transport (Jmax; panel b) of sun leaves and shade leaves of E. tereticornis. ** denotes significant differences between sun and shade leaves at α = 0.001. Error bars represent ±1SE.
We implemented the observed within-crown variation in photosynthetic capacities in the two big-leaf model and MAESTRA, but this assumption did not significantly improve the predictions of the two big-leaf model (Table 3). However, in the multi-layer model (MAESTRA), it reduced the bias such that the slope of predicted vs. observed canopy photosynthesis was increased towards unity from 0.76 to 0.82. It did not improve the temperature response of canopy photosynthesis as model outputs did not show a significant change to the shape of the temperature response function compared with the baseline two big-leaf model and MAESTRA (Figure 6b). Neither the r2 nor RMSE of the two big-leaf and MAESTRA models were significantly changed (Table 3). There remained a systematic overestimation in the model compared with the measurements.
Figure 6.

Measured vs modelled hourly rates of tree canopy net photosynthesis (Ameasured and Amodelled, respectively) and their temperature responses. Here, the multilayer crown model MAESTRA was used. In (a) and (b), an exponential decline of both Vcmax and Jmax within the tree crown was assumed (scenario M2). In (c) and (d), both an exponential decline and seasonal temperature acclimation of Vcmax and Jmax were assumed (scenario M3). Points in panels (a) and (c) show all hourly net photosynthetic rates expressed per unit canopy leaf area at all PAR levels; points in panels (b) and (d) show the hourly net photosynthetic rates for PPFD > 1200 μmol m−2 s−1, also expressed per unit canopy leaf area. In panels (a) and (c), dashed lines indicate the fitted simple linear regression model and continuous lines indicate the 1:1 line. In panels (b) and (d), lines depict the fitted general additive models with shaded areas showing the 95% prediction CI. Results of the linear regression between the measured and modelled hourly photosynthetic rates at saturating incident light levels (PAR > 1200 μmol m−2 s−1) are given in Table 3.
Seasonal acclimation in photosynthetic biochemical parameters
Aspinwall et al. (2016) found strong evidence for acclimation of the maximum rate of carboxylation by the enzyme ribulose-1,5-bisphosphate carboxylase-oxygenase (Vcmax) to the prevailing growth temperature. Vcmax measured at a standard temperature of 25 °C (Vcmax25) showed a significant decreasing trend with increases in the preceding 30-day mean air temperature (Tgrowth). Both parameters were significantly higher in winter compared with summer. The mean rate of decrease in Vcmax was 1.9 ± 0.6 μmol m−2 s−1 per °C increase in Tgrowth (Figure S3a available as Supplementary data at Tree Physiology Online). Similar to Vcmax, the potential rate of electron transport measured at 25 °C (Jmax25) showed a significant decreasing trend with increasing Tgrowth (Figure S3b available as Supplementary data at Tree Physiology Online). The rate of decrease in Jmax, 3.7 ± 0.8 μmol m−2 s−1 per °C increase in Tgrowth was higher than that of Vcmax. Implementation of seasonal variation in Vcmax and Jmax25 alone (without within crown variation in Vcmax and Jmax25) slightly improved the predictions such that the slope of predicted vs. observed canopy photosynthesis was increased towards unity from 0.76 to 0.82. (Figure S4 available as Supplementary data at Tree Physiology Online).
Next, we implemented both the within-crown gradient and seasonal acclimation in Vcmax and Jmax in all three models (Scenarios B2, T3, M3, Table 2) by assigning both parameters monthly using leaf-level data from Aspinwall et al. (2016). Here, we assumed that the photosynthetic-temperature acclimation capacity was similar in leaves irrespective of the canopy position. This assumption significantly improved the predicted canopy photosynthesis only in the multi-layer model (Figure 6c), where the slope of the linear regression between measured and modelled canopy photosynthesis increased from 0.82 to approach the 1:1 line at 0.94. Also, the temperature responses of photosynthesis of measured and modelled canopy photosynthesis were not significantly different, as the 95% confidence intervals were overlapping (Figure 6d). The r2 values of the linear regression between the modelled and measured canopy photosynthesis at PAR > 1200 μmol m−2 s−1 increased from 0.52 (scenario M2) to 0.59 (scenario M3) and the RMSE decreased from 2.51 to 1.8 μmol m−2 s−1. In the two big-leaf model, implementation of a within-crown gradient and seasonal temperature acclimation in Vcmax and Jmax did not significantly improve the predicted canopy photosynthesis compared with the multilayer model and the r2 values were lower and the RMSE was higher in the two big-leaf model under this assumption compared with MAESTRA (Table 3). Overall, our results identified both within-canopy spatial variation and seasonal temperature acclimation in photosynthetic biochemical parameters as important determinants of the temperature response of tree canopy photosynthesis.
Discussion
In this study, we explored the temperature response of tree canopy photosynthesis using a model-data integration approach. We found that the observed lower temperature optimum for canopy photosynthesis than for leaf photosynthesis could be attributed to several factors: the large contribution of leaves operating at non-saturating light levels, the variation of photosynthetic capacity vertically through the canopy following the gradient in light and seasonal thermal acclimation of photosynthetic capacity to changing growth temperature. Further, we demonstrated that the big leaf model was not able to account for the reduction in the temperature optimum at the canopy scale, but the two big-leaf and multilayer approaches were able to predict the temperature response of canopy photosynthesis accurately. Overall, these results suggest that radiation extinction through the canopy layers as well as gradients in photosynthetic biochemical parameters within the canopy and thermal acclimation across seasons are the principal determinants of the temperature dependence of canopy photosynthesis.
Our study demonstrated significant improvement in predicted hourly canopy photosynthesis after accounting for irradiance extinction and leaf shading within the tree canopy (due to both self-shading and effects of neighbouring trees). This result provides a strong indication that often the canopy leaf area operates under light-limited conditions. Therefore, our data suggested that the observed differences in the temperature optimum for leaf and canopy photosynthesis is partly due to the large contribution of non-light saturated leaves to the total canopy photosynthesis, in support of our first hypothesis. Several previous studies have suggested that canopy scale photosynthesis is frequently dominated by non-light saturated leaves (Ellsworth and Reich 1993, McMurtrie and Wang 1993, Schäfer et al. 2003; Yang et al. 2019). At non-light-saturated conditions, photosynthetic rates of individual leaves are negatively affected by increasing photorespiration with temperature (Ehleringer and Björkman 1977), and hence the canopy photosynthesis rate tends to decrease with increasing temperature (McMurtrie and Wang 1993, Haxeltine and Prentice 1996, Drake et al. 2016). As a result, the temperature response of photosynthesis of leaves in lower canopy layers shows a monotonically declining relationship at non-saturating irradiance conditions even with high incident PAR at the top of the canopy. Additionally, leaf temperatures are likely to differ within the canopy, with shaded leaves operating at a lower temperature than sunlit leaves. This effect is accounted for in our multi-layer model, in which we dynamically calculate leaf temperatures from energy balance in each layer, and may help to explain the improved performance of the multi-layer model. However, here we expect this effect to be relatively small. Detailed measurements in a subsequent experiment with a related species (E. parramattensis instead of E. tereticornis studied here) indicated that leaf temperatures measured directly closely followed the air temperatures as measured by the thermistors within the crown (Drake et al. 2020). There were only modest deviations in Tleaf relative to Tair that were correlated with PPFD (e.g., 1–2 °C). Our results suggest that both single and two big-leaf (sunlit and shaded) approximations do not accurately predict the temperature response of canopy photosynthesis and provide evidence for the need to account for radiation extinction and shading within the tree canopy.
Our results showed a slight improvement in modelled canopy photosynthesis in the multi-layer model after accounting for the vertical canopy gradient in leaf-scale photosynthetic capacities, Vcmax and Jmax. In the two big-leaf model, this improvement was relatively minor in magnitude when compared with the improvement in modelled photosynthesis in multilayered MAESTRA. Many previous studies provide evidence for significant differences in photosynthetic parameters, including Vcmax and Jmax, along the vertical axis of individual tree canopies following a gradient in light (Kull et al. 1999, Carswell et al. 2000, Meir et al. 2002, Weerasinghe et al. 2014, Ranasinghe et al. 2015, Campany et al. 2016, Slot et al. 2018, Crous et al. 2021). Mercado et al. (2007) tested different vertical configurations of Vcmax in the Joint UK Land Environment Simulator (JULES) and reported that simulated photosynthetic carbon uptake was less sensitive to variation in Vcmax with canopy depth. As our results showed, if the majority of the canopy leaf area is operating under light-limited conditions, it is highly likely that the canopy photosynthesis is principally limited by light rather than Vcmax. Alternatively, it can be hypothesized that the systematic over-estimation in the model compared with the measurements could potentially be due to the values for Vcmax and Jmax for leaves at the lower canopy layers being assumed to be higher than the actual values. Because our data show a clear temporal trend in both Vcmax and Jmax following seasonal changes in growth temperature (discussed later), the parameter values assumed under a multilayer modelling scenario alone do not represent the observed leaf-scale photosynthetic biochemistry. Note that we did not consider variation in the stomatal parameter g1 across different seasons and canopy depth as an explanation for differences between observed and modelled canopy photosynthesis, as we assumed constant g1 parameter throughout the canopy. There is little empirical evidence for seasonality in g1 either in our data, or in that from other Eucalyptus species grown at the same location in the WTCs (Barton et al. 2012) or in the field (Héroult et al. 2013; Gimeno et al. 2016). Data from Campany et al. (2016) do suggest that g1 of leaves in the lower canopy is higher than that in the leaves of upper canopy, but this difference would tend to increase the optimum temperature for photosynthesis of lower-canopy leaves (Lin et al. 2012) so does not help to explain the low canopy-scale optimum temperature for photosynthesis.
Our results showed a major improvement in the modelled canopy scale photosynthesis predictions by the multi-layer scheme after accounting for both a within-canopy gradient and seasonal temperature acclimation of Vcmax and Jmax (i.e., supporting our second hypothesis). Under these assumptions, the model was able to predict canopy photosynthesis values that more closely matched the observations compared with the big leaf and two big-leaf models with the same assumptions. Additionally, this modelling scenario captures the temperature response of canopy photosynthesis accurately. Kumarathunge et al. (2019) clearly showed that acclimation of photosynthetic biochemical component processes to growth temperature was the principal driver of the leaf-scale photosynthetic temperature response. Previous studies on eucalypts also provide evidence for temporal variation in photosynthetic capacities following changes in growth temperature (Ghannoum et al. 2010, Crous et al. 2013, 2018, Lin et al. 2013, Drake et al. 2015, Aspinwall et al. 2016, 2017). These findings provide evidence for the need for systematic accounting for seasonal temperature acclimation in predicting canopy photosynthesis. Our results are further supported by several global scale studies which reported significant improvement in predictions of TBM after accounting for acclimation in photosynthetic biochemical parameters (Smith et al. 2016, Mercado et al. 2018).
In this study, we assumed that the photosynthetic-temperature acclimation capacity was similar in sun and shade leaves. Previous studies on photosynthetic-temperature acclimation have mainly focused on upper canopy sun-lit leaves (Crous et al. 2013, Aspinwall et al. 2016, Yamaguchi et al. 2016, Slot and Winter 2017). Constraining the photosynthetic acclimation capacity of leaves at different canopy depths is challenging as we lack a detailed understanding on how leaf scale photosynthetic-temperature response parameters (i. e. Ea, Hd and ΔS) vary in leaves at different canopy positions. Nevertheless, our results indirectly suggest that the temperature response parameters of Vcmax and Jmax (i.e., Ea, Hd and ΔS) estimated at upper canopy sun-lit leaves sufficiently predict the temperature response of canopy photosynthesis.
Several TBM still use the ‘big-leaf’ assumption when scaling leaf photosynthesis to canopies (Amthor 1994, Rogers et al. 2017), while others represent sun and shade leaf area separately using the one-layered ‘two-big-leaves’ approximation (Pury and Farquhar 1997, Dai et al. 2004). Results of this study provided evidence for the potential need of multilayer approaches in modelling canopy photosynthesis (Bonan and Patton 2021). This study disentangled the processes that need to be incorporated in TBM to accurately predict temperature responses of tree canopy photosynthesis. These findings on leaf to canopy scaling of photosynthetic temperature response derived in this study may prove useful in quantifying tree and forest canopy photosynthesis and improve the predictions of photosynthesis in TBM.
Supplementary Material
Acknowledgments
Whole tree chamber experiment was supported by the Australian Research Council Discovery Project (DP140103415), a New South Wales government Climate Action Grant (NSW 495 T07/CAG/016) with additional support from the Hawkesbury Institute for the Environment and Western Sydney University. DK was supported by a Western Sydney University international PhD scholarship. We thank Burhan Amiji for technical assistance. KYC acknowledges ARC DECRA support (DE160101484), MGDK acknowledges funding from the UK Natural Environment Research Council (NE/W010003/1).
Contributor Information
Dushan P Kumarathunge, Hawkesbury Institute for the Environment, Western Sydney University, Locked Bag 1797, Penrith, NSW 2751, Australia; Department of Agricultural Biology, Faculty of Agriculture, University of Ruhuna, Mapalana, Kamburupitiya, Kamburupitiya 81100, Sri Lanka.
Belinda E Medlyn, Hawkesbury Institute for the Environment, Western Sydney University, Locked Bag 1797, Penrith, NSW 2751, Australia.
John E Drake, Hawkesbury Institute for the Environment, Western Sydney University, Locked Bag 1797, Penrith, NSW 2751, Australia; Department of Sustainable Resources Management, College of Environmental Science and Forestry, State University of New York, 1 Forestry Drive, Syracuse, NY 13210, USA.
Martin G De Kauwe, School of Biological Sciences, University of Bristol, Bristol BS8 1TQ, UK.
Mark G Tjoelker, Hawkesbury Institute for the Environment, Western Sydney University, Locked Bag 1797, Penrith, NSW 2751, Australia.
Michael J Aspinwall, Hawkesbury Institute for the Environment, Western Sydney University, Locked Bag 1797, Penrith, NSW 2751, Australia; Formation Environmental, LLC, Sacramento, CA 95816, USA.
Craig V M Barton, Hawkesbury Institute for the Environment, Western Sydney University, Locked Bag 1797, Penrith, NSW 2751, Australia.
Courtney E Campany, Hawkesbury Institute for the Environment, Western Sydney University, Locked Bag 1797, Penrith, NSW 2751, Australia; Department of Natural and Physical Sciences, Shepherd University, 301 N King St, Shepherdstown, WV 25443, USA.
Kristine Y Crous, Hawkesbury Institute for the Environment, Western Sydney University, Locked Bag 1797, Penrith, NSW 2751, Australia.
Jinyan Yang, Hawkesbury Institute for the Environment, Western Sydney University, Locked Bag 1797, Penrith, NSW 2751, Australia; Environment, CSIRO, Canberra 2601, ACT, Australia.
Mingkai Jiang, Hawkesbury Institute for the Environment, Western Sydney University, Locked Bag 1797, Penrith, NSW 2751, Australia; College of Life Sciences, Zhejiang University, Hangzhou 310000, China.
Authors’ contributions
Project conceived by B.E.M. Analyses designed and carried out by D.P.K. with guidance from B.E.M. and M.G.D.K. Manuscript writing led by D.P.K. J.E.D. and M.G.T. co-led the overall WTC experimental design and made a substantial contribution to data collection, interpretation and writing. C.V.M.B. was the technical lead on the WTC research facility and contributed to canopy photosynthesis measurements and writing. M.J.A., C.E.C., K.Y.C., M.J. and J.Y. contributed data and ideas, and edited the manuscript.
Conflict of interest
None declared.
Funding
Whole-tree chamber experiment was supported by the Australian Research Council Discovery Project (DP140103415), a New South Wales government Climate Action Grant (NSW 495 T07/CAG/016) with additional support from the Hawkesbury Institute for the Environment and Western Sydney University. K.Y.C. acknowledges ARC DECRA support (DE160101484), M.G.D.K. acknowledges funding from the UK Natural Environment Research Council (NE/W010003/1).
Data availability
The datasets and the analysis code used for the entire analysis is publicly available through https://bitbucket.org/Kumarathunge/canscal.
References
- Amthor JS (1994) Scaling CO2-photosynthesis relationships from the leaf to the canopy. Photosynth Res 39:321–350. [DOI] [PubMed] [Google Scholar]
- Aspinwall MJ, Drake JE, Campany C, Vårhammar A, Ghannoum O, Tissue DT, Reich PB, Tjoelker MG (2016) Convergent acclimation of leaf photosynthesis and respiration to prevailing ambient temperatures under current and warmer climates in Eucalyptus tereticornis. New Phytol 212:354–367. [DOI] [PubMed] [Google Scholar]
- Aspinwall MJ, Vårhammar A, Blackman CJ, Tjoelker MG, Ahrens C, Byrne M, Tissue DT, Rymer PD (2017) Adaptation and acclimation both influence photosynthetic and respiratory temperature responses in Corymbia calophylla. Tree Physiol 37:1095–1112. [DOI] [PubMed] [Google Scholar]
- Baldocchi DD (2003) Assessing the eddy covariance technique for evaluating carbon dioxide exchange rates of ecosystems: past, present and future. Global Change Biology, 9:479–492. 10.1046/j.1365-2486.2003.00629.x. [DOI] [Google Scholar]
- Barton CVM, Ellsworth DS, Medlyn BEet al. (2010) Whole-tree chambers for elevated atmospheric CO2 experimentation and tree scale flux measurements in south-eastern Australia: the Hawkesbury Forest experiment. Agric For Meteorol 150:941–951. 10.1016/j.agrformet.2010.03.001. [DOI] [Google Scholar]
- Barton CVM, Duursma RA, Medlyn BEet al. (2012) Effects of elevated atmospheric [CO2] on instantaneous transpiration efficiency at leaf and canopy scales in Eucalyptus saligna. Glob Chang Biol 18:585–595. 10.1111/j.1365-2486.2011.02526.x. [DOI] [Google Scholar]
- Battaglia M, Beadle C, Loughhead S (1996) Photosynthetic temperature responses of Eucalyptus globulus and Eucalyptus nitens. Tree Physiol 16:81–89. 10.1093/treephys/16.1-2.81. [DOI] [PubMed] [Google Scholar]
- Bennett AC, Arndt SK, Bennett LTet al. (2021) Thermal optima of gross primary productivity are closely aligned with mean air temperatures across Australian wooded ecosystems. Glob Chang Biol 27:4727–4744. [DOI] [PubMed] [Google Scholar]
- Bonan GB, Patton EG, Finnigan JJ, Baldocchi DD, Harman IN (2021) Moving beyond the incorrect but useful paradigm: reevaluating big-leaf and multilayer plant canopies to model biosphere-atmosphere fluxes – a review. Agric For Meteorol 306:108435. 10.1016/j.agrformet.2021.108435. [DOI] [Google Scholar]
- Campany CE, Tjoelker MG, Caemmerer S, Duursma RA (2016) Coupled response of stomatal and mesophyll conductance to light enhances photosynthesis of shade leaves under sunflecks. Plant Cell Environ 39:2762–2773. 10.1111/pce.12841. [DOI] [PubMed] [Google Scholar]
- Carswell FE, Meir P, Wandelli EVet al. (2000) Photosynthetic capacity in a central Amazonian rain forest. Tree Physiol 20:179–186. 10.1093/treephys/20.3.179. [DOI] [PubMed] [Google Scholar]
- Clark DB, Mercado LM, Sitch Set al. (2011) The joint UK land environment simulator (JULES), model description – part 2: carbon fluxes and vegetation dynamics. Geosci Model Dev 4:701–722. 10.5194/gmd-4-701-2011. [DOI] [Google Scholar]
- Crous KY, Quentin AG, Lin YS, Medlyn BE, Williams DG, Barton CV, Ellsworth DS (2013) Photosynthesis of temperate Eucalyptus globulus trees outside their native range has limited adjustment to elevated CO2 and climate warming. Glob Chang Biol 19:3790–3807. [DOI] [PubMed] [Google Scholar]
- Crous KY, Drake JE, Aspinwall MJ, Sharwood RE, Tjoelker MG, Ghannoum O (2018) Photosynthetic capacity and leaf nitrogen decline along a controlled climate gradient in provenances of two widely distributed eucalyptus species. Glob Chang Biol 24:4626–4644. [DOI] [PubMed] [Google Scholar]
- Crous KY, Campany C, Lopéz R, Cano FJ, Ellsworth DS (2021) Canopy position affects photosynthesis and anatomy in mature eucalyptus trees in elevated CO2. Tree Physiol 41:206–222. 10.1093/treephys/tpaa117. [DOI] [PubMed] [Google Scholar]
- Crous KY, Uddling J, De Kauwe MG (2022) Temperature responses of photosynthesis and respiration in evergreen trees from boreal to tropical latitudes. New Phytol 234:353–374. [DOI] [PMC free article] [PubMed] [Google Scholar]
- Dai Y, Dickinson RE, Wang Y-P (2004) A two-big-leaf model for canopy temperature, photosynthesis, and stomatal conductance. J Clim 17:2281–2299. . [DOI] [Google Scholar]
- D’orangeville L, Houle D, Duchesne L, Phillips RP, Bergeron Y, Kneeshaw D (2018) Beneficial effects of climate warming on boreal tree growth may be transitory. Nature Communications, 9, 3213. 10.1038/s41467-018-05705-4. [DOI] [PMC free article] [PubMed] [Google Scholar]
- Drake JE, Aspinwall MJ, Pfautsch Set al. (2015) The capacity to cope with climate warming declines from temperate to tropical latitudes in two widely distributed eucalyptus species. Glob Chang Biol 21:459–472. [DOI] [PubMed] [Google Scholar]
- Drake JE, Tjoelker MG, Aspinwall MJ, Reich PB, Barton CVM, Medlyn BE, Duursma RA (2016) Does physiological acclimation to climate warming stabilize the ratio of canopy respiration to photosynthesis? New Phytol 211:850–863. [DOI] [PubMed] [Google Scholar]
- Drake JE, Harwood R, Vårhammar A, Barbour MM, Reich PB, Barton CVM, Tjoelker MG (2020) No evidence of homeostatic regulation of leaf temperature in Eucalyptus parramattensis trees: integration of CO2 flux and oxygen isotope methodologies. New Phytol 228:1511–1523. [DOI] [PubMed] [Google Scholar]
- Drake JE, Tjoelker MGet al. (2019) The partitioning of gross primary production for young Eucalyptus tereticornis trees under experimental warming and altered water availability. New Phytol, 222:1298–1312. 10.1111/nph.15629. [DOI] [PubMed] [Google Scholar]
- Dreyer E, Le Roux X, Montpied P, Daudet FA, Masson F (2001) Temperature response of leaf photosynthetic capacity in seedlings from seven temperate tree species. Tree Physiol 21:223–232. 10.1093/treephys/21.4.223. [DOI] [PubMed] [Google Scholar]
- Duursma RA, Medlyn BE (2012) MAESPA: a model to study interactions between water limitation, environmental drivers and vegetation function at tree and stand levels, with an example application to [CO2] × drought interactions. Geosci Model Dev 5:919–940. 10.5194/gmd-5-919-2012. [DOI] [Google Scholar]
- Duursma RA, Barton CVM, Lin Y-S, Medlyn BE, Eamus D, Tissue DT, Ellsworth DS, McMurtrie RE (2014) The peaked response of transpiration rate to vapour pressure deficit in field conditions can be explained by the temperature optimum of photosynthesis. Agric For Meteorol 189–190:2–10. [Google Scholar]
- Duursma RA, Blackman CJ, Lopéz R, Martin-StPaul NK, Cochard H, Medlyn BE (2018) On the minimum leaf conductance: its role in models of plant water use, and ecological and environmental controls. New Phytol 221:693–705. [DOI] [PubMed] [Google Scholar]
- Duursma RA. (2015) Plantecophys – an R package for analysing and modellingleaf gas exchange data. PLoS ONE 10:e0143346. [DOI] [PMC free article] [PubMed] [Google Scholar]
- Ehleringer J, Björkman O (1977) Quantum yields for CO2 uptake in C3 and C4 plants: dependence on temperature, CO2, and O2 concentration. Plant Physiol 59:86–90. 10.1104/pp.59.1.86. [DOI] [PMC free article] [PubMed] [Google Scholar]
- Ellsworth DS, Reich PB (1993) Canopy structure and vertical patterns of photosynthesis and related leaf traits in a deciduous forest. Oecologia 96:169–178. [DOI] [PubMed] [Google Scholar]
- Farquhar GD, Caemmerer S, Berry JA (1980) A biochemical model of photosynthetic CO2 assimilation in leaves of C3 species. Planta 149:78–90. [DOI] [PubMed] [Google Scholar]
- Ghannoum O, Phillips NG, Sears MA, Logan BA, Lewis JD, Conroy JP, Tissue DT (2010) Photosynthetic responses of two eucalypts to industrial-age changes in atmospheric [CO2] and temperature. Plant Cell Environ 33:1671–1681. [DOI] [PubMed] [Google Scholar]
- Gimeno TE, Crous KY, Cooke J, O’Grady AP, Ósvaldsson A, Medlyn BE, Ellsworth DS (2016) Conserved stomatal behaviour under elevated CO2 and varying water availability in a mature woodland. Funct Ecol 30:700–709. [Google Scholar]
- Gunderson CA, O'Hara KH, Campion CM, Walker AV, Edwards NT (2009) Thermal plasticity of photosynthesis: the role of acclimation in forest responses to a warming climate. Glob Chang Biol 16:2272–2286. [Google Scholar]
- Haxeltine A, Prentice IC (1996) A general model for the light-use efficiency of primary production. Funct Ecol 10:551–561. [Google Scholar]
- Héroult A, LIN YSet al. (2013) Optimal stomatal conductance in relation to photosynthesis in climatically contrasting Eucalyptus species under drought. Plant, Cell & Environ, 36:262–274. 10.1111/j.1365-3040.2012.02570.x. [DOI] [PubMed] [Google Scholar]
- Huang M, Piao Set al. (2019). Air temperature optima of vegetation productivity across global biomes. Nat. Ecol. Evol. 3:772–779. [DOI] [PMC free article] [PubMed] [Google Scholar]
- Huxman TE, Turnipseed AAet al. (2003) Temperature as a control over ecosystem CO2 fluxes in a high-elevation, subalpine forest. Oecologia 134:537–546. 10.1007/s00442-002-1131-1. [DOI] [PubMed] [Google Scholar]
- Johnson FH, Eyring H, Williams RW (1942) The nature of enzyme inhibitions in bacterial luminescence: Sulfanilamide, urethane, temperature and pressure. J Cell Comp Physiol 20:247–268. [Google Scholar]
- Kala J, De Kauwe MG, Pitman AJ, Medlyn BE, Wang Y-P, Lorenz R, Perkins-Kirkpatrick SE (2016) Impact of the representation of stomatal conductance on model projections of heatwave intensity. Sci Rep 6:23418. 10.1038/srep23418. [DOI] [PMC free article] [PubMed] [Google Scholar]
- Kattge J, Knorr W (2007) Temperature acclimation in a biochemical model of photosynthesis: a reanalysis of data from 36 species. Plant Cell Environ 30:1176–1190. [DOI] [PubMed] [Google Scholar]
- Kull O, Broadmeadow M, Kruijt Bet al. (1999) Light distribution and foliage structure in an oak canopy. Trees 14:55–64. 10.1007/s004680050209. [DOI] [Google Scholar]
- Kull O, Niinemets Ü (1998) Distribution of leaf photosynthetic properties in woody canopy: comparison of species with different shade tolerance. Functional Ecology 12:472–479. 10.1046/j.1365-2435.1998.00214.x. [DOI] [Google Scholar]
- Kull O, Kruijt B (1999), Acclimation of photosynthesis to light: a mechanistic approach. Functional Ecology, 13:24–36. 10.1046/j.1365-2435.1999.00292.x. [DOI] [Google Scholar]
- Kumarathunge DP, Medlyn BE, Drake JEet al. (2019) Acclimation and adaptation components of the temperature dependence of plant photosynthesis at the global scale. New Phytol 222:768–784. [DOI] [PubMed] [Google Scholar]
- Lin Y-S, Medlyn BE, De Kauwe MG, Ellsworth DS (2013) Biochemical photosynthetic responses to temperature: how do interspecific differences compare with seasonal shifts? Tree Physiol 33:793–806. [DOI] [PubMed] [Google Scholar]
- Lin Y-S, Medlyn BE, Ellsworth DS (2012) Temperature responses of leaf net photosynthesis: the role of component processes. Tree Physiol 32:219–231. [DOI] [PubMed] [Google Scholar]
- Lloyd J, Grace J, Miranda AC, Meir P, Wong SC, Miranda HS, Wright IR, Gash JHC, McIntyre J (1995) A simple calibrated model of Amazon rainforest productivity based on leaf biochemical properties. Plant Cell Environ 18:1129–1145. [Google Scholar]
- Lombardozzi DL, Bonan GB, Smith NG, Dukes JS, Fisher RA (2015) Temperature acclimation of photosynthesis and respiration: a key uncertainty in the carbon cycle-climate feedback. Geophys Res Lett 42:8624–8631. [Google Scholar]
- McMurtrie RE, Wang Y-P (1993) Mathematical models of the photosynthetic response of tree stands to rising CO2 concentrations and temperatures. Plant Cell Environ 16:1–13. [Google Scholar]
- Medhurst J, Parsby Jet al. (2006) Whole-tree chamber system for examining tree-level physiological responses of field-grown trees to environmental variation and climate change. Plant Cell Environ. 29(9):1853–69. 10.1111/j.1365-3040.2006.01553.x. [DOI] [PubMed] [Google Scholar]
- Medlyn BE, Dreyer E, Ellsworth Det al. (2002a) Temperature response of parameters of a biochemically based model of photosynthesis. II. A review of experimental data. Plant Cell Environ 25:1167–1179. [Google Scholar]
- Medlyn BE, Loustau D, Delzon S (2002b) Temperature response of parameters of a biochemically based model of photosynthesis. I. Seasonal changes in mature maritime pine (Pinus pinaster Ait.). Plant Cell Environ 25:1155–1165. [Google Scholar]
- Medlyn BE, Duursma RA, Eamus Det al. (2011) Reconciling the optimal and empirical approaches to modelling stomatal conductance. Glob Chang Biol 17:2134–2144. [Google Scholar]
- Medlyn BE, Zaehle S, De Kauwe MGet al. (2015) Using ecosystem experiments to improve vegetation models. Nat Clim Change 5:528. [Google Scholar]
- Medlyn BE, Pepper DAet al. (2007) Linking leaf and tree water use with an individual-tree model, Tree Physiology. 27 (12):1687–1699. 10.1093/treephys/27.12.1687. [DOI] [PubMed] [Google Scholar]
- Meir P, Kruijt B, Broadmeadow M, Barbosa E, Kull O, Carswell F, Nobre A, Jarvis PG (2002) Acclimation of photosynthetic capacity to irradiance in tree canopies in relation to leaf nitrogen concentration and leaf mass per unit area. Plant Cell Environ 25:343–357. 10.1046/j.0016-8025.2001.00811.x. [DOI] [Google Scholar]
- Meir P, Grace J (2002) Scaling relationships for woody tissue respiration in two tropical rain forests. Plant, Cell & Environment, 25:963–973. 10.1046/j.1365-3040.2002.00877.x. [DOI] [Google Scholar]
- Mercado LM, Huntingford C, Gash JHC, Cox PM, Jogireddy V (2007) Improving the representation of radiation interception and photosynthesis for climate model applications. Tellus B 59:553–565. [Google Scholar]
- Mercado LM, Medlyn BE, Huntingford Cet al. (2018) Large sensitivity in land carbon storage due to geographical and temporal variation in the thermal response of photosynthetic capacity. New Phytol 218:1462–1477. [DOI] [PMC free article] [PubMed] [Google Scholar]
- Mercado LM, Patiño Set al. (2011) Variations in Amazon forest productivity correlated with foliar nutrients and modelled rates of photosynthetic carbon supply. Philos. Trans. R. Soc. B. 366:3316–3329. [DOI] [PMC free article] [PubMed] [Google Scholar]
- Mercado LM, Lloyd Jet al. (2009) Modelling basin-wide variations in Amazon forest productivity – Part 1: Model calibration, evaluation and upscaling functions for canopy photosynthesis. Biogeosciences 6 (7):1247–1272. [Google Scholar]
- Monsi M, Saeki T. (1953) Über den Lichtfaktor in den Pflanzengesellschaften und seine Bedeutung für die Stoffproduktion. Japanese Journal of Botany 14:22–52. [Google Scholar]
- Niu S, Luo Yet al. (2012) Thermal optimality of net ecosystem exchange of carbon dioxide and underlying mechanisms. New Phytol, 194:775–783. 10.1111/j.1469-8137.2012.04095.x. [DOI] [PubMed] [Google Scholar]
- Pury DGG, Farquhar GD (1997) Simple scaling of photosynthesis from leaves to canopies without the errors of big-leaf models. Plant Cell Environ 20:537–557. [Google Scholar]
- Development Core R Team (2018) R: a language and environment for statistical computing. Vienna, Austria: R Foundation for Statistical Computing.
- Ranasinghe CS, Kumarathunge MDP, Jayaranjini S, Costa WAJMD (2015) Photosynthetic irradiance response, canopy photosynthesis and their variation with canopy strata in tall and dwarf × tall coconut cultivars (Cocos nucifera L.). Sci Hortic 189:175–183. [Google Scholar]
- Rigby RA and Stasinopoulos DM (2005) Generalized additive models for location, scale and shape. Journal of the Royal Statistical Society: Series C (Applied Statistics), 54:507–554. 10.1111/j.1467-9876.2005.00510.x. [DOI] [Google Scholar]
- Rogers A, Medlyn BE, Dukes JSet al. (2017) A roadmap for improving the representation of photosynthesis in earth system models. New Phytol 213:22–42. [DOI] [PubMed] [Google Scholar]
- Schäfer KVR, Oren R, Ellsworth DS, Lai C-T, Herrick JD, Finzi AC, Richter DD, Katul GG (2003) Exposure to an enriched CO2 atmosphere alters carbon assimilation and allocation in a pine forest ecosystem. Glob Chang Biol 9:1378–1400. [Google Scholar]
- Slot M, Krause GH, Krause B, Hernández GG, Winter K (2018). Photosynthetic heat tolerance of shade and sun leaves of three tropical tree species Photosynthesis Res. 141:119–130. [DOI] [PubMed] [Google Scholar]
- Slot M, Winter K (2017a) In situ temperature relationships of biochemical and stomatal controls of photosynthesis in four lowland tropical tree species. Plant Cell Environ 40:3055–3068. [DOI] [PubMed] [Google Scholar]
- Smith NG, Malyshev SL, Shevliakova E, Kattge J, Dukes JS (2016) Foliar temperature acclimation reduces simulated carbon sensitivity to climate. Nat Clim Change 6:407–411. [Google Scholar]
- Smith NG, Dukes JS (2017) Short-term acclimation to warmer temperatures accelerates leaf carbon exchange processes across plant types. Glob Chang Biol 23:4840–4853. [DOI] [PubMed] [Google Scholar]
- Tan ZH, Jiye Zet al. (2017) Optimum air temperaturefor tropical forest photosynthesis: mechanisms involved and implications forclimate warming. Environmental Research Letters 12:054022. [Google Scholar]
- Wang YP, Leuning R (1998) A two-leaf model for canopy conductance, photosynthesis and partitioning of available energy I:: model description and comparison with a multi-layered model. Agric For Meteorol 91:89–111. [Google Scholar]
- Wang YP and Jarvis PG (1990) Description and Validation of an Array Model-MAESTRO. Agricultural and Forest Meteorology, 51: 257–280. 10.1016/0168-1923(90)90112-J. [DOI] [Google Scholar]
- Way DA, Sage RF (2008) Thermal acclimation of photosynthesis in black spruce [Picea mariana (Mill.) B.S.P.]. Plant Cell Environ 31:1250–1262. [DOI] [PubMed] [Google Scholar]
- Way DA, Yamori W (2014) Thermal acclimation of photosynthesis: on the importance of adjusting our definitions and accounting for thermal acclimation of respiration. Photosynth Res. 119:89–100. [DOI] [PubMed] [Google Scholar]
- Weerasinghe LK, Creek D, Crous KY, Xiang S, Liddell MJ, Turnbull MH, Atkin OK (2014) Canopy position affects the relationships between leaf respiration and associated traits in a tropical rainforest in far North Queensland. Tree Physiol 34:564–584. [DOI] [PubMed] [Google Scholar]
- Yamaguchi DP, Nakaji T, Hiura T, Hikosaka K (2016) Effects of seasonal change and experimental warming on the temperature dependence of photosynthesis in the canopy leaves of Quercus serrata. Tree Physiol 36:1283–1295. [DOI] [PubMed] [Google Scholar]
- Yamori W, Hikosaka K, Way DA (2014) Temperature response of photosynthesis in C3, C4, and CAM plants: temperature acclimation and temperature adaptation. Photosynth Res 119:101–117. [DOI] [PubMed] [Google Scholar]
- Yang J, Duursma RAet al. (2019) Incorporating non-stomatal limitation improves the performance of leaf and canopy models at high vapour pressure deficit, Tree Physiol. 39 (12):1961–1974. 10.1093/treephys/tpz103. [DOI] [PubMed] [Google Scholar]
- Zaehle S, Sitch S, Smith B, Hatterman F (2005) Effects of parameter uncertainties on the modeling of terrestrial biosphere dynamics, Global Biogeochem Cycles 19:GB3020. [Google Scholar]
- Zuur AF, Ieno EN, Walker NJet al. (2009). Mixed effects models and extensions in ecology with R. New York, NY, USA: Springer Science & Business Media. [Google Scholar]
Associated Data
This section collects any data citations, data availability statements, or supplementary materials included in this article.
Supplementary Materials
Data Availability Statement
The datasets and the analysis code used for the entire analysis is publicly available through https://bitbucket.org/Kumarathunge/canscal.