Abstract
This study identifies senescent osteocytes in the femur and tibia of young rodents and explores their role in bone remodeling. The proximity of osteoclasts to senescent osteocytes was observed, which is a new finding. Cultured osteocytes, sorted using a podoplanin antibody in FACS, exhibited osteocytic characteristics and increased senescence-related genes. Senescent osteocytes secreted cytokines associated with senescence, remodeling, and inflammation. Notably, IGF1 and MMP2 were elevated in podoplanin-positive (pdpn+) osteocytes. Migration assays demonstrated significant osteoclast precursor migration towards senescent osteocytes, further confirmed by co-culture experiments leading to osteoclast differentiation. These findings suggest that senescent osteocytes have a pivotal role in initiating bone resorption, with recruitment of osteoclast precursors during early bone remodeling stages. In conclusion, our research enhances our understanding of complicated bone remodeling mechanisms and bone homeostasis.
1. Introduction
Bone remodeling is a dynamic and essential process for maintaining mineral homeostasis, repairing damaged bone, and ensuring the integrity, strength, and density of the skeleton [1–3]. This intricate process involves several sequential phases, including activation/initiation of resorption, resorption, transition/reversal, and formation/termination [1–3]. Bone remodeling relies on the interplay between three key cellular players: osteocytes, osteoclasts, and osteoblasts. These cells regulate bone remodeling and contribute significantly to maintaining plasma calcium homeostasis in the body [4].
During the activation phase of bone remodeling, various initiating signals, such as parathyroid hormone (PTH), estrogen, Bax, and Bcl-2, are detected in response to systemic changes in homeostasis [1, 5–9]. However, the precise mechanism underlying this phase remains elusive. This study investigated a new aspect of bone remodeling by examining the involvement of endogenous senescent osteocytes during the activation phase, specifically focusing on the early resorption phase.
Osteocytes, the most abundant cells in bones, have a crucial role in communicating with osteoclasts and osteoblasts through distinct signaling molecules [10–12]. The secretion of a higher amount of RANKL by osteocytes is of particular importance, which is known to be pivotal in bone remodeling [13]. Notably, osteocyte-derived RANKL has been linked to age-related cortical bone loss and induced by cellular senescence [14].
To increase our understanding of osteocyte-associated bone remodeling, we proposed a novel hypothesis on the recruitment of osteoclast precursors, or monocytes, to old bone sites for remodeling in young rodents. These osteoclast precursors originate from bone marrow progenitors and travel through the bloodstream to reach their target tissues. The recruitment process involves various factors, including chemotaxis, cytokines and specific molecules like type 1 collagen, osteocalcin, stromal cell-derived factor-1 (SDF-1), and monocyte chemoattractant protein-1 (MCP-1) [15–17].
Moreover, previous studies by Hayflick and Moorhead have demonstrated that limited cell division in primary cells leads to replicative cellular senescence [18]. This senescence is triggered by various stressors such as telomere shortening, oxidative stress, DNA damage, and oncogene activation [19–21]. Senescence cells release a specific secreted phenotype known as the senescence-associated secreted phenotype (SASP) that acts as a signal to the immune system, stimulating tissue repair in the damaged area and initiating the clearance of senescent cells [22–31]. The elimination of senescent cells plays a vital role in tissue remodeling and damage resolution [32–35]. Despite the complexity of cellular senescence, this study provides potential insights into defining the senescence status of osteocytes in young rodents. It identifies the triggers for the recruitment of osteoclast precursors. The findings of this study are highly relevant to the early stage of bone remodeling, for which we hypothesize that only senescent osteocytes actively participate, ultimately contributing to the sequential bone remodeling process. Therefore, our study proposes a new perspective on bone remodeling, focusing on the involvement of senescent osteocytes in the recruitment of osteoclast precursors during the early resorption phase.
2. Materials and Methods
2.1. Animals and Guidelines
Animals used in this study included 12-week-old female Sprague Dawley (SD) rats and 8∼10-week-old male C57BL/6 mice obtained from Orient Bio Inc (South Korea). They were housed in ventilated cages at a constant temperature and provided water and food ad libitum. The Institutional Animal Care and Use Committee (IACUC) approved all animal protocols (GEN-IACUC-1910-01), and all experiments followed the IACUC guidelines to ensure ethical treatment and adherence to internationally recognized principles of animal research.
2.2. Senescence-Associated Beta-Galactosidase (SAβG) and Tartrate-Resistant Acid Phosphatase (TRAP) Staining
For the detection of SAβG in the femur and tibia of SD rats, frozen samples were prepared after euthanasia. The tissues were fixed in a solution containing 0.2% glutaraldehyde, 2 mM MgCl2, 5 mM ethylenediaminetetraacetic acid (EDTA), and 0.02% NP40 in PBS at 4°C for 24 h. Subsequently, decalcification was performed in a 19% EDTA solution at 4°C for 10 days, followed by equilibration in 30% sucrose in PBS at 4°C for 24 h. The samples were embedded in Optimal Cutting Temperature (OCT) medium and cut into sections using cryomicrotomes with a tungsten carbide blade. For SAβG staining of the frozen sections, they were incubated in a SAβG solution containing 1 mg/mL X-gal (5-bromo-4-chloro-3-indolyl-D-b-galactoside), 5 mM potassium ferrocyanide, 5 mM potassium ferricyanide, 150 mM NaCl, and 2 mM MgCl2 at pH 6.0 for 1 day in a 37°C incubator. To detect SAβG in paraffin-embedded samples, the tissues were fixed in the same manner as the frozen samples, followed by SAβG staining with whole bone at 37°C for 1 day before decalcification in 19% EDTA at 4°C for 10 days. After these tissue processing steps, paraffin-embedded samples were sectioned, and SAβG staining was performed again with eosin counterstaining. TRAP activity, a marker for osteoclasts, was also stained using the TRAP staining kit (#AK04F, Cosmo Bio Co., LTD) to identify co-staining between X-gal (SAβG) and TRAP. Cell numbers and areas were measured using CaseViewer 2.4 and ImageJ software on scanned tissue slides.
2.3. Isolation of the Osteocytes From Mouse Femur and Tibia
The mice were euthanized, and the femurs and tibias were collected for osteocyte preparation. Soft tissues and connective tissues were carefully removed from the harvested bones. We followed a modified version of the “Osteocyte isolation and culture method” described by Shah et al. [36]. To remove the bone marrow, the top and bottom of the femurs and tibias were incised, and PBS buffer was used to flush the bone cavities. The bone was chopped into pieces less than 1 mm in size to extract osteocytes from the bone matrix, and 0.1% type 1 collagenase was added. The bone fragments were then incubated in a shaking incubator at 37°C for 2 h. The cells extracted from the bone were rinsed and filtered using a 40 μm cell strainer. Subsequently, the isolated cells were cultured in a 37°C, 5% CO2 incubator. After the culture period, healthy osteocytes were successfully obtained (Figure 1(b)).
Figure 1.
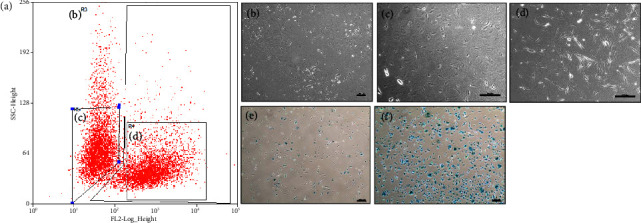
Fluorescence-activated cell sorting (FACS) of primary osteocytes by anti-podoplanin antibody and SAβG staining. (a) Sorted osteocytes are shown in regions R5 and R4, which represent a distinct cell population. (b) Total cells are shown in region R3 before sorting. (c) pdpn− cells are represented in region R5. (d) pdpn+ cells are shown in region R4. (e) Depicts cells that are pdpn− and less stained with SAβG. (f) Depicts cells that are both pdpn+ and SAβG+. Scale bar (b–f) = 200 μm.
2.4. FACS Sorting of the Mouse Osteocytes
Extracted mouse osteocytes were cultured for 1 and 2 weeks to obtain osteocytes suitable for FACS sorting. The sorting was based on the expression of the cell surface marker podoplanin (pdpn). To this end, a fluorescently labeled antibody against podoplanin/E11 (# sc-53533 AF488, Santa Cruz Biotechnology) was utilized. The FACS sorting was performed using the BD FACSAria Fusion system (BD Biosciences), which enabled the separation of osteocytes into pdpn+ and pdpn− populations. The sorted osteocytes were cultured for an additional 1 week to facilitate their recovery and stabilization after the FACS process. Following the post-sorting culture period, the gene expression profiles and cytokine levels of the sorted osteocytes were analyzed.
2.5. qPCR Analysis of the Osteocytes
Primary mouse osteocytes were cultured, and total mRNAs were extracted from the cells using the Trizol reagent (FAVORGEN, #FATRR001). The concentration and quality of the extracted mRNAs were determined using a NanoDrop 2.0 spectrophotometer (Thermo Scientific, Foster City, CA, USA). To synthesize cDNA, the extracted mRNAs were subjected to reverse transcription using the Enzo cDNA synthesis kit (#ENZ-KIT106-0200). The qPCR analysis was performed to assess the gene expression levels of specific targets. The qPCR reactions were done with the CFX Connect™ Real-Time PCR System from Bio-Rad Laboratories, Inc. Table 1 presents the primer sequences used for the qPCR.
Table 1.
qPCR primer sequence.
| Gene | Sequence |
|---|---|
| Pdpn-F | 5′-AGC CGC TGT AGA ACC AAG AA-3′ |
| Pdpn-R | 5′-TTG GGT ACC AAC ACA GAC GA-3′ |
| RANKL-F | 5′-AGC CGA GAC TAC GGC AAG TA-3′ |
| RANKL-R | 5′-CCA CAA TGT GTT GCA GTT CC-3′ |
| DMP1-F | 5′-AGT CAG GCA GGA GAC CAA GAA AA-3′ |
| DMP1-R | 5′-TGG GTT TGT TGT GGT AAG CA-3′ |
| SOST-F | 5′-ACC CCG TGT AGA CTG GTG AG-3′ |
| SOST-R | 5′-ACA AGG ATG GGA GGT GAC TG-3′ |
| p16-F | 5′-ATC TGG AGC AGC ATG GAG TC-3′ |
| p16-R | 5′-TCG CAC GAT GTC TTG ATG TC-3′ |
| p53-F | 5′-CGG GTG GAA GGA AAT TTG TA-3′ |
| p53-R | 5′-CTT CTG TAC GGC GGT CTC TC-3′ |
| TRAP-F | 5′-CTG GAG TGC ACG ATG CCA GCG ACA-3′ |
| TRAP-R | 5′-TCC GTG CTC GGC GAT GGA CCA GA-3′ |
| NFATc1-F | 5′-CTC GAA AGA CAG CAC TGG AGC AT-3′ |
| NFATc1-R | 5′-CGG CTG CCT TCC GTC TCA TAG-3′ |
| ATP6V0D2-F | 5′-CAG ACG CGC TTT AAT CAT CA-3′ |
| ATP6V0D2-R | 5′-TTC GAT GCC TCT GTG AGA TG-3′ |
| ClC7-F | 5′-ATG ACC CAC CAG GCT CCT AT-3′ |
| ClC7-R | 5′-CCA CAG GGA ATC CGT TGT GA-3′ |
| MafB-F | 5′-CAT CAC CAT CAT CAC CAA GC-3′ |
| MafB-R | 5′-AGC TGC GTC TTC TCG TTC TC-3′ |
| GAPDH-F | 5′-TGA CCA CAG TCC ATG CCA TCA CTG-3′ |
| GAPDH-R | 5′-CAG GAG ACA ACC TGG TCC TCA GTG-3′ |
2.6. Mouse Cytokine Array of the Osteocytes
Following the manufacturer's instructions, we utilized the Mouse Cytokine array kit (96 targets, #ab193659, Abcam) to investigate the differential cytokine expression between the pdpn+ and pdpn− osteocytes. Briefly, we blocked the cytokine array membranes (C3 and C4) using the provided blocking buffer for 30 min to prevent nonspecific binding. Subsequently, we incubated the membranes with the cultured media of the pdpn+ and pdpn− osteocytes, which were collected from 1-week and 2-week culture supernatants, respectively. Following the incubation with the cell culture media, the membranes were washed to remove any unbound substances. Next, we incubated the membranes with a cocktail of biotin-conjugated antibodies, each targeting various individual cytokines. After incubation with the biotin-conjugated antibodies, the membranes were further incubated with HRP-conjugated streptavidin for 2 h at room temperature. This step facilitated the specific binding of the biotin-conjugated antibodies to their corresponding targets on the membranes. The cytokine array membranes were then subjected to chemiluminescence detection using the Fusion FX6.0 chemiluminescence system (Vilber). This detection method enabled us to visualize and quantify the presence of cytokines on the membranes. The following targets were analyzed: Axl, Bfgf, BLC (CXCL13), CD30 Ligand (TNFSF8), CD30 (TNFRSF8), CD40 (TNFRSF5), CRG-2, CTACK (CCL27), CXCL16, CD26 (DPPIV), Dtk, Eotaxin-1 (CCL11), Eotaxin-2 (MPIF-2/CCL24), E-Selectin, Fas Ligand (TNFSF6), Fc gamma RIIB (CD32b), Flt-3 Ligand, Fractalkine (CX3CL1), GCSF, GITR (TNFRSF18), GM-CSF, HGFR, ICAM-1 (CD54), IFN-gamma, IGFBP-2, IGFBP-3, IGFBP-5, IGFBP-6, IGF-1, IGF-2, IL-1 beta (IL-1 F2), IL-10, IL-12 p40/p70, IL-12 p70, IL-13, IL-15, IL-17A, IL-17 RB, IL-1 alpha (IL-1 F1), IL-2, IL-3, IL-3 R beta, IL-4, IL-5, IL-6, IL-7, IL-9, I-TAC (CXCL11), KC (CXCL1), Leptin, Leptin R, LIX (CXCL5), L-Selectin (CD62L), Lungkine (CXCL15), Lymphotactin (XCL1), MCP-1 (CCL2), MCP-5, M-CSF, MDC (CCL22), MIG (CXCL9), MIP-1 alpha (CCL3), MIP-1 gamma (CCL9), MIP-2(CXCL2), MIP-3 beta (CCL19), MIP-3 alpha (CCL20), MMP-2, MMP-3, Osteopontin (OPN, SPP1), Osteoprotegerin (OPG, TNFRSF11B), Platelet Factor 4 (CXCL4), Pro-MMP-9, P-Selectin, RANTES (CCL5), Resistin, SCF, SDF-1 alpha (CXCL12 alpha), Sonic Hedgehog N-Terminal (Shh-N), TNFRI (TNFRSF1A), TNFRII (TNFRSF1B), TARC (CCL17), I-309 (TCA-3/CCL1), TECK (CCL25), TCK-1 (CXCL7), TIMP-1, TIMP-2, TNF alpha, Thrombopoietin (TPO), TRANCE (TNFSF11/RANKL), TROY (TNFRSF19), TSLP, VCAM-1 (CD106), VEGF-A, VEGFR1, VEGFR2, VEGFR3, and VEGF-D.
2.7. Migration Assay of the BMMs/Osteoclast Precursors
Cell migration assays were conducted using Transwell™ Permeable Supports with a pore size of 5 μm (Corning, Acton, MA, USA). A total of 3 × 10⁴ osteocytes or MLO-Y4 cells were seeded in the lower chamber of a 24-well plate and allowed to attach for 6 h. Subsequently, 3 × 10⁴ BMMs or Raw264.7 cells were seeded in the upper chamber. BMMs were obtained from bone marrow cells following a previously described method [37, 38]. The bone marrow cells were cultured in α-minimal essential medium (α-MEM) supplemented with 10% fetal bovine serum (FBS) and 5 ng/mL macrophage colony-stimulating factor (M-CSF) (#315-02, PeproTech) for 16 h. Non-adherent cells were then harvested and cultured for an additional 3 days with 30 ng/mL M-CSF to differentiate them into osteoclast precursors. The floating cells were removed, and the adherent cells/BMMs were used as osteoclast precursors. MLO-Y4 cells were treated with 100 μM hydrogen peroxide (H2O2) to induce cellular senescence. After seeding, the Transwell chambers were incubated at 37°C for 24, 48, and 72 h enabling cell migration. After the designated incubation times, the migrated cells on the lower surface of the Transwell membrane were stained with a 1% aqueous solution of crystal violet (#V5265, Sigma-Aldrich). The stained cells were then counted using the ImageJ software. All experiments were performed in at least three independent replicates to ensure reliable data.
2.8. Co-Culture of the Osteocytes and BMMs/Osteoclast Precursors
Co-culture experiments were conducted using osteocytes and BMMs at a ratio of 1:5, respectively. To generate osteoclasts, BMMs were seeded at a density of 5 × 10³ cells per well in a 96-well plate. Osteocytes were seeded at a density of 1 × 10³ cells per well in the same 96-well plate without any additional reagents. The co-culture plates were incubated at 37°C with 5% CO2 for 21 days.
2.9. Statistical Analysis
All experimental data were expressed as the mean ± standard deviation from three independent experiments. Statistical analyses were conducted using the GraphPad Prism 5 software (GraphPad Software, Inc.). The Student's t-test was used to compare the differences between two groups, and a significance level of p < 0.01 was considered to indicate statistically significant results.
3. Results
3.1. Intense SAβG Staining Observed Adjacent to the Growth Plate
We conducted exploratory SAβG staining on cryosections of 8-week C57BL6 femur and tibia, revealing pronounced staining in the metaphysis next to the growth plates (Figures S1(a)–S1(c)). The SAβG+ cells in this region were presumed to be osteocytes and osteoclasts (Figure S1(c)). To obtain clearer images, we prepared paraffin-embedded femur and tibia samples from a 12-week-old SD rat, which provided clear visualization of SAβG+ osteocytes and osteoclasts in the trabecular bone and cortical bone (Figures S1(d)–S1(f)).
3.2. SAβG+/− Osteocytes and Osteoclasts in the Trabecular Bone
We observed SAβG+/− osteocytes (Figures 2(a), 2(b), 2(c), 2(d), 2(e), 2(f), 2(g), 2(h), and 2(i)) in paraffin-embedded long bone tissues. SAβG+ osteocytes were found adjacent to the growth plate (Figure 2(a)) and at a distance from the growth plate (Figures 2(f), 2(g), 2(h), and 2(i)). Additionally, SAβG+ osteoclasts were detected at the periphery of the trabecular bone (Figures 2(e), 2(j), and 2(k)). SAβG− osteocytes were also observed at some distance from the growth plate in the trabecular bone (Figure 2(c)). Notably, a significant population of intense SAβG+ osteocytes was detected near the growth plate (Figures 2(a), 2(b), and 2(d)) and as individual cells apart from other osteocytes (Figures 2(a), 2(f), 2(h), 2(h), and 2(i)). Double staining with SAβG and TRAP in the trabecular bone further supported these findings (Figures 2(j) and 2(k)). Previous studies by Colnot, Huang, and Helms, and Kopp et al. reported similar observations of SAβG+ osteoclasts [39, 40]. These data collectively indicate the presence of two distinct types of osteocytes in the trabecular bone: SAβG-positive (+) and SAβG-negative (−) osteocytes.
Figure 2.
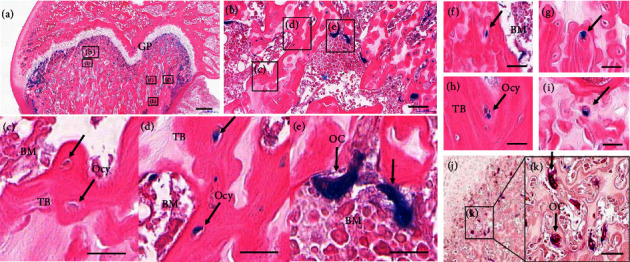
SAβG and TRAP staining of the trabecular bone in a 12-week SD rat femur. (a) SAβG and eosin staining of the epiphysis, growth plate and metaphysis. (b) Magnification of the region marked “(b)” in panel (a). (c) Magnification of the region marked “(c)” in panel (b) showing SAβG− osteocytes (decline arrows). (d) Magnification of the region marked “(d)” in panel (b) showing SAβG+ osteocytes. (e) Magnification of the region marked “(e)” in panel (b) showing SAβG+ osteoclasts (vertical arrows). (f–i) SAβG and eosin staining of osteocytes in the trabecular bone distant from the growth plate. (j) SAβG and TRAP double staining (purple) in the metaphysis of the rat femur. (k) Magnification of the region “(k)” in panel (j) showing stained SAβG and TRAP (vertical arrows). Scale bar (a) = 500 μm, (b) = 50 μm, (c–k) = 20 μm. (GP = growth plate, TRAP = tartrate-resistant acid phosphatase, Ocy = osteocyte, OC = osteoclast, TB = trabecular bone, BMMs = bone marrow-derived monocytes).
3.3. Investigating the Relationship Between SAβG+ Osteocytes and Osteoclasts in Proximity
To examine the expression patterns and association of SAβG in osteocytes and osteoclasts, we divided the areas around the growth plates into two different ranges: 0∼300 and 300∼500 μm with a width of 450 μm (Figure 3(a)). Additionally, we also divided into two different ranges: 0∼500 and 500∼1000 μm with a width of 450 μm (Figure 3(b)). We then quantified the number of SAβG+/− osteocytes and SAβG+ osteoclasts in each area of each group. Within the range of 0–300 μm, we observed 137 SAβG+ osteocytes, and 84 osteoclasts were detected compared to 56 SAβG− osteocytes. However, in the 300–500 μm range, the SAβG+ osteocytes and osteoclasts decreased to 50 and 22 cells, respectively, while SAβG− osteocytes increased to 66 cells (Figure 3(a)). Similar patterns were observed in the 0 to 500 and 500–1000 μm ranges. The total number of SAβG+/− osteocytes and osteoclasts was 187/122 and 106 cells within 0–500 μm, respectively. In contrast, 18/175 SAβG+/− osteocytes and 21 osteoclasts were detected within the 500–1000 μm range (Figure 3(b)). Overall, the SAβG+ osteocytes (187 ⟶ 18, 1/10) and osteoclasts (106 ⟶ 21, 1/5) were decreased within the 1000 μm range, while more than 1.4 times of the SAβG− osteocytes (122 ⟶ 175) were increased in the same region (Figure 3(b)). These data indicate that senescent phenotypic osteocytes are closely associated with osteoclasts compared to SAβG− osteocytes.
Figure 3.
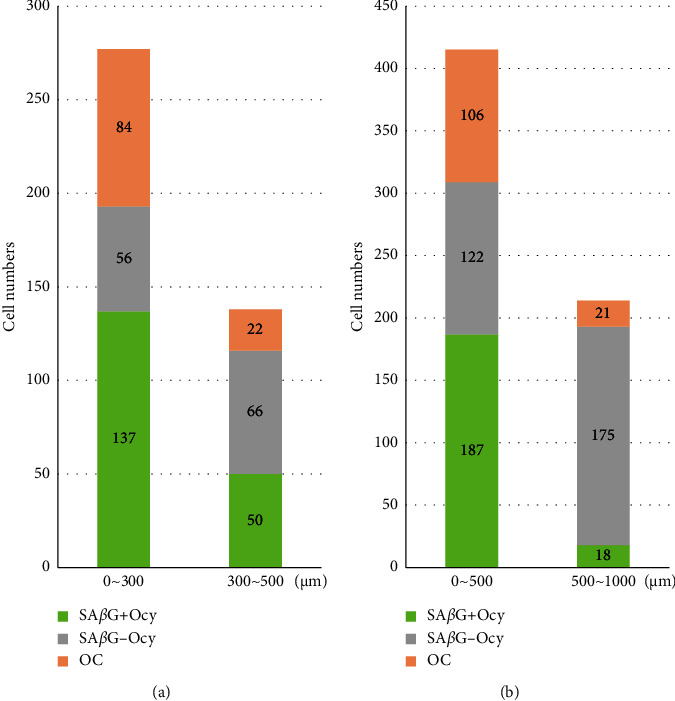
Cell number of SAβG+/− osteocytes and osteoclasts within 1 mm from the growth plate. (a) Total number of SAβG+/− osteocytes and osteoclasts within a distance range of 0∼300 μm and 300∼500 μm from the growth plate. (b) Total number of SAβG+/− osteocytes and osteoclasts within a distance range of 0∼500 μm and 500∼1000 μm from the growth plate. Ocy = osteocytes, OC = osteoclasts.
3.4. pdpn+ Osteocytes Exhibit the SAβG+ Phenotype and a Higher Expression of Senescent Marker Genes
To study senescent osteocytes, we decided to culture the osteocytes for 1 and 2 weeks before FACS sorting. One-week cultured osteocytes showed no differences in SAβG staining between the pdpn+ and pdpn− osteocytes (data not shown). Additionally, there were no significant differences in the expression of osteocyte marker genes and p16/CDKN2A between the pdpn+ and pdpn− osteocytes (Figure S2).
However, for the two-week cultured osteocytes, we observed a clear separation between the pdpn+ and pdpn− osteocytes by FACS sorting (Figure 1). The majority of the pdpn+ cells expressed SAβG, and even a small proportion of SAβG+ cells were detected in the pdpn− cells. Notably, osteocyte marker genes such as RANKL, DMP1, and SOST showed a higher expression in the pdpn+ osteocytes compared to the pdpn− osteocytes in the two-week culture (Figures 4(b), 4(c), and 4(d)). On the other hand, other osteocyte marker genes such as keratocan, neuropeptide Y, matrix extracellular phosphoglycoprotein, phosphate regulating neutral endopeptidase on the chromosome X, and fibroblast growth factor 23 did not show any significant differences between the pdpn+ and pdpn− osteocytes (data not shown). Of particular interest, the pdpn+ cells also exhibited a higher expression of senescence marker genes, including p16/CDKN2A and p53 (Figures 4(e) and 4(f)). These findings indicate that the pdpn+ osteocytes have robust osteocytic properties and senescent features.
Figure 4.
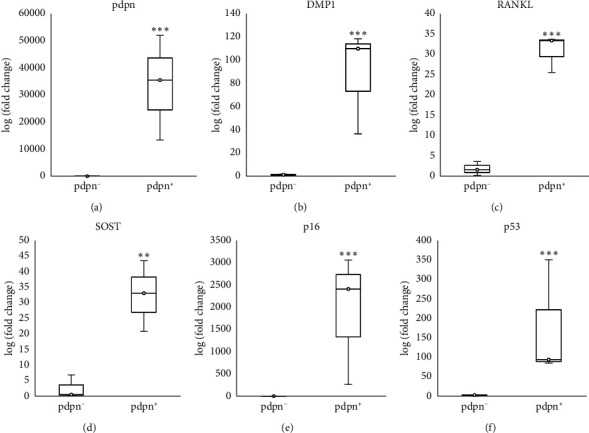
qPCR analysis of the osteocytes and senescence marker genes expression in pdpn− and pdpn+ primary osteocytes cultured for 2 weeks before FACS sorting. (a) Expression of pdpn. (b) Expression of DMP1. (c) Expression of RANKL. (d) Expression of SOST. (e) Expression of p16/CDKN2A. (f) Expression of p53. Results are representative of at least three independent sets of similar experiments. p < 0.001∗∗∗, p < 0.01∗∗.
3.5. Osteocyte-Related Cytokines in pdpn+/− Osteocytes Such as SASP
To identify SASP in pdpn+/− osteocytes, we used a cytokine array with a mouse cytokine antibody array, investigating 96 mouse cytokines. More than 16 cytokines were detected through the cytokine array. In the groups cultured for 1 and 2 weeks, 9 and 10 cytokines were detected in the pdpn− group, respectively, and 11 and 15 cytokines were observed in the pdpn+ group respectively (Table S1). Interestingly, IGF1 and MMP2 expression significantly increased in the pdpn+ group, while IGFBP6, IL6, CXCL1/KC, CXCL5/LIX, CCL2/MCP1, CCL9/MIP1r, MMP3, OPN/SPP1, and OPG/TNFRSF11B were expressed almost equally in both groups, pdpn+ and pdpn− (Figures 5(a), 5(b), 5(e), and 5(f); Table S1). Interestingly, seven cytokines (CX3CL1, IGFBP3, RANTES/CCL5, IGFBP2, IGF1, MMP2, and TIMP2) were increased in the pdpn+ compared to the pdpn− in the 2-week group. Among them, CX3CL1, IGFBP3, RANTES/CCL5, IGFBP2, and TIMP2 were newly expressed in pdpn+ in the 2-week group (Figures 5(c), 5(d), 5(g), and 5(h); Table S1). However, OPG and IL6 expression decreased or disappeared (Figures 5(f) and 5(h); Table S1). Taken together, these data suggest that the pdpn+ group secretes more senescence-dependent cytokines in remodeling and inflammation.
Figure 5.
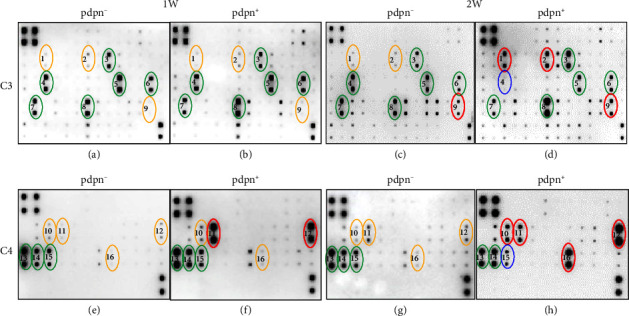
Cytokine array for SASP analysis of pdpn+/− osteocyte supernatants. (a and b) Cytokines array of pdpn− and pdpn+ osteocyte supernatants after a 1-week culture before FACS sorting (C3 membrane). (c and d) Cytokines array of pdpn− and pdpn+ osteocyte supernatants after a 2-week culture before FACS sorting (C3 membrane). (e and f) Cytokines array of pdpn− and pdpn+ osteocyte supernatants after a 1-week culture before FACS sorting (C4 membrane). (g and h) Cytokines array of pdpn− and pdpn+ osteocyte supernatants after a 2-week culture before FACS sorting (C4 membrane). (1) CX3CL1, (2) IGFBP3, (3) IGFBP6, (4) IL6, (5) CXCL1/KC, (6) CXCL5/LIX, (7) CCL2/MCP1, (8) CCL9/MIP1γ, (9) RANTES/CCL5, (10) IGFBP2, (11) IGF1, (12) MMP2, (13) MMP3, (14) OPN/SPP1, (15) OPG/TNFRSF11B. (16) TIMP2. Red circles ⟶ increased expression compared to pdpn− or 1-week membrane, Blue circles ⟶ decreased expression compared to pdpn− or 1-week membrane, Green circles ⟶ almost the same expression between pdpn+ and pdpn−, and 1-week and 2-week membranes. Orange circles ⟶ lower expression than other membranes.
3.6. Pdpn+/SAβG+ Osteocytes Attract Osteoclast Precursors
We used a migration assay with Transwells to investigate the recruitment of osteoclast precursors to SAβG+ osteocytes. Initially, we treated the osteocyte cell line MLO-Y4 with 100 μM H2O2 to induce senescence for 24, 48, and 72 h. After treatment, we assessed the migration of Raw264.7 cells toward the senescent osteocytes. (Figure 6(m)). Our observations revealed that senescence-induced osteocytes exhibited a higher attraction for Raw264.7 cells (Figures 6(i), 6(j), 6(k)) compared to the noninduced control (Figures 6(e), 6(f), 6(g)) and negative control (Figures 6(a), 6(b), 6(c)). The migration of Raw264.7 cells towards senescent osteocytes occurred in a time-course manner (Figure 6(m)). In addition, we examined the migration of primary osteoclast precursors towards SAβG+/− osteocytes separated by antipodoplanin (Figure 7). Interestingly, the primary osteoclast precursors showed a greater tendency to migrate towards the pdpn+ osteocytes with a SAβG+ phenotype compared to the pdpn− osteocytes. This difference was particularly significant at 72 h (Figure 7(g)). Similar results were observed in both the primary osteocytes and the cell line, indicating that the degree of osteocyte senescence influenced the migration of the osteoclast precursors (Figures 6(k) and 7(g)). Based on these findings, we proposed that senescent osteocytes can recruit osteoclast precursors, thus having a crucial role in bone resorption.
Figure 6.
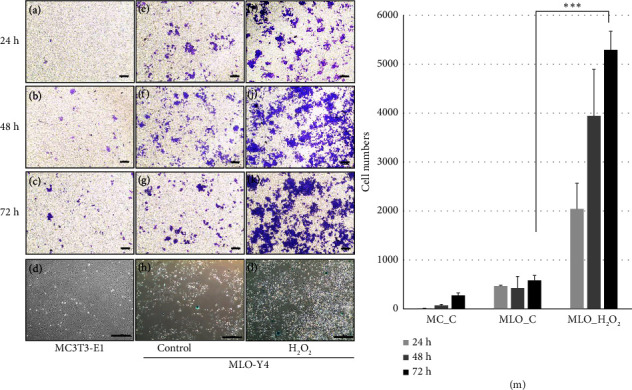
Migration assay of Raw264.7 in response to senescent MLO-Y4. (a–c), (e–g), and (i–k) Migration of Raw264.7 cells to MC3T3-E1 (negative control) and MLO-Y4 (control) at 24, 48, and 72 h, respectively. (d) SAβG staining of MC3T3-E1 (48-h cultured cells). (h) SAβG staining of MLO-Y4 (48-h cultured cells). (l) SAβG staining of MLO-Y4 treated with H2O2 (48-h cultured cells). (m) Migration cell number of Raw264.7. p < 0.001∗∗∗. Scale bar (a–c), (e–g), and (i–k) = 200 μm. (d), (h), and (l) = 500 μm. MC_C = MC3T3-E1. MLO_C = MLO-Y4. MLO_H2O2 = 100 μM H2O2 treatment group.
Figure 7.
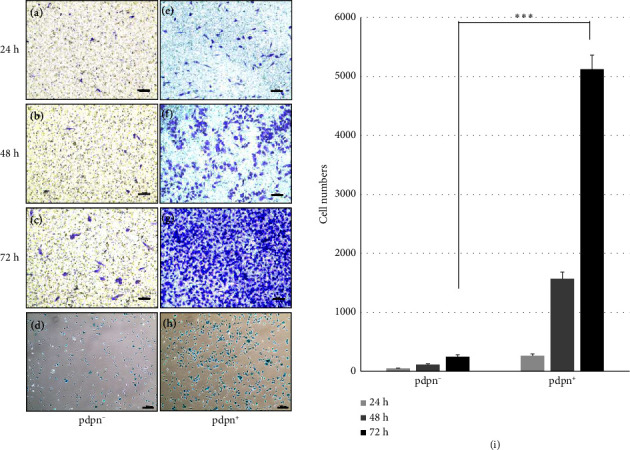
Migration assay of the bone marrow-derived monocytes (BMMs) in response to pdpn+/− cells. (a–c) and (e–g) Monocyte migration to pdpn+/− cells for 24, 48, and 72 h, respectively. (d) and (h) SAβG stained pdpn+/− cells, indicating senescence. (i) Migration cell number of BMM. p < 0.001∗∗∗. Scale bar (a–c) and (e–g) = 200 μm, (d) and (h) = 500 μm.
3.7. Co-Culture of pdpn+ Osteocytes Promotes Osteoclast Differentiation
To investigate the potential of pdpn+ osteocytes in promoting osteoclast differentiation, we co-cultured BMMs with pdpn+/− osteocytes for 21 days. The co-culture was designed to assess whether BMMs could differentiate into osteoclasts without the addition of M-CSF and RANKL. Encouragingly, we observed that the pdpn+ osteocytes more effectively induced the differentiation of osteoclast precursors into osteoclasts. This was evident as the pdpn+ osteocyte group exhibited over eight times more TRAP-stained cells compared to the pdpn− group (Figures 8(b) and 8(d) and S3(b)). To further validate the osteoclast differentiation process in the pdpn+/− groups, we analyzed the expression of osteoclast marker genes with qPCR. In the pdpn+ group, TRAP, NFATc1, ATP6V0D2 and ClC7 expression levels were significantly higher than in the pdpn− group. Conversely, the negative marker MafB had a lower expression in the pdpn+ group compared to the pdpn− group (Figure 8(f)). Taken together, these findings strongly suggest that pdpn+ osteocytes have a pivotal role in promoting osteoclast differentiation. Further investigation into the underlying mechanisms by which pdpn+ osteocytes facilitate this process could provide valuable insights into bone remodeling and tissue homeostasis regulation.
Figure 8.
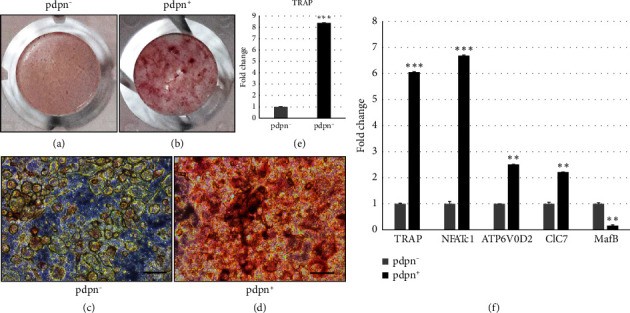
Co-culture of the osteocytes and BMMs for 3 weeks. (a) TRAP staining of the co-cultured pdpn− osteocytes and BMMs. (b) TRAP staining of the co-cultured pdpn+ osteocytes and BMMs. (c) Microscope image showing TRAP staining of the pdpn-co-cultured cells. (d) Microscope image showing TRAP staining of the pdpn+ co-cultured cells. (e) Fold change of pdpn+ compared to pdpn− TRAP+. (f) Osteoclast marker gene expression; tartrate-resistant acid phosphatase (TRAP), nuclear factor-activated T cells c1 (NFATc1), ATPase H+ transporting V0 subunit D2 (ATP6V0D2), chloride voltage-gate channel 7 (ClC7), MAF b ZIP transcription factor B (MafB). (a) and (b) Cultured in 96-well plates. Scale bar (c) and (d) = 50 μm.
4. Discussion
In this study, we discover the presence of senescent osteocytes in the femur and tibia of young rodents (Figure 2) and explore their potential role in bone remodeling. We also observed the appearance of osteoclasts near senescent osteocytes. SAβG+ osteoclasts have been previously reported by Colnot, Huang, and Helms [39], and Kopp et al. [40]. Here, we detected SAβG+ osteoclasts and SAβG+ osteocytes in normal and young rodents, which was a novel finding. They were located near each other in the trabecular and cortical bone, especially next to growth plates (Figure 2(a)). To infer the relationship between osteocytes and osteoclasts, we quantified the number of SAβG+/− osteocytes and osteoclasts within specific regions of the trabecular bone. Interestingly, the SAβG+ osteocytes had the same high or low number of cells as the SAβG+ osteoclasts (Figure 3), whereas the SAβG− osteocytes appeared to have the opposite number of the SAβG+ osteocytes and osteoclasts. Consequently, we postulate that SAβG+ osteocytes are more closely associated with osteoclasts compared to SAβG− osteocytes.
Next, we cultured the osteocytes for one and 2 weeks to obtain pure osteocytes and senescent osteocytes. Then, the cultured osteocytes were sorted with podoplanin antibody in a FACS machine and verified by qPCR. FACS-sorted pdpn+ cells exhibited osteocytic expression such as DMP1, RANKL, and SOST (Figures 4(b), 4(c), and 4(d)) and increased senescence-related genes including p16/CDKN2A and p53, compared with the pdpn− cells (Figures 4(e) and 4(f)). These results indicate that 2-week cultured pdpn+ osteocytes show robust osteocytic characteristics along with senescent features.
Osteocytes secrete inflammatory cytokines that regulate the functions of other bone cells [41]. In this study, 16 classified cytokines are known to be involved in senescence, remodeling and inflammation (Table S1). Among them, 10 cytokines were reported in osteocytes (Table S1). IGF1 and MMP2 were commonly increased in the pdpn+ at 1- and 2-week samples. IGF1 is a well-defined molecule in bone remodeling, which is involved in the stimulation of osteoblasts and inhibition of osteoclasts, leading to enhanced bone growth, bone mass and bone repair [42–44]. MMP2 also has a pivotal role in bone and tissue remodeling involved in collagen degradation, osteoclast activation and activation of growth factors [45–48]. Among the 16 cytokines, CX3CL1, CXCL1, and CCL2 are associated with monocyte recruitment similar to SDF-1 [49–54]. Monocyte/macrophage recruitment is crucial in various biological processes, including wound healing and embryonic development, in which cellular senescence has also been implicated. We hypothesized that senescent osteocytes may have a similar role in bone remodeling. We performed a series of experiments to test our hypothesis, including migration assays and co-culture experiments with osteocytes and osteoclast precursors (Figures 6, 7, and 8). Our results consistently showed that osteoclast precursors significantly migrated toward senescent osteocytes in a time-course manner (Figures 6 and 7).
Additionally, co-culture experiments further substantiated our findings because we observed the differentiation of osteoclast precursors into osteoclasts in the presence of activated pdpn + osteocytes (Figures 8; S3). Based on these compelling results, we propose that senescent osteocytes are pivotal in initiating bone resorption during the activation phase of bone remodeling. Their ability to recruit osteoclast precursors and induce their differentiation into osteoclasts appears to be crucial for the precise localization of osteoclast precursors in old bone. This precise localization will likely facilitate the efficient replacement of old bone tissue with new bone.
We also analyzed the protein-protein interaction networks using the STRING database (https://string-db.org/) (Figures S4 and S5) to gain insights into the interactions and correlations between the detected cytokines. This analysis revealed that the SASP factors released by senescent osteocytes have the potential to attract monocytes and macrophages, which are known to be involved in various physiological processes, including wound healing and embryonic development in which cellular senescence also has crucial roles [22, 23, 55–59].
In conclusion, our research clarifies the role of senescent osteocytes in the early phases of bone remodeling. These senescent osteocytes have a significant role in promoting bone resorption by regulating the recruitment and differentiation of osteoclast precursors. The findings from this study have the potential to significantly impact our understanding of the fundamental mechanisms governing bone remodeling. Moreover, they offer promising avenues for future therapeutic interventions that address senescence-related bone disorders.
Acknowledgments
This research was supported by Grants (2016R1D1A1B02009810 to I.S.; 2019R1A2C200811314 to K. M.W.; 2018R1A5A202441821 to K. M.W.) from the Basic Science Research Program through the National Research Foundation of Korea (NRF).
Contributor Information
Insun Song, Email: songinsun@snu.ac.kr.
Kyung Mi Woo, Email: kmwoo@snu.ac.kr.
Data Availability Statement
The data that support the findings of this study are available from the corresponding author upon reasonable request.
Conflicts of Interest
The authors declare no conflicts of interest.
Author Contributions
Insun Song and Kyung Mi Woo conceived and designed the study. Insun Song, Pil-Jong Kim, Yong Jun Choi, Yoon-Sok Chung, Jeong-Hwa Baek, and Kyung Mi Woo contributed to development of methodology and analysis or interpretation of data for the work. Insun Song, Jeong-Hwa Baek, and Kyung Mi Woo were involved in drafting the work and revising it critically for important intellectual content. The final approval of the version to be published was made by Insun Song and Kyung Mi Woo. Translation services and proofreading of the English text were carried out with the assistance of the Foreign Language Education Center at the Language Education Institute of Seoul National University.
Funding
This research was supported by Grants (2016R1D1A1B02009810 to I.S.; 2019R1A2C200811314 to K. M.W.; 2018R1A5A202441821 to K. M.W.) from the Basic Science Research Program through the National Research Foundation of Korea (NRF).
Supporting Information
Additional supporting information can be found online in the Supporting Information section.
Supporting Figure 1: SAβG staining of trabecular and cortical bone next to the growth plates in 8-week C57BL/6 and 12-week SD rats. Supporting Figure 2: qPCR analysis of the osteocytes and senescence marker genes expression of pdpn− and pdpn+ in primary osteocytes cultured for 1 week before FACS sorting. Supporting Figure 3: TRAP staining of the osteoclasts in co-cultured osteocytes and BMMs for 3 weeks in 96-well plates. Supporting Figure 4: Multiple protein interactions of the pdpn+/− cytokines after 1-week culture of osteocytes. Supporting Figure 5: Multiple protein interactions of the pdpn+/− cytokines after 2-week culture of osteocytes. Table S1: Cytokines expression in 1- and 2-week pdpn ± membranes.
References
- 1.Raggatt L. J., Partridge N. C. Cellular and Molecular Mechanisms of Bone Remodeling. Journal of Biological Chemistry . 2010;285(33):25103–25108. doi: 10.1074/jbc.r109.041087. [DOI] [PMC free article] [PubMed] [Google Scholar]
- 2.Florencio-Silva R., Sasso G. R., Sasso-Cerri E., Simões M. J., Cerri P. S. Biology of Bone Tissue: Structure, Function, and Factors That Influence Bone Cells. BioMed Research International . 2015;2015:17. doi: 10.1155/2015/421746.421746 [DOI] [PMC free article] [PubMed] [Google Scholar]
- 3.Marsell R., Einhorn T. A. The Biology of Fracture Healing. Injury . 2011;42(6):551–555. doi: 10.1016/j.injury.2011.03.031. [DOI] [PMC free article] [PubMed] [Google Scholar]
- 4.Hadjidakis D. J., Androulakis I. I. Bone Remodeling. Annals of the New York Academy of Sciences . 2006;1092(1):385–396. doi: 10.1196/annals.1365.035. [DOI] [PubMed] [Google Scholar]
- 5.Swarthout J. T., D’Alonzo R. C., Selvamurugan N., Partridge N. C. Parathyroid Hormone-Dependent Signaling Pathways Regulating Genes in Bone Cells. Gene . 2002;282(1-2):1–17. doi: 10.1016/s0378-1119(01)00798-3. [DOI] [PubMed] [Google Scholar]
- 6.Heino T. J., Hentunen T. A., Väänänen H. K. Osteocytes Inhibit Osteoclastic Bone Resorption Through Transforming Growth Factor‐β: Enhancement by Estrogen. Journal of Cellular Biochemistry . 2002;85(1):185–197. doi: 10.1002/jcb.10109. [DOI] [PubMed] [Google Scholar]
- 7.Verborgt O., Tatton N. A., Majeska R. J., Schaffler M. B. Spatial Distribution of Bax and Bcl-2 in Osteocytes After Bone Fatigue: Complementary Roles in Bone Remodeling Regulation? Journal of Bone and Mineral Research . 2002;17(5):907–914. doi: 10.1359/jbmr.2002.17.5.907. [DOI] [PubMed] [Google Scholar]
- 8.Bonewald L. F. Osteocytes as Dynamic Multifunctional Cells. Annals of the New York Academy of Sciences . 2007;1116(1):281–290. doi: 10.1196/annals.1402.018. [DOI] [PubMed] [Google Scholar]
- 9.Aguirre J. I., Plotkin L. I., Stewart S. A., et al. Osteocyte Apoptosis Is Induced by Weightlessness in Mice and Precedes Osteoclast Recruitment and Bone Loss. Journal of Bone and Mineral Research . 2006;21(4):605–615. doi: 10.1359/jbmr.060107. [DOI] [PubMed] [Google Scholar]
- 10.Robling A. G., Bonewald L. F. The Osteocyte: New Insights. Annual Review of Physiology . 2020;82(1):485–506. doi: 10.1146/annurev-physiol-021119-034332. [DOI] [PMC free article] [PubMed] [Google Scholar]
- 11.Bonewald L. F. The Amazing Osteocyte. Journal of Bone and Mineral Research . 2011;26(2):229–238. doi: 10.1002/jbmr.320. [DOI] [PMC free article] [PubMed] [Google Scholar]
- 12.Divieti Pajevic P., Krause D. S. Osteocyte Regulation of Bone and Blood. Bone . 2019;119:13–18. doi: 10.1016/j.bone.2018.02.012. [DOI] [PMC free article] [PubMed] [Google Scholar]
- 13.Nakashima T., Hayashi M., Fukunaga T., et al. Evidence for Osteocyte Regulation of Bone Homeostasis through RANKL Expression. Nature Medicine . 2011;17(10):1231–1234. doi: 10.1038/nm.2452. [DOI] [PubMed] [Google Scholar]
- 14.Kim H.-N., Xiong J., MacLeod R. S., et al. Osteocyte RANKL Is Required for Cortical Bone Loss With Age and Is Induced by Senescence. JCI Insight . 2020;5(19):p. e138815. doi: 10.1172/jci.insight.138815. [DOI] [PMC free article] [PubMed] [Google Scholar]
- 15.Malone J. D., Teitelbaum S. L., Griffin G. L., Senior R. M., Kahn A. J. Recruitment of Osteoclast Precursors by Purified Bone Matrix Constituents. The Journal of Cell Biology . 1982;92(1):227–230. doi: 10.1083/jcb.92.1.227. [DOI] [PMC free article] [PubMed] [Google Scholar]
- 16.Liao T. S., Yurgelun M. B., Chang S. S., et al. Recruitment of Osteoclast Precursors by Stromal Cell Derived Factor-1 (SDF-1) in Giant Cell Tumor of Bone. Journal of Orthopaedic Research . 2005;23(1):203–209. doi: 10.1016/j.orthres.2004.06.018. [DOI] [PubMed] [Google Scholar]
- 17.Li X., Qin L., Bergenstock M., Bevelock L. M., Novack D. V., Partridge N. C. Parathyroid Hormone Stimulates Osteoblastic Expression of MCP-1 to Recruit and Increase the Fusion of Pre/Osteoclasts. Journal of Biological Chemistry . 2007;282(45):33098–33106. doi: 10.1074/jbc.m611781200. [DOI] [PubMed] [Google Scholar]
- 18.Hayflick L., Moorhead P. S. The Serial Cultivation of Human Diploid Cell Strains. Experimental Cell Research . 1961;25(3):585–621. doi: 10.1016/0014-4827(61)90192-6. [DOI] [PubMed] [Google Scholar]
- 19.Muñoz-Espín D., Serrano M. Cellular Senescence: From Physiology to Pathology. Nature Reviews Molecular Cell Biology . 2014;15(7):482–496. doi: 10.1038/nrm3823. [DOI] [PubMed] [Google Scholar]
- 20.Campisi J., d’Adda di Fagagna F. Cellular Senescence: When Bad Things Happen to Good Cells. Nature Reviews Molecular Cell Biology . 2007;8(9):729–740. doi: 10.1038/nrm2233. [DOI] [PubMed] [Google Scholar]
- 21.Collado M., Blasco M. A., Serrano M. Cellular Senescence in Cancer and Aging. Cell . 2007;130(2):223–233. doi: 10.1016/j.cell.2007.07.003. [DOI] [PubMed] [Google Scholar]
- 22.Muñoz-Espín D., Cañamero M., Maraver A., et al. Programmed Cell Senescence during Mammalian Embryonic Development. Cell . 2013;155(5):1104–1118. doi: 10.1016/j.cell.2013.10.019. [DOI] [PubMed] [Google Scholar]
- 23.Storer M., Mas A., Robert-Moreno A., et al. Senescence Is a Developmental Mechanism That Contributes to Embryonic Growth and Patterning. Cell . 2013;155(5):1119–1130. doi: 10.1016/j.cell.2013.10.041. [DOI] [PubMed] [Google Scholar]
- 24.Banito A., Lowe S. W. A New Development in Senescence. Cell . 2013;155(5):977–978. doi: 10.1016/j.cell.2013.10.050. [DOI] [PMC free article] [PubMed] [Google Scholar]
- 25.Davaapil H., Brockes J. P., Yun M. H. Conserved and Novel Functions of Programmed Cellular Senescence During Vertebrate Development. Development . 2017;144(1):106–114. doi: 10.1242/dev.138222. [DOI] [PMC free article] [PubMed] [Google Scholar]
- 26.Krizhanovsky V., Xue W., Zender L., Yon M., Hernando E., Lowe S. Implications of Cellular Senescence in Tissue Damage Response, Tumor Suppression and Stem Cell Biology. Cold Spring Harbor Symposia on Quantitative Biology . 2008;73:513–522. doi: 10.1101/sqb.2008.73.048. [DOI] [PMC free article] [PubMed] [Google Scholar]
- 27.Jun J.-I., Lau L. F. The Matricellular Protein CCN1 Induces Fibroblast Senescence and Restricts Fibrosis in Cutaneous Wound Healing. Nature Cell Biology . 2010;12(7):676–685. doi: 10.1038/ncb2070. [DOI] [PMC free article] [PubMed] [Google Scholar]
- 28.Demaria M., Ohtani N., Youssef S. A., et al. An Essential Role for Senescent Cells in Optimal Wound Healing Through Secretion of PDGF-AA. Developmental Cell . 2014;31(6):722–733. doi: 10.1016/j.devcel.2014.11.012. [DOI] [PMC free article] [PubMed] [Google Scholar]
- 29.Xue W., Zender L., Miething C., et al. Senescence and Tumour Clearance Is Triggered by P53 Restoration in Murine Liver Carcinomas. Nature . 2007;445(7128):656–660. doi: 10.1038/nature05529. [DOI] [PMC free article] [PubMed] [Google Scholar]
- 30.Lujambio A. To Clear, or Not to Clear (Senescent Cell)? That Is the Question. BioEssays . 2016;38(S1):S56–S64. doi: 10.1002/bies.201670910. [DOI] [PubMed] [Google Scholar]
- 31.Kang T.-W., Yevsa T., Woller N., et al. Senescence Surveillance of Pre-Malignant Hepatocytes Limits Liver Cancer Development. Nature . 2011;479(7374):547–551. doi: 10.1038/nature10599. [DOI] [PubMed] [Google Scholar]
- 32.Freund A., Orjalo A. V., Desprez P. Y., Campisi J. Inflammatory Networks During Cellular Senescence: Causes and Consequences. Trends in Molecular Medicine . 2010;16(5):238–246. doi: 10.1016/j.molmed.2010.03.003. [DOI] [PMC free article] [PubMed] [Google Scholar]
- 33.Hoenicke L., Zender L. Immune Surveillance of Senescent Cells–Biological Significance in Cancer-and Non-Cancer Pathologies. Carcinogenesis . 2012;33(6):1123–1126. doi: 10.1093/carcin/bgs124. [DOI] [PubMed] [Google Scholar]
- 34.Krizhanovsky V., Yon M., Dickins R. A., et al. Senescence of Activated Stellate Cells Limits Liver Fibrosis. Cell . 2008;134(4):657–667. doi: 10.1016/j.cell.2008.06.049. [DOI] [PMC free article] [PubMed] [Google Scholar]
- 35.Gonzalez-Gualda E., Baker A. G., Fruk L., Muñoz‐Espín D. A Guide to Assessing Cellular Senescence In Vitro and In Vivo. FEBS Journal . 2021;288(1):56–80. doi: 10.1111/febs.15570. [DOI] [PubMed] [Google Scholar]
- 36.Shah K. M., Stern M. M., Stern A. R., Pathak J. L., Bravenboer N., Bakker A. D. Osteocyte Isolation and Culture Methods. BoneKEy Reports . 2016;5:p. 838. doi: 10.1038/bonekey.2016.65. [DOI] [PMC free article] [PubMed] [Google Scholar]
- 37.Song I., Kim J. H., Kim K., Jin H. M., Youn B. U., Kim N. Regulatory Mechanism of NFATc1 in RANKL-Induced Osteoclast Activation. FEBS Letters . 2009;583(14):2435–2440. doi: 10.1016/j.febslet.2009.06.047. [DOI] [PubMed] [Google Scholar]
- 38.Kim K., Kim J. H., Lee J., et al. MafB Negatively Regulates RANKL-Mediated Osteoclast Differentiation. Blood . 2007;109(8):3253–3259. doi: 10.1182/blood-2006-09-048249. [DOI] [PubMed] [Google Scholar]
- 39.Colnot C., Huang S., Helms J. Analyzing the Cellular Contribution of Bone Marrow to Fracture Healing Using Bone Marrow Transplantation in Mice. Biochemical and Biophysical Research Communications . 2006;350(3):557–561. doi: 10.1016/j.bbrc.2006.09.079. [DOI] [PubMed] [Google Scholar]
- 40.Kopp H. G., Hooper A. T., Shmelkov S. V., Rafii S. β-Galactosidase Staining on Bone Marrow. The Osteoclast Pitfall. Histology & Histopathology . 2007;22(9):971–976. doi: 10.14670/HH-22.971. [DOI] [PubMed] [Google Scholar]
- 41.Delgado-Calle J., Bellido T. The Osteocyte as a Signaling Cell. Physiological Reviews . 2022;102(1):379–410. doi: 10.1152/physrev.00043.2020. [DOI] [PMC free article] [PubMed] [Google Scholar]
- 42.Wang J., Zhu Q., Cao D., et al. Bone Marrow-Derived IGF-1 Orchestrates Maintenance and Regeneration of the Adult Skeleton. Proceedings of the National Academy of Sciences . 2023;120(1):p. e2203779120. doi: 10.1073/pnas.2203779120. [DOI] [PMC free article] [PubMed] [Google Scholar]
- 43.Sheng M. H., Lau K. H. W., Baylink D. J. Role of Osteocyte-Derived Insulin-Like Growth Factor I in Developmental Growth, Modeling, Remodeling, and Regeneration of the Bone. Journal of Bone Metabolism . 2014;21(1):41–54. doi: 10.11005/jbm.2014.21.1.41. [DOI] [PMC free article] [PubMed] [Google Scholar]
- 44.Lau K. H., Baylink D. J., Zhou X.-D., et al. Osteocyte-derived Insulin-Like Growth Factor I Is Essential for Determining Bone Mechanosensitivity. American Journal of Physiology-Endocrinology and Metabolism . 2013;305:E271–E281. doi: 10.1152/ajpendo.00092.2013. [DOI] [PubMed] [Google Scholar]
- 45.Özcan S., Alessio N., Acar M. B., et al. Unbiased Analysis of Senescence Associated Secretory Phenotype (SASP) to Identify Common Components Following Different Genotoxic Stresses. Aging . 2016;8(7):1316–1329. doi: 10.18632/aging.100971. [DOI] [PMC free article] [PubMed] [Google Scholar]
- 46.Rastogi A., Kim H., Twomey J. D., Hsieh A. H. MMP-2 Mediates Local Degradation and Remodeling of Collagen by Annulus Fibrosus Cells of the Intervertebral Disc. Arthritis Research and Therapy . 2013;15(2):p. R57. doi: 10.1186/ar4224. [DOI] [PMC free article] [PubMed] [Google Scholar]
- 47.Corbel M., Boichot E., Lagente V. Role of Gelatinases MMP-2 and MMP-9 in Tissue Remodeling Following Acute Lung Injury. Brazilian Journal of Medical and Biological Research . 2000;33(7):749–754. doi: 10.1590/s0100-879x2000000700004. [DOI] [PubMed] [Google Scholar]
- 48.Hatori K., Sasano Y., Takahashi I., Kamakura S., Kagayama M., Sasaki K. Osteoblasts and Osteocytes Express MMP2 and -8 and TIMP1, -2, and -3 Along With Extracellular Matrix Molecules During Appositional Bone Formation. The Anatomical Record Part A: Discoveries in Molecular, Cellular, and Evolutionary Biology . 2004;277(2):262–271. doi: 10.1002/ar.a.20007. [DOI] [PubMed] [Google Scholar]
- 49.Flamant M., Mougenot N., Balse E., et al. Early Activation of the Cardiac CX3CL1/CX3CR1 Axis Delays β-Adrenergic-Induced Heart Failure. Scientific Reports . 2021;11(1):p. 17982. doi: 10.1038/s41598-021-97493-z. [DOI] [PMC free article] [PubMed] [Google Scholar]
- 50.Wu C.-L., Yin R., Wang S.-N., Ying R. A Review of CXCL1 in Cardiac Fibrosis. Frontiers in Cardiovascular. Medicine . 2021;8:p. 674498. doi: 10.3389/fcvm.2021.674498. [DOI] [PMC free article] [PubMed] [Google Scholar]
- 51.Korbecki J., Gąssowska-Dobrowolska M., Wójcik J., et al. The Importance of CXCL1 in Physiology and Noncancerous Diseases of Bone, Bone Marrow, Muscle and the Nervous System. International Journal of Molecular Sciences . 2022;23(8):p. 4205. doi: 10.3390/ijms23084205. [DOI] [PMC free article] [PubMed] [Google Scholar]
- 52.Mulholland B. S., Forwood M. R., Morrison N. A. Monocyte Chemoattractant Protein-1 (MCP-1/CCL2) Drives Activation of Bone Remodelling and Skeletal Metastasis. Current Osteoporosis Reports . 2019;17(6):538–547. doi: 10.1007/s11914-019-00545-7. [DOI] [PMC free article] [PubMed] [Google Scholar]
- 53.Marchica V., Toscani D., Corcione A., et al. Bone Marrow CX3CL1/Fractalkine Is a New Player of the Pro-Angiogenic Microenvironment in Multiple Myeloma Patients. Cancers . 2019;11(3):p. 321. doi: 10.3390/cancers11030321. [DOI] [PMC free article] [PubMed] [Google Scholar]
- 54.Dwivedi A., Kiely P. A., Hoey D. A. Mechanically Stimulated Osteocytes Promote the Proliferation and Migration of Breast Cancer Cells via a Potential CXCL1/2 Mechanism. Biochemical and Biophysical Research Communications . 2021;534:14–20. doi: 10.1016/j.bbrc.2020.12.016. [DOI] [PubMed] [Google Scholar]
- 55.Kamei N., Tobe K., Suzuki R., et al. Overexpression of Monocyte Chemoattractant Protein-1 in Adipose Tissues Causes Macrophage Recruitment and Insulin Resistance. Journal of Biological Chemistry . 2006;281(36):26602–26614. doi: 10.1074/jbc.m601284200. [DOI] [PubMed] [Google Scholar]
- 56.Kitaura H., Marahleh A., Ohori F., et al. Osteocyte-Related Cytokines Regulate Osteoclast Formation and Bone Resorption. International Journal of Molecular Sciences . 2020;21(14):p. 5169. doi: 10.3390/ijms21145169. [DOI] [PMC free article] [PubMed] [Google Scholar]
- 57.Wilkinson H. N., Hardman M. J. Senescence in Wound Repair: Emerging Strategies to Target Chronic Healing Wounds. Frontiers in Cell and Developmental Biology . 2020;8:p. 773. doi: 10.3389/fcell.2020.00773. [DOI] [PMC free article] [PubMed] [Google Scholar]
- 58.Coppé J. P., Patil C. K., Rodier F., et al. Senescence-associated Secretory Phenotypes Reveal Cell-Nonautonomous Functions of Oncogenic RAS and the p53 Tumor Suppressor. PLoS Biology . 2008;6(12):e301–e36403. doi: 10.1371/journal.pbio.0060301. [DOI] [PMC free article] [PubMed] [Google Scholar]
- 59.Prattichizzo F., De Nigris V., Mancuso E., et al. Short-Term Sustained Hyperglycaemia Fosters an Archetypal Senescence-Associated Secretory Phenotype in Endothelial Cells and Macrophages. Redox Biology . 2018;15:170–181. doi: 10.1016/j.redox.2017.12.001. [DOI] [PMC free article] [PubMed] [Google Scholar]
Associated Data
This section collects any data citations, data availability statements, or supplementary materials included in this article.
Supplementary Materials
Supporting Figure 1: SAβG staining of trabecular and cortical bone next to the growth plates in 8-week C57BL/6 and 12-week SD rats. Supporting Figure 2: qPCR analysis of the osteocytes and senescence marker genes expression of pdpn− and pdpn+ in primary osteocytes cultured for 1 week before FACS sorting. Supporting Figure 3: TRAP staining of the osteoclasts in co-cultured osteocytes and BMMs for 3 weeks in 96-well plates. Supporting Figure 4: Multiple protein interactions of the pdpn+/− cytokines after 1-week culture of osteocytes. Supporting Figure 5: Multiple protein interactions of the pdpn+/− cytokines after 2-week culture of osteocytes. Table S1: Cytokines expression in 1- and 2-week pdpn ± membranes.
Data Availability Statement
The data that support the findings of this study are available from the corresponding author upon reasonable request.


