RESUMEN
Fundamentos:
Los sistemas de ajuste de riesgo basados en diagnóstico estratifican la población según la morbilidad observada. El objetivo de este trabajo fue analizar el gasto sanitario total en un área de salud en función de la edad, el sexo y la morbilidad observada en la población.
Métodos:
Estudio observacional de corte transversal y de ámbito poblacional de los costes de atención sanitaria en el Departamento de salud Dénia-Marina Salud (Alicante) durante el año 2013. Se estratificó a la población (N=156.811) según Grupos de Riesgo Clínico en 9 estados de salud, siendo sano el estado 1 y el 9 el de mayor carga de morbilidad. A cada habitante se le imputaron los costes hospitalarios, de atención primaria y de farmacia ambulatoria para obtener los costes totales. Se analizaron los estados de salud y gravedad por edad y sexo así como los costes de cada grupo. Se aplicaron las pruebas estadísticas t de student y χ2 para verificar la existencia de diferencias significativas entre e intra grupos.
Resultados:
El coste medio por habitante fue de 983 euros oscilando desde 240 hasta 42.881 en el estado 9 y nivel de gravedad 6. Los pacientes de los estados de salud 5 y 6 realizaron el mayor gasto, pero los estados de salud 8 y 9 tuvieron el mayor gasto medio, siendo el 80% hospitalario.
Conclusiones:
Se corrobora una diferente composición del gasto sanitario por morbilidad individual, con un crecimiento exponencial del gasto hospitalario.
Palabras clave: Ajuste de riesgo, Análisis del costo, Atención hospitalaria, Atención primaria de salud, Costos hospitalarios, Morbilidad, Planificación sanitaria, Farmacoeconomia, Servicio de urgencia en hospital
INTRODUCCIÓN
Los sistemas de salud en los países desarrollados deben afrontar nuevos retos asociados al envejecimiento de la población, con el consiguiente aumento de las enfermedades crónicas y el gasto sanitario1. Se ha demostrado un incremento del gasto sanitario relacionado con el aumento de la edad de la población, pero el factor morbilidad incide altamente en el gasto2,3,4,5. De este modo, los sistemas de ajuste por riesgo basados en diagnósticos constituyen una importante herramienta para agrupar a la población en función de sus condiciones crónicas y los patrones de consumos sanitarios individuales. Estos sistemas son útiles no solo para la estratificación de pacientes y análisis de patrones de utilización de consumos de recursos sino también para la planificación y evaluación de los sistemas de salud, financiación capitativa, asignación de recursos asistenciales en base a la carga real derivada por la morbilidad y seguimiento de las tasas de prevalencia de enfermedades crónicas.
Los sistemas de ajustes de riesgo en salud más utilizados a nivel internacional son: 1) Grupos de Costes Basados en Diagnósticos (Diagnostic Cost Groups, DCGs)6 utilizados principalmente en Estados Unidos por Medicare7,8. 2) Grupos Clínicos Ajustados (Johns Hopkins ACG System)9 y 3) Grupos de Riesgo Clínico (Clinical Risk Groups, CRG)10,11.
En España se han utilizado los ACG en Aragón12, Badalona13 y País Vasco14 y los CRG en Madrid15, Gerona2,16 y Comunidad Valenciana11.
La principal característica de los CRG es que clasifican a la población en 1.075 grupos (versión 1.6) mutuamente excluyentes, según las enfermedades que registre cada paciente en la base de datos electrónica. Así mismo, cada categoría de CRG se agrupa en clasificaciones más genéricas hasta llegar al nivel más agregado que consta de 9 estados de salud. Cada estado de salud tiene en común el número y la gravedad de las condiciones crónicas, que se traduce en un similar gasto sanitario. Estos 9 estados de salud son: 1) sano; 2) enfermedad aguda significativa; 3) enfermedad crónica menor única; 4) enfermedad crónica menor en múltiples sistemas orgánicos; 5) enfermedad dominante o crónica moderada única; 6) enfermedad significativa crónica en múltiples sistemas orgánicos; 7) enfermedad dominante crónica en tres o más sistemas orgánicos; 8) Neoplasias dominantes, metastásicas y complicadas; y 9) enfermedades graves o necesidades sanitarias elevadas. El nivel de desagregación que precede a esta clasificación es el Nivel 3 de agregación del CRG (ACRG3), que considera los nueve estados de salud más 6 niveles de gravedad o severidad.
Entre las aplicaciones prácticas más destacadas de los CRG se encuentran: predecir y explicar el gasto sanitario11, mejorar la asignación de recursos asistenciales en base al conocimiento del estado de salud15,17 y las necesidades de la población, y establecer modelos de pago capitativo y gestión de enfermedades crónicas10.
Algunas experiencias ya han demostrado su validez en cuanto a la estratificación de la población y apoyo en la gestión sanitaria16, las estrategias de abordaje de la cronicidad18 y la monitorización de enfermedades crónicas14.
Unos estudios se centraron en algunos de los componentes del gasto sanitario: farmacéutico12, hospitalario o atención primaria19. Otros analizaron el gasto total5, los costes directos e indirectos2, los costes de determinadas enfermedades20 y el coste de la población pediátrica o la población adulta5.
El objetivo del presente artículo fue analizar el gasto total sanitario por habitante, de acuerdo con la edad, el género y la morbilidad en un departamento integrado de salud en Alicante y distinguiendo entre gasto hospitalario, farmacéutico ambulatorio y atención primaria.
MATERIAL Y MÉTODOS
Estudio observacional transversal, analítico, de ámbito poblacional para la totalidad de los 156.811 habitantes asignados al Departamento de Dénia-Marina Salud (Alicante) en el año 2013. Este Departamento integrado de salud, uno de los 10 existentes en la provincia de Alicante, incluye un hospital en Dénia, 4 centros sanitarios integrados, 8 centros de salud y 34 consultorios. La edad media de la población adscrita a este Departamento era de 43,57 años. Tenía menos de 18 años el 17,62%, entre 18 y 64 años el 59,42% y la población mayor de 64 años era del 22,95%. El 48,92% eran hombres.
La información se obtuvo del Sistema de Gestión Analítica del Departamento de Dénia-Marina Salud y de las bases de datos electrónicas de la Conselleria de Sanitat Universal i Salut Pública de la Comunitat Valenciana que incluye el Sistema de Información Poblacional (SIP), el Sistema de Información Asistencial (SIA), el Conjunto Mínimo de Bases de Datos (CMBD), el Sistema de Prescripción Farmacéutica Electrónica (GAIA) y el Sistema de Clasificación de Pacientes poblacional de la Comunidad Valenciana (SCP-CV). Para la estratificación de la población del Departamento en CRG se utilizó el sistema de agrupador poblacional (3MTM Clinical Risk Grouping Software).
La estimación del coste anual por paciente (Cj) se realizó de acuerdo con la siguiente expresión:
Cj= Chj+Capj+ Cfj
Chj= Cuj+Cqj+Ccej+Cij
Capj= (nj ) (p)
Siendo Chj el coste hospitalario (asistencia especializada) del paciente j, obtenido a partir del sistema analítico del hospital de Dénia, que incluye los costes en actividades intermedias por paciente, tales como pruebas diagnósticas, exámenes de laboratorio e imagen, los consumos de material sanitario y farmacia e incluso las prestaciones de los pacientes realizadas en otros departamentos.
Capj el coste de atención primaria del paciente j
Cfj el coste farmacéutico ambulatorio del paciente j según datos del GAIA
C uj el coste de urgencias del paciente j
C qj el coste de quirófanos del paciente j
C cej el coste de consultas externas del paciente j
C ij el coste de hospitalización del paciente j
nj el número de consultas en atención primaria del paciente j
p el coste unitario de la consulta según los importes establecidos en el texto refundido de la Ley de Tasas de la Generalitat(21).
A partir del coste anual por paciente se obtuvo el coste total (CT) de cada ítem (estado de salud, grupo de edad, sexo, etcétera) y su coste medio (Cm) de acuerdo con las expresiones:
 |
Siendo N el número de pacientes incluidos en el ítem.
Con todo ello se construyó una base de datos con los costes anuales para cada uno de los 156.811 habitantes, su CRG asignado, la edad y el sexo.
Se aplicó la prueba estadística paramétrica t de Student para verificar la existencia de diferencias significativas de valores medios entre grupos, y la no paramétrica χ2 de Pearson para comprobar las diferencias significativas entre dos distribuciones, en ambos casos al 95%.
Esta investigación recibió el dictamen favorable por el Comité Ético Corporativo de Investigación Clínica de Atención Primaria de la Comunitat Valenciana el 30 de enero de 2014, con el código de protocolo RUT-FAR-2013-01, versión de 19 de diciembre de 2013. La Comisión de Investigación del Departamento de Salud Dénia, aprobó el proyecto el 12 de febrero de 2015.
RESULTADOS
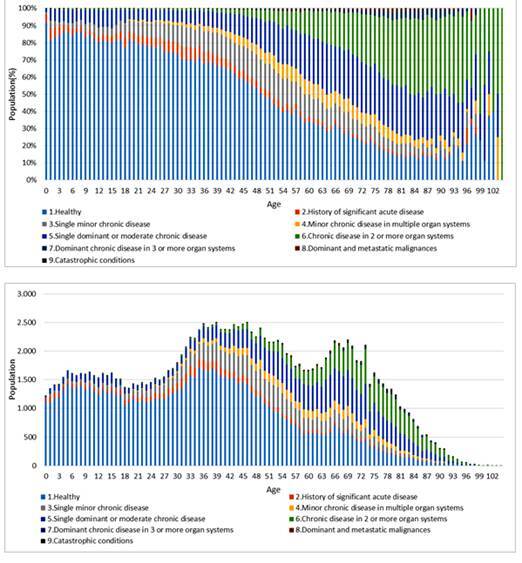
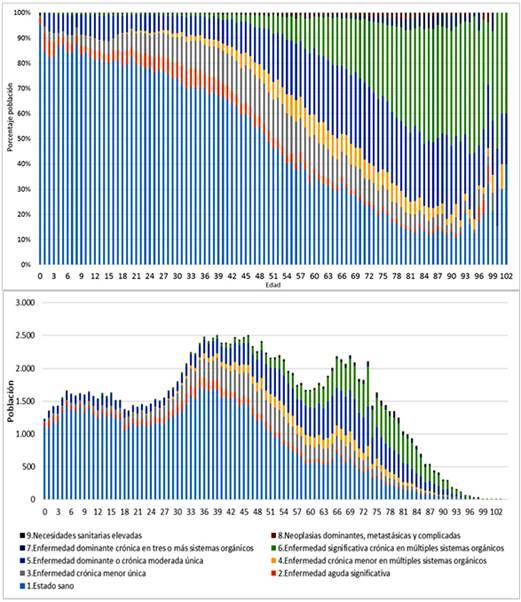
Se observó un aumento de la morbilidad con la edad, especialmente en los estados de salud 5 y 6 a partir de los 45 años (Figura 1), agravado por un repunte de la población con enfermedades crónicas en mayores de 60 años. No obstante, mientras que el porcentaje de personas en el estado de salud 5 se mantuvo en torno a un 25% a partir de los 50 años, la correspondiente a las personas en el estado de salud 6 siguió creciendo con la edad y se estabilizó en el 45% para la población mayor de 80 años.
Figura 1. Distribución de la morbilidad (estado de salud del Grupo de Riesgo Clínico) en función de la edad de la población en años.
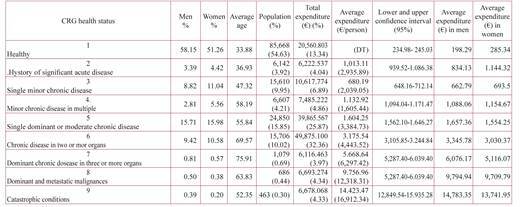
Por sexo se encontraron diferencias estadísticamente significativas en la distribución de los estados de salud (χ2 de Pearson= 1483,085; p=0,000). Los hombres presentaron una prevalencia de sujetos sanos del 58,15% y las mujeres del 51,26% (Tabla 1). Los estados de salud 2, 3, 4 y 6 tuvieron mayor presencia en las mujeres, mientras que en el estado de salud 5 ambos sexos presentaron una distribución similar (15,98% y 15,71%). En los estados con mayor carga de morbilidad de salud (estados 7, 8 y 9) los hombres alcanzaron un porcentaje ligeramente mayor que las mujeres (0,81%, 0,50% y 0,39% frente a 0,57%, 0,38% y 0,20%, respectivamente).
Tabla 1. Población y gasto sanitario total.
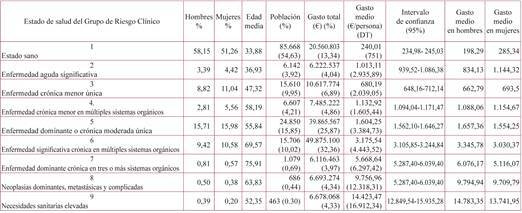
La edad media de la población en cada estado de salud fue creciente en función del incremento de la carga de morbilidad, desde la edad media de 33,88 años en el estado de los sujetos sanos hasta llegar al estado de salud 7, en el que la edad media fue de 75,9 años, a partir del cual descendió siendo de 63,8 en el estado 8 y 52,4 años en el 9.
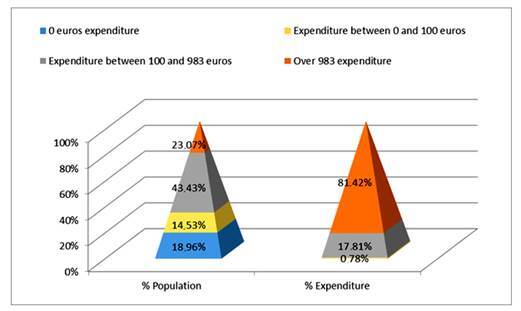
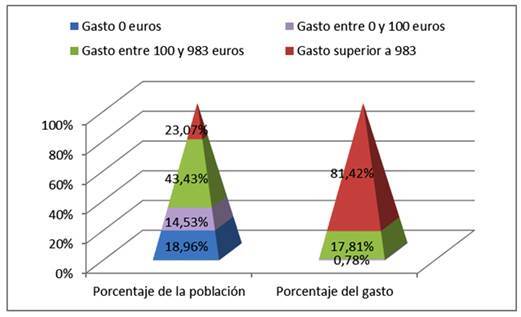
El gasto sanitario de la totalidad de la población del Departamento alcanzó los 154.114.809 euros, lo que representó un gasto medio por habitante de 983 euros con una desviación típica de 696. El 18,96% de la población no produjo ningún gasto sanitario y el 14,53% tuvo un gasto inferior a 100 euros. Los habitantes con un gasto sanitario superior a la media (23,07%) realizaron el 81,42% del gasto total (Figura 2).
Figura 2. Distribución del gasto sanitario.
Por estados de salud (Tabla 1), el estado de los sujetos sanos, incluidos los no usuarios, supuso el 13,34% del gasto total a pesar de que fue el más numeroso (54,63%). También en el estado de salud 3 el porcentaje de población (9,95%) fue ligeramente mayor que el gasto (6,89%). En los niveles 2 y 4 ambos porcentajes fueron similares (3,92% y 4,21% frente a 4,04 y 4,86%, respectivamente). Los estados de salud 5 y 6 concentraron más del 50% del gasto total (25,87% y el 32,36%, respectivamente) cuando tan solo significaron el 15,85% y el 10,02 % de la población. Por último, los estados de salud más graves (7, 8 y 9) incluyeron solo al 1,42% de la población y generaron el 12,64% del gasto total.
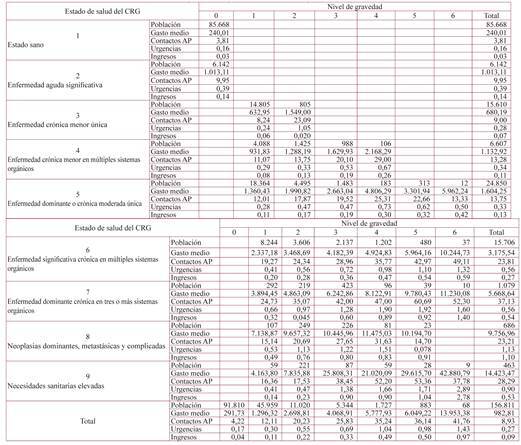
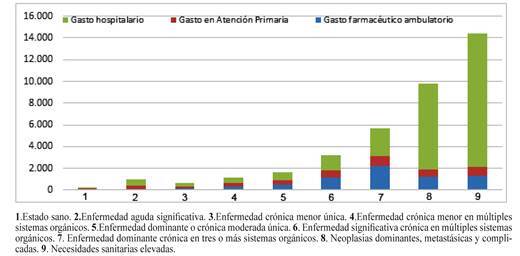
El gasto medio sanitario aumentó conforme lo hacía el número y gravedad de las enfermedades crónicas, pasando de 240 euros por habitante en el nivel 1 a 14.423 euros en el nivel 9. El gasto medio de cada estado de salud resultó ser significativamente diferente del resto en todos los casos posibles como se desprende de los valores que aparecen en la última columna de la Tabla 2. Por sexo el gasto sanitario medio fue en las mujeres de 1.000 euros y en los hombres de 964 euros (p=0,007) y también fue mayor en las mujeres en los estados de salud 1, 2, 3 y 4, mientras que en los restantes estados de salud (5 al 9) los hombres registraron mayor consumo, de forma que la distribución del gasto medio por sexo recogida en las dos últimas columnas de la Tabla 1 por estados de salud resultó ser significativamente distinta (p=0,000).
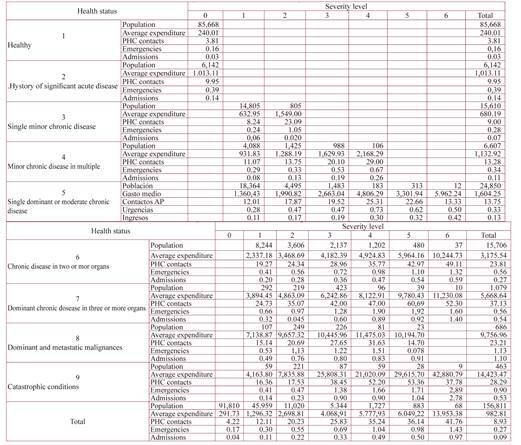
Tabla 2. Población, gasto medio (€/habitante), contactos en atención primaria, urgencias hospitalarias e ingresos hospitalarios por estado de salud y nivel de gravedad.
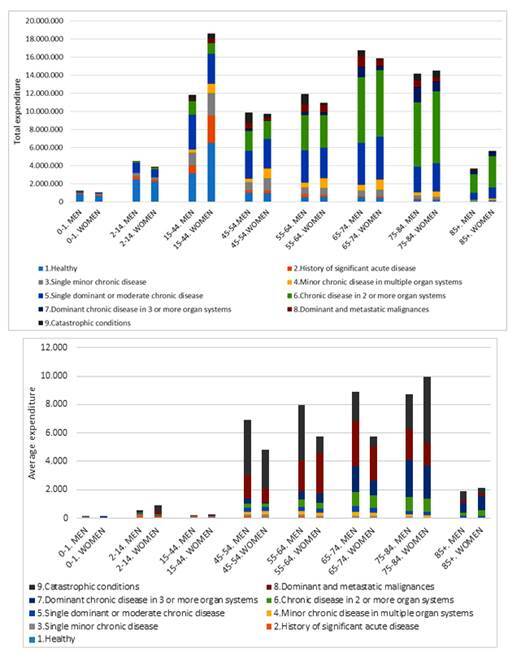
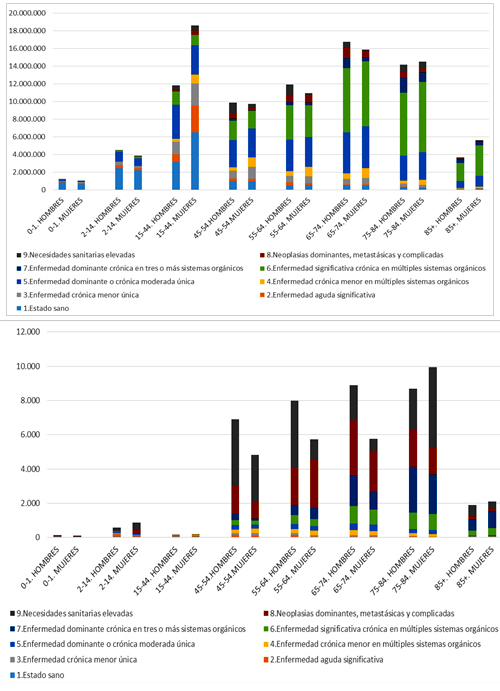
Diferenciando por rango de edad, sexo y estado de salud (Figura 3) el gasto total en los grupos de edad de 15-44 años y de 65-74 fue del orden de 32.000.000 euros, en el primer grupo el gasto total de las mujeres fue de 18.596.376 euros y el de los hombres de 11.814.668 euros, diferencia ocasionada fundamentalmente por los estados de salud 1 y 2. En el rango de edad de 65-74, el gasto fue similar en ambos sexos (16.000.00 euros) y tuvo la misma distribución por estados de salud. El rango de edad 75-84 años fue el tercer grupo de mayor gasto total, de 14.194.382 euros para hombres y 14.502.472 para mujeres con una distribución similar en cuanto al gasto total por estados de salud. Pero si se estudia el gasto medio, la población de este rango de edad (75-84 años) fue la que mayor gasto medio tuvo, de 9.946 euros las mujeres y 8.696 euros los hombres, cuyas diferencias se debieron fundamentalmente a un mayor gasto de las personas en el estado de salud 9. Le siguieron en cuantía de gasto medio y, por este orden, los rangos de edad 65-75; 55-64 y 45-54, en los que en todos ellos el gasto medio de los hombres fue mayor que el de las mujeres, debido igualmente al gasto de las personas en el estado de salud 9.
Figura 3. Gasto sanitario total (€) y medio (€/habitante) por género, rango de edad y estado de salud del Grupo de Riesgo Clínico.
Al descender a los niveles de gravedad (ACRG3) (Tabla 2), el grupo poblacional con mayor gasto medio fue el estado de salud 9 con el nivel de gravedad 6 (42.881 euros) a pesar de que en el nivel de gravedad 1 el gasto medio fue la décima parte (4.163 euros). Dentro de los estados de salud 6 y 7 la variabilidad entre los niveles de gravedad fue muy grande, con diferencias de hasta 8.000 euros entre los niveles más extremos.
El número medio de contactos al año en atención primaria estuvo próximo a 9 por habitante, pasando de 3,81 contactos en el estado de salud de sano a alcanzar el valor más alto (37) en el estado de salud 7 (Tabla 2). Esto significa que no se observó un incremento continuo de contactos con el empeoramiento de la salud, sino que en los peores estados de salud 8 y 9 el número de contactos descendió a 23 y 28, respectivamente. Lo mismo ocurrió con el incremento de la gravedad dentro de los estados de salud 5, 7, 8 y 9, de forma que en el último estado de gravedad descendió el número de contactos.
Se atendió una media de 0,27 urgencias hospitalarias por habitante. El estado de salud de sujetos sanos tuvo una media de 0,16 urgencias y en el estado de salud 7 se produjeron 1,13. Los estados de salud 8 y 9 tuvieron menos urgencias que el estado 7.
Los ingresos hospitalarios totales fueron de 13.911, lo que representó una media de 0,09 ingresos por habitante. En el estado de salud 8 la media de ingresos fue de 1,10. En el 7 la media de ingresos fue de 0,54 y en el 9 de 0,53.
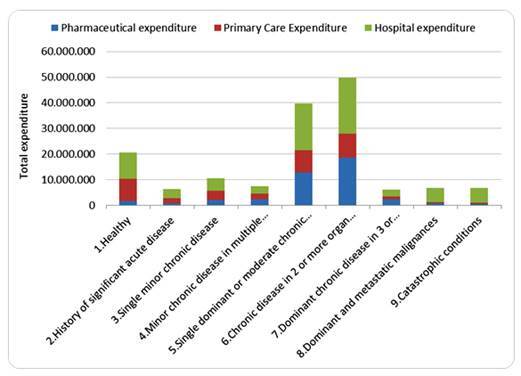
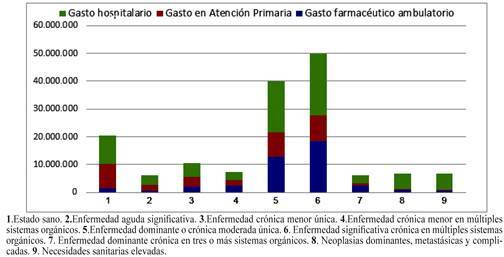
Por conceptos se registró un gasto hospitalario de 75.933.585 (49,27%) euros, en atención primaria de 36.562.637 (23,72%) y de farmacia ambulatoria 41.618.585 (27,01%) euros. Los estados de salud 6 y 5 (Figura 4), concentraron la mayor parte del gasto hospitalario (22.033.722 y 18.353.528 euros, respectivamente), de atención primaria (9.343.135 y 8.746.380 euros respectivamente) y del gasto farmacéutico ambulatorio (18.498.242 y 12.765.659 euros).
Figura 4. Distibución del gasto sanitario medio (€/habitante) por estado de salud según Grupos de Riesgo Clínico.
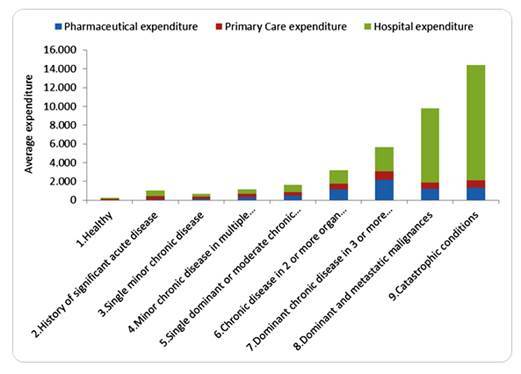
El gasto medio hospitalario fue de 484,24 euros/habitante, el de atención primaria de 233,16 euros/habitante y de farmacia ambulatoria 265,41 euros/habitante. La distribución entre los tres conceptos fue cambiando conforme empeoró el estado de salud (Figura 5). Las personas en el estado de salud 2 registraron un gasto hospitalario del 57,34%. En los estados de salud del 3 al 7 el gasto farmacéutico ambulatorio fue incrementándose hasta alcanzar el 38,77% en el estado de salud 7, al mismo tiempo que disminuyó el peso del gasto en atención primaria. Esta tendencia en la distribución cambió drásticamente en los estados de salud 8 y 9, en los que aumentó considerablemente el gasto hospitalario (80,86% y el 85,23%, respectivamente) en detrimento de los producidos por los otros dos conceptos.
Figura 5. Distibución del gasto sanitario medio (€/habitante) por estado de salud según Grupos de Riesgo Clínico.
Diferenciando por sexo, el gasto medio hospitalario fue significativamente mayor en los hombres (499,06 euros) que en las mujeres (470,04 euros) (p=0,012), al contrario que en atención primaria que fue menor en hombres (209,18 euros frente a 256,13 euros en mujeres) (p=0,000) y lo mismo ocurrió en farmacia ambulatoria (256,06 euros en hombres y 274,35 euros en mujeres) (p=0,000). A nivel de estados de salud no se encontraron diferencias estadísticamente significativas por sexo en los estados 3, 4, 8 y 9 pero sí en los estados de salud 1 y 2, en los que el gasto medio total fue menor en los hombres (198,29 frente a 285,34 euros en el estado 1 y 834,13 frente a 1.114,32 euros en el estado 2) y en los estados de salud 5, 6 y 7 en los que los hombres realizaron un mayor gasto medio, en concreto, 1.657,36; 3.345,78 y 6.076,17 euros respectivamente mientras que en el sexo femenino el gasto medio fue de 1.554,25 en el estado 5, de 3.030,37 en el estado 6 y de 5.116,07 euros en el estado 7.
DISCUSIÓN
Los resultados del presente estudio muestran una concentración del gasto sanitario en un grupo reducido de pacientes con mayor edad y comorbilidad según los Grupos de Riesgo Clínico. Igualmente se observa una distribución por concepto de gasto diferente según los niveles de morbilidad y severidad.
Se obtuvo una agrupación por morbilidad según estratificación por Grupos de Riesgo Clínico similar a otro trabajo previo realizado también en la Comunidad Valenciana11 pero presentó diferencias con respecto a otros estudios desarrollados en otros lugares de España3,15,16. En nuestro caso, el porcentaje de los estados de salud 4, 5 y 6 fue mayor, pero menor el porcentaje de los estados de sanos y no usuarios y 2. Ello pudo ser debido al año de estudio16) y especialmente a una diferente estructura poblacional2,3,4, dado que en el Departamento de salud analizado se encontró una población mucho más envejecida, como consecuencia del elevado número de personas mayores de otros países europeos que residen en la comarca de la Marina Alta. No obstante, estas diferencias pudieron originarse también por una mejor codificación de los registros electrónicos, que ha ido mejorando en los últimos años por parte de los facultativos.
El incremento de los estados de salud de mayor morbilidad con la edad concuerda con otros trabajos3,4,20 y también sucede que en el grupo de más de 85 años16 aumenta el estado de salud de sujetos sanos, fenómeno conocido como "hipótesis de la compresión de la morbilidad"22.
El gasto medio por habitante de 983 euros está en consonancia con el valor obtenido en otros estudios realizados en España, que obtuvieron un gasto medio de 842,8 euros13 en 2005 y 685,5 euros en 20074. Y también en Canadá donde en el año 2014 el gasto medio fue de 1.382 $ para los sujetos mayores de 19 años5. Las diferencias de gasto pueden ser debidas a una diferente morbilidad pero, sobre todo, a la forma de calcular el gasto y los conceptos incluidos. Según datos del Ministerio de Sanidad en el mismo año 2013 el gasto sanitario público consolidado en la Comunidad Valenciana fue de 1.109 euros/habitante y en el conjunto de España de 1.208 euros23, en los cuales se incluyeron los gastos de capital y de funcionamiento global del sistema sanitario español.
Al igual que ocurrió en otros trabajos previos2,3,4,5, este gasto medio se incrementó progresivamente desde los estados de salud más leves a los más complejos, a excepción del nivel 3 que presentó un gasto sanitario medio inferior a los pacientes del nivel inferior 2, de prácticamente la mitad, debido posiblemente a que los pacientes agudos requieren de un mayor consumo hospitalario que los crónicos. Además, en todos los trabajos estudiados resultó que el coste del estado de salud 9 presentó un valor mucho más alto en comparación con el resto de los estados.
Por último, llama la atención que el gasto medio de los estados de salud 6 y 7 es el doble que el de los estados 5 y 6, respectivamente, al igual que ocurrió en otro trabajo anterior2.
La distribución del coste por sexo y morbilidad mostró un mayor coste medio en las mujeres en los estados de salud del 1 al 4, al contrario de lo que ocurrió en el resto de los estados más graves, debido posiblemente a la mayor esperanza de vida de las mujeres, lo que se contradice con otros trabajos en los que en todos los estados de salud las mujeres tuvieron mayor coste3.
En todos los grupos de edad el gasto total fue ligeramente mayor en hombres que en mujeres, excepto en el de más de 85 años, por ser la población de mujeres mayor que la de hombres y, sobre todo, en el grupo de 15-44 años debido a los estados de salud 1 y 2 posiblemente por lo embarazos.
Además de contrastar la distribución de la población por morbilidad y gasto medio con otros trabajos realizados en España y en el extranjero, la principal aportación de este estudio es que se analiza la actividad en atención primaria y hospitalaria y la distribución del gasto individual entre gasto hospitalario, atención primaria y farmacéutico ambulatorio para la totalidad de la población de un departamento de salud, análisis del cual no se disponen de datos obtenidos en otros trabajos para poder comparar. Algunos estudios han analizado la actividad en cada ámbito, pero no el gasto2.
Se observó un incremento de la actividad en atención primaria con los estados de salud y el nivel de gravedad dentro de cada estado, a excepción de en los peores estados y niveles de gravedad, lo cual pudo ser debido a que requieren mayor atención hospitalaria, lo que quedó corroborado con el mayor número de ingresos y urgencias hospitalarias realizadas en los estados de salud 7, 8 y 9.
Aunque el gasto medio hospitalario en el Departamento fue el más elevado de los tres conceptos de gasto estudiados, seguido del de farmacia ambulatoria y de atención primaria, esto no se mantuvo en todos los estados de salud. Por ejemplo, en los habitantes del estado de salud 2 el peso del gasto hospitalario fue mayor que la media debido a su condición de pacientes agudos sin enfermedades crónicas. Pero en los estados de salud del 3 al 7 se observó un incremento del gasto farmacéutico ambulatorio por el mayor consumo de fármacos para el tratamiento de las enfermedades crónicas. Esto coincide con otros estudios que han estudiado el gasto farmacéutico ambulatorio en función de las condiciones crónicas11, de forma que con el trabajo actual se ratifica la importancia de este tipo de gasto por paciente en los estados de salud 6, 7 y 8.
También se observa en este estudio el importante gasto medio hospitalario en los mismos estados de salud (6, 7 y 8) y de forma llamativa en el estado 9, de manera que en todos ellos es superior a la media. Aunque resulta difícil comparar estos resultados con los de otros países como Canadá y con los de otros sistemas de clasificación5, se ha podido ratificar un incremento creciente con la morbilidad del gasto hospitalario medio y de forma exponencial en los estados más severos (estados de salud 8 y 9).
No obstante, a pesar de que el gasto medio crece exponencialmente en los estados más severos, son los estados de salud 5 y 6 los que concentran el mayor gasto total en todos sus componentes, debido a la particularidad de la población muy envejecida que atiende el Departamento.
Por tanto, los resultados de este artículo ofrecen un mapa descriptivo de la distribución de la población en cuanto a estados de salud y consumo sanitario y la distribución por conceptos de gasto para cada estado de salud, información básica para elaborar cualquier estrategia de gestión o política sanitaria. La siguiente línea de investigación será la de replicar este estudio en otros departamentos de salud de la Comunidad Valenciana para verificar los resultados y extrapolar su estructura de consumo y estados de salud a la totalidad de la Comunidad Valenciana.
La modelización de los costes en función de la carga de morbilidad permitirá establecer sistemas de financiación capitativa basados en los diagnósticos y estrategias de gestión de pacientes crónicos.
En general, estos sistemas de clasificación se antojan básicos para conocer el estado de salud de la población en aras de enfocar y dirigir con mayor precisión las políticas de prevención, promoción y gestión de enfermedades. Por lo tanto, este estudio representa una útil contribución para el estado del arte en un campo de investigación todavía en fase inicial en España.
Funding Statement
Fondo de Investigaciones de la Seguridad Social Instituto de Salud Carlos III (FIS PI12/0037)
Footnotes
Este trabajo fue financiado en parte por el Fondo de Investigaciones de la Seguridad Social Instituto de Salud Carlos III (FIS PI12/0037). No existen conflictos de interés.
Cita sugerida: Caballer Tarazona V, Guadalajara Olmeda N, Vivas Consuelo D, Clemente Collado A. Impacto de la morbilidad en los costes asistenciales de un Departamento de Salud de la Comunidad Valenciana a través de estudio de Grupos de Riesgo Clínico. Rev Esp Salud Pública. 2016;Vol. 90: 8 de junio: e1-e15.
BIBLIOGRAFÍA
- 1.1. García-Goñi M, Hernández-Quevedo C, Nuño-Solinis R, Paouluci F. Pathways towards chronic care-focused healthcare systems: Evidence from Spain. Health Policy. 2012;108(2-3):236-245. [DOI] [PubMed]; García-Goñi M, Hernández-Quevedo C, Nuño-Solinis R, Paouluci F. Pathways towards chronic care-focused healthcare systems: Evidence from Spain. Health Policy. 2012;108(2-3):236–245. doi: 10.1016/j.healthpol.2012.09.014. [DOI] [PubMed] [Google Scholar]
- 2.2. Carreras M, García-Goñi M, Ibern P, Coderch J, Vall-Llosera L, Inoriza JM. Estimates of patient costs related with population morbidity: can indirect costs affect the results? Eur J Heal Econ. 2010;12(4):289-295. [DOI] [PubMed]; Carreras M, García-Goñi M, Ibern P, Coderch J, Vall-Llosera L, Inoriza JM. Estimates of patient costs related with population morbidity: can indirect costs affect the results? Eur J Heal Econ. 2010;12(4):289–295. doi: 10.1007/s10198-010-0227-5. [DOI] [PubMed] [Google Scholar]
- 3.3. Carreras M, Ibern P, Coderch J, Sánchez I, Inoriza JM. Estimating lifetime healthcare costs with morbidity data. BMC Health Serv Res. 2013;13(1):1-11. [DOI] [PMC free article] [PubMed]; Carreras M, Ibern P, Coderch J, Sánchez I, Inoriza JM. Estimating lifetime healthcare costs with morbidity data. BMC Health Serv Res. 2013;13(1):1–11. doi: 10.1186/1472-6963-13-440. [DOI] [PMC free article] [PubMed] [Google Scholar]
- 4.4. Coderch J, Sánchez-Pérez I, Ibern P, Carreras M, Perez X, Inoriza JM. Predicción del riesgo individual de alto coste sanitario para la identificación de pacientes crónicos complejos. Gac Sanit. 2014;28(4):292-300. [DOI] [PubMed]; Coderch J, Sánchez-Pérez I, Ibern P, Carreras M, Perez X, Inoriza JM. Predicción del riesgo individual de alto coste sanitario para la identificación de pacientes crónicos complejos. Gac Sanit. 2014;28(4):292–300. doi: 10.1016/j.gaceta.2014.03.003. [DOI] [PubMed] [Google Scholar]
- 5.5. Seow H-Y, Sibley LM. Developing a dashboard to help measure and achieve the triple aim: a population-based cohort study. BMC Health Serv Res. 2014;14(1):1-10. [DOI] [PMC free article] [PubMed]; Seow H-Y, Sibley LM. Developing a dashboard to help measure and achieve the triple aim: a population-based cohort study. BMC Health Serv Res. 2014;14(1):1–10. doi: 10.1186/1472-6963-14-363. [DOI] [PMC free article] [PubMed] [Google Scholar]
- 6.6. Ellis RP, Pope GC, Iezzoni L, Ayanian JZ, Bates DW, Burstin H et al. Diagnosis-based risk adjustment for Medicare capitation payments. Health Care Financ Rev. 1996;17(3):101-128. [PMC free article] [PubMed]; Ellis RP, Pope GC, Iezzoni L, Ayanian JZ, Bates DW, Burstin H, et al. Diagnosis-based risk adjustment for Medicare capitation payments. Health Care Financ Rev. 1996;17(3):101–128. [PMC free article] [PubMed] [Google Scholar]
- 7.7. Pope GC, Kautter J, Ellis RP, Ash AS, Ayanian JZ, Lezzoni L et al. Risk adjustment of Medicare capitation payments using the CMS-HCC model. Health Care Financ Rev. 2004;25(4):119-141. [PMC free article] [PubMed]; Pope GC, Kautter J, Ellis RP, Ash AS, Ayanian JZ, Lezzoni L, et al. Risk adjustment of Medicare capitation payments using the CMS-HCC model. Health Care Financ Rev. 2004;25(4):119–141. [PMC free article] [PubMed] [Google Scholar]
- 8.8. Robst J, Levy JM, Ingber MJ. Diagnosis-based risk adjustment for medicare prescription drug plan payments. Health Care Financ Rev. 2007;28(4):15-30. [PMC free article] [PubMed]; Robst J, Levy JM, Ingber MJ. Diagnosis-based risk adjustment for medicare prescription drug plan payments. Health Care Financ Rev. 2007;28(4):15–30. [PMC free article] [PubMed] [Google Scholar]
- 9.9. Starfield B, Weiner J, Mumford L, Steinwachs D. Ambulatory care groups: a categorization of diagnoses for research and management. Health Serv Res. 1991;26(1):53-74. [PMC free article] [PubMed]; Starfield B, Weiner J, Mumford L, Steinwachs D. Ambulatory care groups: a categorization of diagnoses for research and management. Health Serv Res. 1991;26(1):53–74. [PMC free article] [PubMed] [Google Scholar]
- 10.10. Hughes J, Verill R, Eisenhandler J, Goldfield N, Muldoon J, Neff J. Clinical Risk Groups (CRGs): A Classification System for Risk-Adjusted Capitation-Based Payment and Health Care Management. Med Care. 2004;42(1):81-90. [DOI] [PubMed]; Hughes J, Verill R, Eisenhandler J, Goldfield N, Muldoon J, Neff J. Clinical Risk Groups (CRGs): A Classification System for Risk-Adjusted Capitation-Based Payment and Health Care Management. Med Care. 2004;42(1):81–90. doi: 10.1097/01.mlr.0000102367.93252.70. [DOI] [PubMed] [Google Scholar]
- 11.11. Vivas-Consuelo D, Usó-Talamantes R, Guadalajara-Olmeda N, Trillo-Mata J-L, Sancho-Mestre C, Buigues-Pastor L. Pharmaceutical cost management in an ambulatory setting using a risk adjustment tool. BMC Health Serv Res. 2014;14(1):462. [DOI] [PMC free article] [PubMed]; Vivas-Consuelo D, Usó-Talamantes R, Guadalajara-Olmeda N, Trillo-Mata J-L, Sancho-Mestre C, Buigues-Pastor L. Pharmaceutical cost management in an ambulatory setting using a risk adjustment tool. BMC Health Serv Res. 2014;14(1):462–462. doi: 10.1186/1472-6963-14-462. [DOI] [PMC free article] [PubMed] [Google Scholar]
- 12.12. Calderón-Larrañaga A, Abrams C, Poblador-Plou B, Weiner JP, Prados-Torres A. Applying diagnosis and pharmacy-based risk models to predict pharmacy use in Aragon, Spain: The impact of a local calibration. BMC Health Serv Res. 2010;10(1):1-9. [DOI] [PMC free article] [PubMed]; Calderón-Larrañaga A, Abrams C, Poblador-Plou B, Weiner JP, Prados-Torres A. Applying diagnosis and pharmacy-based risk models to predict pharmacy use in Aragon, Spain: The impact of a local calibration. BMC Health Serv Res. 2010;10(1):1–9. doi: 10.1186/1472-6963-10-22. [DOI] [PMC free article] [PubMed] [Google Scholar]
- 13.13. Sicras-Mainar A, Serrat-Tarres J. Measurement of relative cost weights as an effect of the retrospective application of adjusted clinical groups in primary care. Gac Sanit. 2006;20:132-141. [DOI] [PubMed]; Sicras-Mainar A, Serrat-Tarres J. Measurement of relative cost weights as an effect of the retrospective application of adjusted clinical groups in primary care. Gac Sanit. 2006;20:132–141. doi: 10.1157/13087324. [DOI] [PubMed] [Google Scholar]
- 14.14. Orueta JF, Nuño-Solinis R, Mateos M, Vergara I, Grandes G. Monitoring the prevalence of chronic conditions?: which data should we use?? BMC Health Serv Res. 2012;12(1): 365. [DOI] [PMC free article] [PubMed]; Orueta JF, Nuño-Solinis R, Mateos M, Vergara I, Grandes G. Monitoring the prevalence of chronic conditions?: which data should we use?? BMC Health Serv Res. 2012;12(1):365–365. doi: 10.1186/1472-6963-12-365. [DOI] [PMC free article] [PubMed] [Google Scholar]
- 15.15. De Miguel P, Caballero I, Javier F, Manera J, Auxiliadora M, Vicente D. Morbilidad observada en un área sanitaria?: variabilidad e impacto en profesionales y en financiación. Aten Primaria. 2015;47(5):301-307. [DOI] [PMC free article] [PubMed]; De Miguel P, Caballero I, Javier F, Manera J, Auxiliadora M, Vicente D. Morbilidad observada en un área sanitaria?: variabilidad e impacto en profesionales y en financiación. Aten Primaria. 2015;47(5):301–307. doi: 10.1016/j.aprim.2014.07.008. [DOI] [PMC free article] [PubMed] [Google Scholar]
- 16.16. Inoriza JM, Coderch J, Carreras M, Vall-Llosera L, García-Goñi M, Lisbona J et al. La medida de la morbilidad atendida en una organización sanitaria integrada. Gac Sanit. 2009;23(1):29-37. [DOI] [PubMed]; Inoriza JM, Coderch J, Carreras M, Vall-Llosera L, García-Goñi M, Lisbona J, et al. La medida de la morbilidad atendida en una organización sanitaria integrada. Gac Sanit. 2009;23(1):29–37. doi: 10.1016/j.gaceta.2008.02.003. [DOI] [PubMed] [Google Scholar]
- 17.17. Vivas D, Guadalajara N, Barrachina I, Trillo J-L, Usó R, de-la-Poza E. Explaining primary healthcare pharmacy expenditure using classification of medications for chronic conditions. Health Policy. 2011;103(1):9-15. [DOI] [PubMed]; Vivas D, Guadalajara N, Barrachina I, Trillo J-L, Usó R, de-la-Poza E. Explaining primary healthcare pharmacy expenditure using classification of medications for chronic conditions. Health Policy. 2011;103(1):9–15. doi: 10.1016/j.healthpol.2011.08.014. [DOI] [PubMed] [Google Scholar]
- 18.18. Orueta JF, Nuño-Solinis R, Mateos M, Vergara I, Grandes G, Esnaola S. Predictive risk modelling in the Spanish population: a cross-sectional study. BMC Health Serv Res. 2013;13(1):269. [DOI] [PMC free article] [PubMed]; Orueta JF, Nuño-Solinis R, Mateos M, Vergara I, Grandes G, Esnaola S. Predictive risk modelling in the Spanish population: a cross-sectional study. BMC Health Serv Res. 2013;13(1):269–269. doi: 10.1186/1472-6963-13-269. [DOI] [PMC free article] [PubMed] [Google Scholar]
- 19.19. Brotons C, Moral I, Pitarch M, Sellarès J. Estudio evaluativo de los costes asistenciales en atención primaria. Atención Primaria. 2007;39(9):485-489. [DOI] [PMC free article] [PubMed]; Brotons C, Moral I, Pitarch M, Sellarès J. Estudio evaluativo de los costes asistenciales en atención primaria. Atención Primaria. 2007;39(9):485–489. doi: 10.1157/13109499. [DOI] [PMC free article] [PubMed] [Google Scholar]
- 20.20. Inoriza JM, Pérez M, Cols M, Sánchez I, Carreras M. Análisis de la población diabética de una comarca: perfil de morbilidad, utilización de recursos, complicaciones y control metabólico. Aten Primaria. 2016;45(9):461-475. [DOI] [PMC free article] [PubMed]; Inoriza JM, Pérez M, Cols M, Sánchez I, Carreras M. Análisis de la población diabética de una comarca: perfil de morbilidad, utilización de recursos, complicaciones y control metabólico. Aten Primaria. 2016;45(9):461–475. doi: 10.1016/j.aprim.2013.04.007. [DOI] [PMC free article] [PubMed] [Google Scholar]
- 21.21. Diari Oficial de la Comunitat Valenciana. Decreto Legislativo 1/2005, de 25 de febrero, del Consell de la Generalitat, por el que se aprueba el Texto Refundido de la Ley de Tasas de la Generalitat. DOCV núm. 4971 de 22 de Marzo de 2005.; Diari Oficial de la Comunitat Valenciana Decreto Legislativo 1/2005, de 25 de febrero, del Consell de la Generalitat, por el que se aprueba el Texto Refundido de la Ley de Tasas de la Generalitat. DOCV. 2005 Mar 22;(4971)
- 22.22. Mor V. The compression of morbidity hypothesis: a review of research and prospects for the future. J Am Geriatr Soc. 2005;53(9 Suppl):S308-S309. [DOI] [PubMed]; Mor V. The compression of morbidity hypothesis: a review of research and prospects for the future. J Am Geriatr Soc. 2005;53(9 Suppl):S308–S309. doi: 10.1111/j.1532-5415.2005.53496.x. [DOI] [PubMed] [Google Scholar]
- 23.23. Lillo-Fernández de Cuevas JM, Rodríguez-Blas M del C. Estadística de Gasto Sanitario Público, 2013. Disponible en: http://www.msssi.gob.es/estadEstudios/estadisticas/docs/EGSP2008/egspPrincipalesResultados.pdf ; Lillo-Fernández de Cuevas JM, Rodríguez-Blas M del C. Estadística de Gasto Sanitario Público, 2013. http://www.msssi.gob.es/estadEstudios/estadisticas/docs/EGSP2008/egspPrincipalesResultados.pdf


