. 2024 Nov 8;12:RP90695. doi: 10.7554/eLife.90695

Figure 3. Inflammation responses of human-induced pluripotent stem cell (hiPSC)-derived microglial cells following lipopolysaccharide (LPS) stimulation.

(A) Ingenuity Pathway Analysis (IPA) showed different gene expression (fold change >twofold, p < 0.05) between LPS-treated and control hiPSC-derived microglial cells, demonstrating activation of core pathways involving IL6, IL1A, IL1B, and IFNG. (B) Assessment of mRNA expression of selected genes for inflammatory cytokines using quantitative reverse transcription-PCR (qRT-PCR; Oligonucleotide primers are provided in Supplementary 4) demonstrated increased expression following LPS (0.1 µg/ml) stimulation for 6 hr (3-6 replicates). These changes corresponded to increases in the protein expression levels of inflammatory cytokines following 24 hr of LPS stimulation as measured with a Multiplex kit (Millipore) in cell lysate (C) and conditioned media (D). The data in (C) and (D) are presented as means ± SEM (3-6 replicates). *p < 0.05, **p < 0.01, ***p < 0.001.

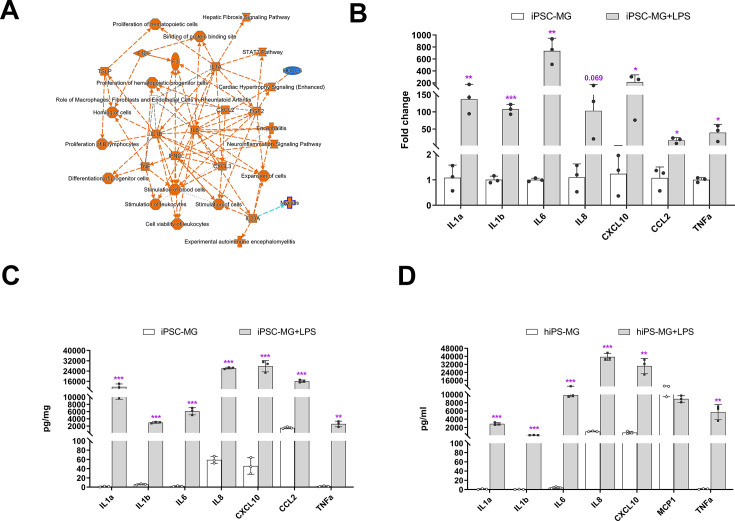
Figure 3.

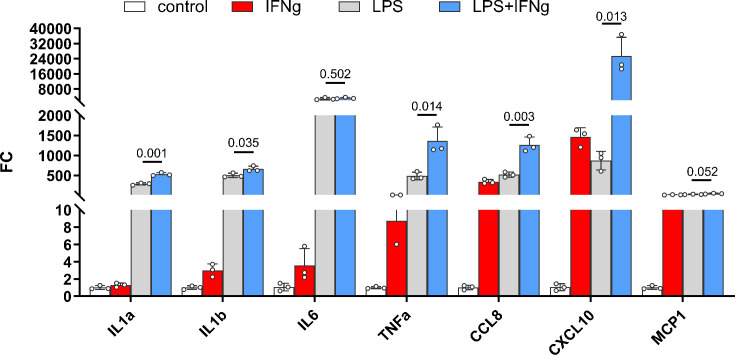
Figure 3—figure supplement 1. Inflammatory cytokines were produced synthetically by IFNG and LPS in human-induced pluripotent stem cell (hiPSC)-derived microglial cells.

Figure 3—figure supplement 1.

hiPSC-derived microglial cells were cultured in 6-well plates for 14 days, 20 ng/ml of human IFNG and 0.5 µg/ml of LPS were added to the wells, respectively, or 20 ng/ml of human IFNG and 0.5 µg/ml of LPS were added to the wells together. After 6 hr of incubation, the cells were washed and harvested into a 1.5-ml Eppendorf tube for RNA isolation with a NucleoSpin RNA/Protein Mini kit (Macherey-Nagel, #740933.50). The cDNA was synthesized with PrimeScript 1st strand cDNA Synthesis Kit (Takara, #6110A). Quantitative reverse transcription-PCR (qRT-PCR) was performed using a SYBR green RT-PCR kit (Affymetrix), using the Bio-Rad CFX96 Touch Real-Time PCR Detection System under the following conditions: denaturation at 95°C for 5 min, followed by 40 cycles of 95°C for 10 s, and then 60°C for 45 s. Threshold cycle (CT) values were calculated and expressed as fold-induction determined using the comparative CT (2ΔΔCT) method. Ribosomal protein S13 (RPS13) and GAPDH were used as internal controls. Oligonucleotide primers are provided in Supplementary 4, the samples have 3 replicates. .