Medical Sciences, Biophysics and Computational Biology Correction for “Phenotypic screening of the ReFRAME drug repurposing library to discover new drugs for treating sickle cell disease,” by Belhu Metaferia, Troy Cellmer, Emily B. Dunkelberger, Quan Li, Eric R. Henry, James Hofrichter, Dwayne Staton, Matthew M. Hsieh, Anna K. Conrey, John F. Tisdale, Arnab K. Chatterjee, Swee Lay Thein, and William A. Eaton, which published September 26, 2022; 10.1073/pnas.2210779119 (Proc. Natl. Acad. Sci. U.S.A. 119, e2210779119).
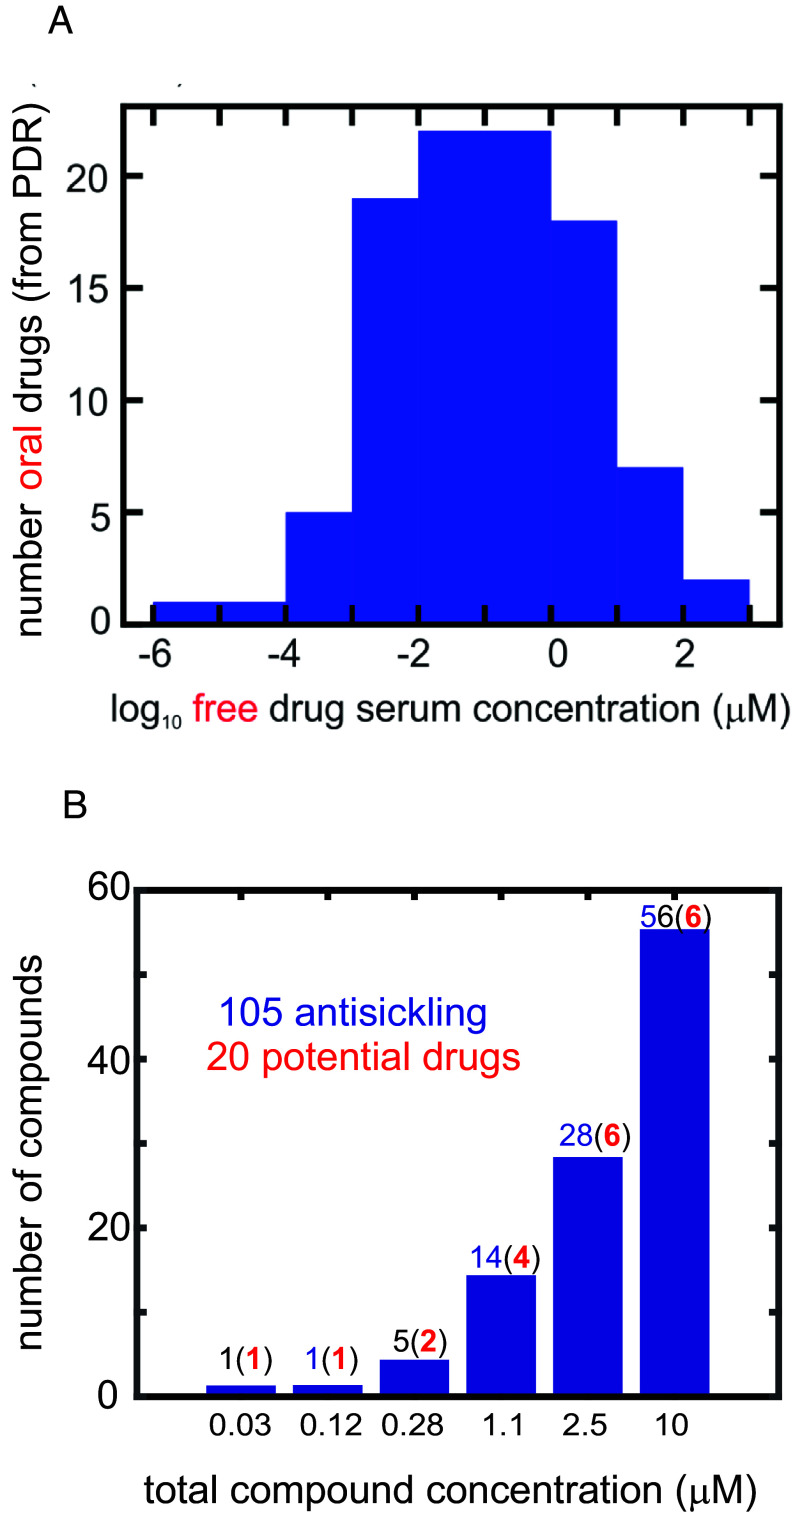
The authors note: “The lowest inhibitory concentration (LIC) for Niferidil, the 2nd entry in Table 1 on page 5, was incorrectly entered in the table as 0.031 micromolar. It should be 10 micromolar. Consequently, on a statistical basis, there are therefore now 20 potential drugs instead of 21.”
21 has been changed to 20 throughout the main text of the article in the following locations:
-
1.
The Abstract
-
2.
The Significance Statement
-
3.
Page 3, right column, first full paragraph, last line
-
4.
Page 5, left column, second paragraph, line 11
Table 1, Fig. 5B, and SI Appendix, Table S1 have also been updated.
Table 1.
List of antisickling compounds with lowest inhibitory concentrations (LIC) less than 10 μM
| Name of Compound | IC50 (μM)* | LIC (μM)† |
|---|---|---|
| Ammonium Trichlorotellurate‡,§ | 0.032 ± 0.015 | 0.031 |
| Niferidil‡,** | 10.5 | 0.031 |
| Mavatrep | 0.23 ± 0.14 | 0.123 |
| Manoalide‡ | 0.33 ± 0.09 | 0.278 |
| HR325‡ | 3.0 ± 0.86 | 0.278 |
| NSD-721‡ | 13 ± 2.0 | 0.278 |
| FT-11‡ | 1.3 ± 1.0 | 0.278 |
| Mitapivat‡ | 0.25 ± 0.16 | 0.278 |
| ARA DMAP‡ | 3.9 ± 1.1 | 1.1 |
| Pafuramidine‡ | 6.0 ± 5.8 | 1.1 |
| Cisplatin‡,§,¶ | 1.3 ± 0.2 | 1.1 |
| Cloturin‡,‖ | 9.7 ± 0.5 | 1.1 |
| EF-4040‡ | 1.7 ± 0.4 | 1.1 |
| Cyclovalone‡ | 1.7 ± 0.7 | 1.1 |
| VML 530 | 1.5 ± 0.2 | 1.1 |
| Peruvoside‡ | NA# | 1.1 |
| ONO-7746 | 3.8 ± 2.0 | 1.1 |
| BMS-919373§,¶,‖ | 6.4 ± 8.1 | 1.1 |
| KUX-1151‡ | 5.3 ± 5.1 | 1.1 |
| NT-113 | 3.6 ± 2.8 | 1.1 |
| Curcumin | 0.50 ± 0.14 | 1.1 |
| AEG-33783‡,§ | 1.4 ± 0.5 | 1.1 |
| VRT-532‡ | 5.8 ± 0.7 | 2.5 |
| Licochalcone A | 4.3 ± 2.4 | 2.5 |
| NSC-150117 | 2.6 ± 0.7 | 2.5 |
| AT-101§ | 2.4 ± 0.1 | 2.5 |
| Darapladib§,¶ | 2.0 ± 0.4 | 2.5 |
| Oxyfedrine Hydrochloride | 2.9 ± 1.1 | 2.5 |
| Octenidine‡,§,¶ | NA# | 2.5 |
| WP-1066‡ | 3.9 ± 1.2 | 2.5 |
| Butein | 10 ± 3 | 2.5 |
| Ethacrynic Acid‡ | 3.3 ± 0.9 | 2.5 |
| TS-80‡ | 3.1 ± 1.6 | 2.5 |
| SC-1 | 10 ± 5 | 2.5 |
| Tucaresol | 3.1 ± 0.3 | 2.5 |
| CBS-1114 | 7.2 ± 5.2 | 2.5 |
| YM 57158 | 2.5 ± 0.3 | 2.5 |
| Allisartan‡ | 7.8 ± 4.6 | 2.5 |
| Elisartan Potassium | 5.6 ± 4.0 | 2.5 |
| Samixogrel | 4.2 ± 2.0 | 2.5 |
| AM-103‡,§,‖ | 4.5 ± 2.6 | 2.5 |
| ODM-103‡,‖ | 9.0 ± 2.2 | 2.5 |
| ON-09310 | 5.9 ± 1.7 | 2.5 |
| P-7435‡ | NA# | 2.5 |
| AZD-4769 | 2.5 ± 0.9 | 2.5 |
| Calcimycin | 2.1 ± 0.1 | 2.5 |
| Vadadustat‡ | 7.9 ± 6.3 | 2.5 |
| Metabromsalan‡ | 8.0 ± 2.5 | 2.5 |
| IMD-0560 | 2.3 ± 1.1 | 2.5 |
| laflunimus | 7.2 ± 3.7 | 2.5 |
*Concentration that produces 50% inhibition.
†Lowest concentration of statistically significant inhibition.
‡LIC is antisickling for cells from 2 of 3 donors.
§Compound causes lysis at high concentration, antisickling at lower concentration.
¶IC50s could only be determined for one of the donor samples for these compounds because of an insufficient number of data points higher than 0% inhibition.
#Incubated for 8 h.
‖IC50s could not be determined for these three compounds because of an insufficient number of data points higher than 0% inhibition.
**IC50s could only be determined for 2 of the 3 donor samples for these compounds because of an insufficient number of data points higher than 0% inhibition.
Fig. 5.
Comparing inhibitory concentrations in assay and oral drug concentrations in the PDR (one column figure). (A) Distribution of 97 free oral drug concentrations (Cmax) in the 2015 version of the PDR. The free concentration was given either explicitly in the PDR or obtained from the given total serum Cmax and the percentage bound to serum proteins. (B) Distribution of ReFrame total compound concentrations with statistically significant inhibition at each concentration, defined as . The red numbers in parentheses result from multiplying the number (in blue) of compounds by the fraction of oral drugs with that free concentration or higher from the distribution in Fig. 5A. For inhibitory mechanisms other than those resulting from binding to hemoglobin, the total compound concentration is also the free concentration. For compounds that inhibit by binding to hemoglobin, the free concentration is less than the total concentration. In the 2,000-fold diluted blood used for the assay, the hemoglobin molecule is at a concentration of ~1 μM, while the molar concentration of red cells is ~4 fM.


