Abstract
Gastric cancer (GC) is a common malignant tumor worldwide, characterized by complex biological processes. The distribution of various cell types and gene expression profiles in the GC microenvironment remains unclear. This study uses single-cell RNA sequencing to explore gene expression patterns and identify differentially expressed genes in GC samples, offering new insights into cellular diversity and potential molecular mechanisms. We conducted temporal and clustering analyses with single-cell sequencing, followed by Gene Ontology (GO) and Kyoto Encyclopedia of Genes and Genomes (KEGG) analyses to clarify their functions. Using machine learning, we identified relevant genes to create highly accurate prediction models. Additionally, ssGSEA analysis provided detailed insights into the immunosuppressive tumor microenvironment, revealing complex gene expression interactions and diverse immune infiltrates in cancer. Correlation analysis highlighted TIMP1 as having significant prognostic value across different immune cell subtypes. Single-cell RNA sequencing revealed the cellular landscape and gene expression profiles of the GC microenvironment, offering crucial data on how cell heterogeneity is regulated in relation to the tumor microenvironment. Moreover, new insights into the expression levels of AGT, INHBA, and TIMP1 showed distinct sex-biased gene functions within the tumor microenvironment. These findings enhance our understanding of the molecular mechanisms associated with gastric cancer development and may lay the groundwork for identifying novel therapeutic targets and diagnostic strategies.
Supplementary Information
The online version contains supplementary material available at 10.1007/s12672-024-01591-z.
Keywords: Cancer, Single-cell RNA sequencing, Differentially expressed genes, Immune microenvironment, Biomarkers
Introduction
Stomach cancer remains a significant global health challenge, particularly in East Asia, where incidence and mortality rates are high. Early-stage gastric cancer symptoms are often subtle and progress slowly, leading to delayed diagnosis and missed opportunities for optimal treatment, such as surgical resection, resulting in poor prognosis for many patients. Therefore, understanding the molecular mechanisms of stomach cancer and identifying new biomarkers and treatment targets are essential for accurate diagnosis and early intervention, ultimately improving patient outcomes [1–3]. The advent of bioinformatics and systems biology has shifted the focus from single molecular signatures to the complex networks of molecular interactions. Groundbreaking single-cell RNA sequencing technologies allow us to examine cellular dynamics and the tumor microenvironment with high resolution, offering unprecedented insights into tumor heterogeneity. Recent evidence underscores the critical role of the tumor microenvironment (TME) in tumor progression and metastasis. Single-cell RNA sequencing (scRNA-seq) has unveiled the complex intercellular communication between various TME cell subtypes and tumor cells. In addition to tumor cells, the TME comprises diverse cell types such as cancer-associated fibroblasts (CAFs), tumor-associated macrophages (TAMs), T cells, and B cells. This diversity is crucial for tumor adaptation, evolution, and resistance to therapies [4–6]. The groundbreaking single-cell RNA sequencing technologies have provided us tools to delineate cellular dynamics and the tumor microenvironment at high resolution and brought about an unprecedented view into the inherent heterogeneity of tumors. Recent evidence highlights the critical role of the tumor microenvironment (TME) in tumor progression and metastasis. Single-cell RNA sequencing (scRNA-seq) has revealed the intricate intercellular communication between various TME cell subtypes and tumor cells. Besides tumor cells, the TME includes diverse cell types such as cancer-associated fibroblasts (CAFs), tumor-associated macrophages (TAMs), T cells, and B cells [7–10]. This diversity is crucial for tumor adaptation, evolution, and resistance to therapeutic interventions.
In this study, we utilized advanced single-cell RNA sequencing combined with multi-omics analysis to dissect the gene expression profiles of stomach cancer cells. We identified differentially expressed genes and explored their biological roles and pathways through gene function enrichment analysis. Machine learning algorithms helped us pinpoint genes with prognostic value in stomach cancer from a vast array of candidates. These genes are deeply involved in the disease’s progression and hold promise as biomarkers and therapeutic targets. We also developed predictive models based on these key genes, demonstrating high accuracy in independent datasets.
This research has significant potential for developing novel immunotherapy strategies. We performed single-cell distribution analysis of genes at varying expression levels and examined their cellular distribution patterns. While the roles of genes like TIMP1 in the tumor microenvironment need further elucidation, their expression may be crucial for tumor cell behavior and the stability of the tumor microenvironment. In summary, this study integrates single-cell datasets and multi-omics analysis, providing a cellular blueprint and key gene expression patterns within cell clusters, and revealing complex interactions that contribute to the immune landscape of stomach cancer tissues.
Methods
Data source
The gastric cancer-related data in this study is from TCGA . The TCGA data can be accessed at http://cancergenome.nih.gov/ (bulkGSE84437). The single-cell expression data (GSE112302) comes from all available gastric cancer collections in TISCH [11, 12].
Acquisition of immune-related genes
ImmPort is a comprehensive immunology data resource aimed at promoting the sharing and analysis of immunology data. Through this platform, we have identified immune-related genes.
Differential gene expression in gastric cancer
To identify differential genes, we used the “limma” package in the R software to study mRNA samples in the TCGA database.
GO/KEGG analysis
We performed Gene Ontology (GO) and KEGG enrichment analysis using the “clusterProfiler” R package to help us understand the underlying mechanisms of progression and pathogenesis [13–15].
Building prognostic models with machine learning
In the realm of gastric cancer inquiries, we deployed the TCGA-STAD dataset to cultivate machine learning models, which were subsequently authenticated on the GSE84437 dataset. A differential expression analysis determined the gene set containing candidate genes. Apply the following genes for modeling: AGT, INHBA, MAGEA3, FN1, TIMP1, CXCR4, COL4A2. Afterwards, the datasets were cleaned and preypare for model growth using the caret library Predictive models were built using a combination of separate machine learning approaches (logistic regression, random forest, support vector machines and glmBoost). Ultimately, these models were evaluated using cross-validation, with area under the ROC curve (AUC) serving as the primary efficacy metric. When we moved to the validation stage, the models were scarified against the GSE84437 dataset for their flexibility and relevancy. The glmBoost model emerged as the best one, showing excellent performance in both training and validation phases. ROC curves were also plotted to visually assess the predictive ability of the models while using the pROC package.The model identifies significant genes associated with survival outcomes. The risk score is calculated as a weighted sum of the expression levels of these genes. The formula is: Risk Score=∑ i=1n (βi × Expression Level of Genei) βi represents the coefficient of gene i from the Cox model, indicating its contribution to the risk.
Single-cell RNA sequence
Employing single-cell RNA sequencing, the GSE112302 dataset was analyzed to explore the diversity of cells within the gastric cancer microenvironment. The Seurat package was utilized for data curation, commencing with a quality control step to eliminate subpar cells. This was followed by the normalization of data and the selection of highly variable genes to facilitate dimensionality reduction. We proceeded with Principal component analysis (PCA) and t-distributed stochastic neighbor embedding (t-SNE) using the RunPCA and RunTSNE functions to discern unique cell clusters. Cell classification was guided by the expression of established marker genes, and clustering was executed through the FindClusters function. The FindMarkers function was then applied for a differential gene expression analysis, revealing the transcriptional profiles of signature genes across different cell clusters. The culmination of our analysis was the generation of t-SNE plots and heatmaps, which illuminated the spatial arrangement and functional attributes of cells in the tumor microenvironment. These visualizations laid the groundwork and analytical scaffold for future biological inquiries.
Statistical analysis
All analyses were performed using R software. The choice between t-test and Mann-Whitney U test was based on whether the data conformed to a normal distribution. Significance was typically defined as p < 0.05.
Results
Interpreting the tumor microenvironment heterogeneity of gastric cancer
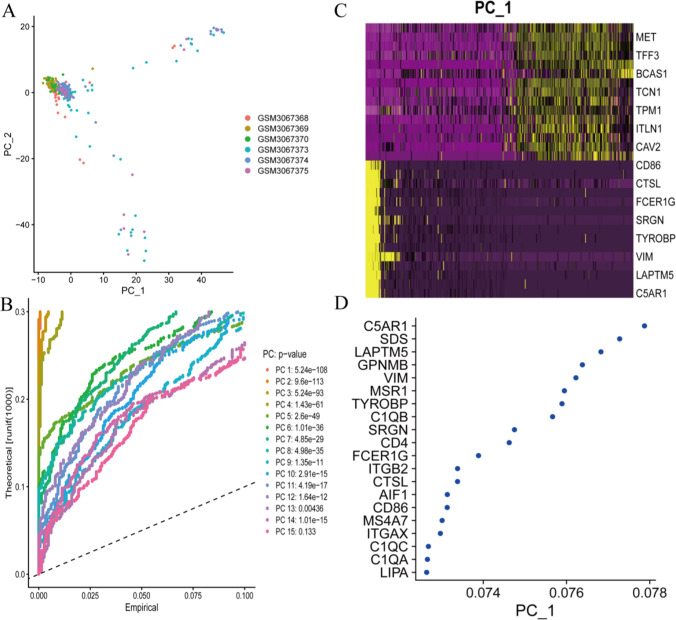
Firstly, quality control was carried out on single-cell data, as shown in Supplementary Fig. 1. The plot illustrates the standard deviations of PC1 and PC2 (Fig. 1A and D) in a Principal Component Analysis (PCA) to evaluate the variability among different cellular populations. The greater dispersion of tumor cells in the PC space, compared to other cell types, may reflect the complex gene regulatory networks that drive adaptive changes.
Fig. 1.
Interpreting the tumor microenvironment heterogeneity of gastric cancer. This figure shows the standard deviations A-D of PC1 and PC2 in principal component analysis (PCA) to evaluate the variability between various cell populations
The gene expression patterns and differentially expressed genes in stomach cancer samples
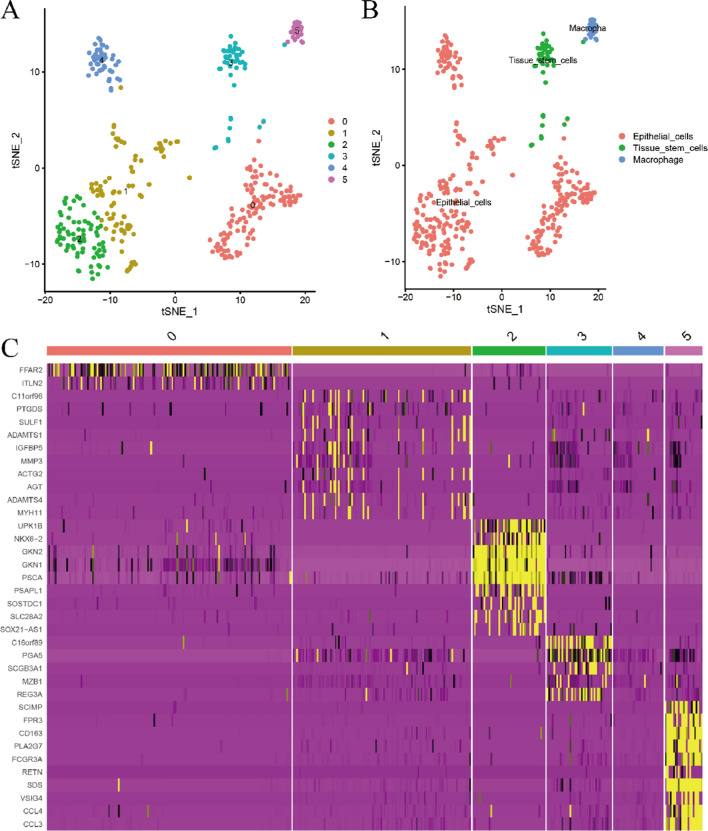
Figure 2A is a single-cell clustering diagram that categorizes cells into six groups, labeled 0 to 5. Figure 2B differentiates cells based on endothelial phenotypes, separating them into endothelial cells and macrophages. Figure 2C is a heatmap, with the horizontal axis representing different single-cell types and the vertical axis showing gene expression levels. These figures help identify genes with significantly different expressions in cancer, offering important clues for future functional studies. Gene validation in Supplementary Fig. 2.
Fig. 2.
The gene expression patterns and differentially expressed genes in stomach cancer samples. A is a single-cell clustering diagram, which divides single cells into 6 categories from 0 to 5. B classifies cells based on endothelial cell phenotypes, separating them into endothelial cells and macrophages. C is a heatmap, where the horizontal axis represents different single-cell types, and the vertical axis represents the expression of different genes. Through these figures, the study identified genes with significantly different expressions in cancer, providing important clues for subsequent functional studies
Single-cell pseudo-time analysis
The image displays the distribution of different cells across two main components (Component 1 and Component 2). Cells are arranged along a continuous trajectory, potentially representing their progression in a biological process. They are divided into several clusters (cluster0 to cluster5), indicating that the analysis algorithm identified different cell states or types based on gene expression patterns (Fig. 3A). This trajectory may reflect their pseudo-time progression, with movement from cluster0 to cluster5 suggesting a transition from an undifferentiated state to a mature or specialized functional state. Specific cell types, such as epithelial cells and macrophages, are labeled, highlighting their significance in pseudo-time analysis or their critical roles in the process. The image may illustrate transitions in cell states, such as changes from one cell type to another or shifts in functional states (Fig. 3B and C).
Fig. 3.
Single-cell pseudo-time analysis. The image shows the distribution of different cells on two main components (Component 1 and Component 2). A Cells are divided into several different clusters (cluster0, cluster1, cluster2, cluster3, cluster4, cluster5). B and C The arrangement of cells along the trajectory may represent their pseudo-time progression in a process. D The image may show transitions in cell states, such as transitioning from one cell type to another, or from one functional state to another
Consensus clustering analysis
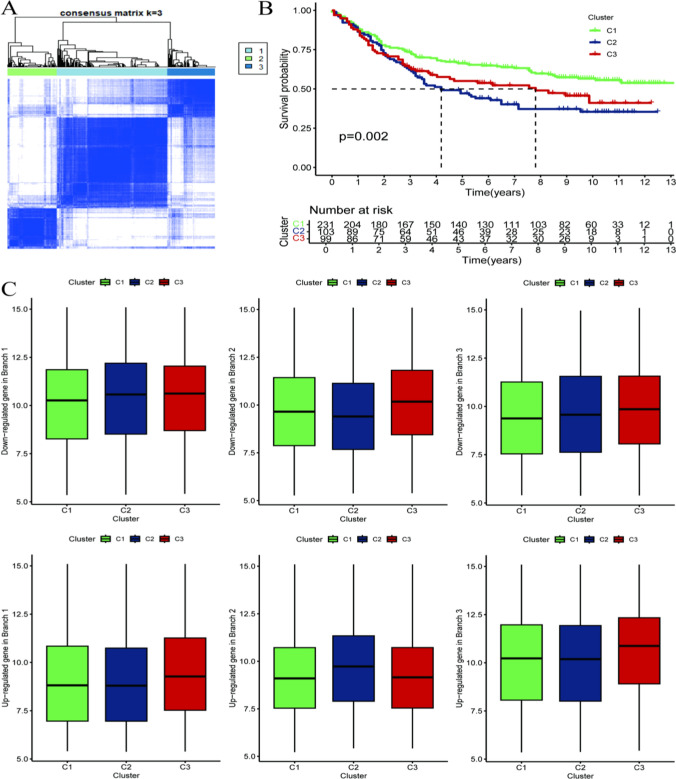
Figure 4A. Consensus Matrix (Cluster number, k = 3): The analysis identifies three clusters (C1, C2, C3). The matrix values represent the consistency or similarity among cluster members, with higher values indicating greater consistency within clusters. This figure helps illustrate the relationships between clusters based on these scores. Figure 4B. The survival analysis graph shows changes in survival probability over time, likely analyzing tumor patient survival rates and displaying the remaining risk at each time point. It may demonstrate the relationship between different clusters (C1, C2, C3) and patient survival rates, indicating, for example, that a specific cluster (such as C3) is associated with lower survival rates. Figure 4C may highlight differences in gene expression among clusters, particularly focusing on genes that are downregulated in specific branches (e.g., Branch 3).
Fig. 4.
Consensus clustering analysis. A Consensus Matrix (Cluster number, k = 3): The analysis considered three clusters (C1, C2, C3). B The survival analysis graph shows the changes in survival probability over time, possibly analyzing the survival rate of tumor patients, displaying the remaining risk quantity at each time point. The graph may demonstrate the relationship between different clusters (C1, C2, C3) and patient survival rates. C may display the differences in gene expression among different clusters, particularly genes downregulated in specific branches
The expression patterns of key genes, network relationships, and their association with immune cell infiltration in gastric cancer research
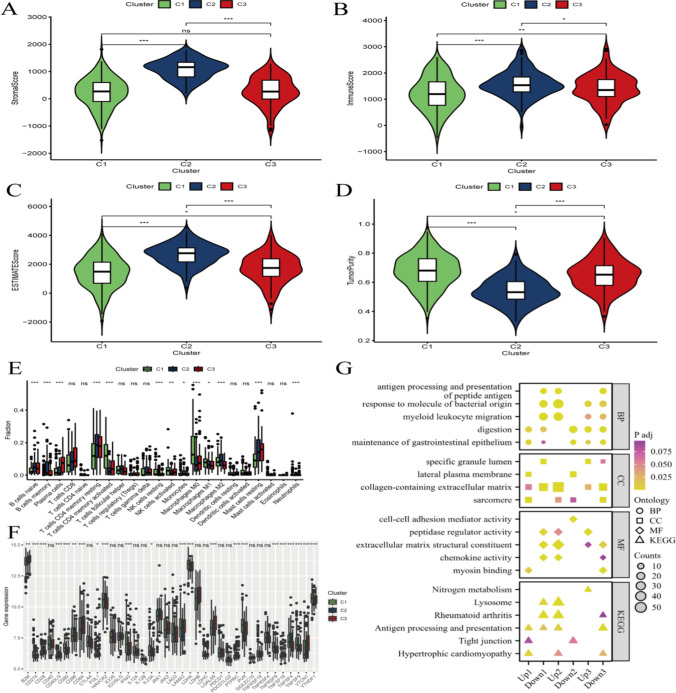
Figure 5A and E: These images display the number of immune cells in different clusters (C1, C2, C3), showing the relative abundance of immune cells. Positive or negative values may indicate the level of immune cell infiltration in the tumor microenvironment. Figure 5F shows the expression levels of core genes across different clusters. Figure 5G highlights that these core genes may be highly expressed in certain clusters, illustrating biological processes related to immune cell infiltration, such as antigen processing and presentation, response to bacterial molecules, myeloid cell migration, and digestion. It may also list cell components where immune cells are particularly concentrated, such as specific extracellular matrix and membrane compartments.
Fig. 5.
The expression patterns of key genes, network relationships, and their association with immune cell infiltration in gastric cancer research. A-E he images may show the relative quantity or abundance of immune cells in different clusters (C1, C2, C3). F shows the expression levels of core genes in different clusters. G shows these core genes may be highly expressed in certain clusters, and the images may demonstrate biological processes related to immune cell infiltration, such as antigen processing and presentation, response to bacterial molecules, myeloid cell migration, digestion, etc
Constructing a gastric cancer prediction model
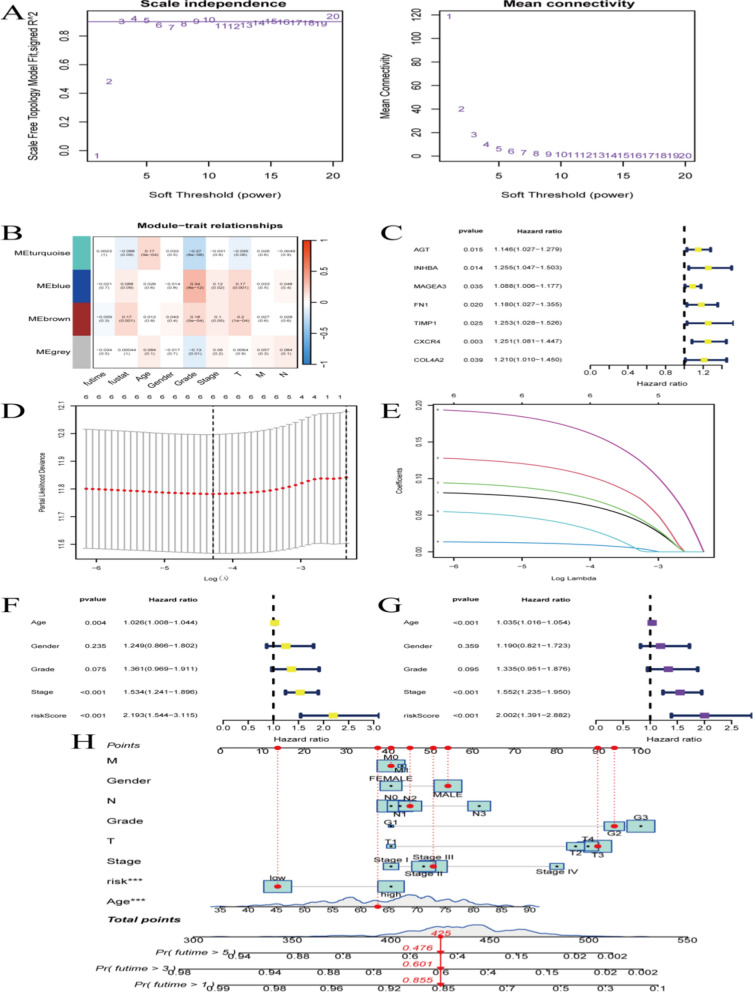
Figure 6A illustrates the relationship between network characteristics, such as average connectivity, and scale invariance. Figure 6B shows the fitting of the scale-free network model, using Signed R² as a measure of goodness of fit. Figure 7C displays the hazard ratios between different modules (like MEturquoise, MEblue) and specific features (such as AGT, INHBA). Figure 6D presents survival analysis hazard ratios, highlighting the relationship between clinical features (such as age, gender, grading, staging) and hazard ratios. Figure 6E shows model selection using Log Lambda, illustrating the log-likelihood deviation of the model at different Lambda values and the magnitude of variable coefficients. Figure 6F-H depict risk scoring and survival curves, showing the relationship between various factors and risk scores. Samples are divided into training and testing groups to validate the clinical significance of the model’s predictions. Survival curves indicate significant differences between high and low scoring groups. The model predicts survival rates at 1, 2, and 3 years in both the training and test sets.
Fig. 6.
Constructing a gastric cancer prediction model. A Demonstrates the relationship between network characteristics (such as average connectivity) and scale invariance. B Shows the fitting of the scale-free network model, using Signed R² as an indicator of the goodness of fit. C Displays the Hazard Ratios between different modules (such as MEturquoise, MEblue, etc.) and specific features (such as AGT, INHBA, etc.). D Survival analysis Hazard Ratio. E Model selection Log Lambda: Displays the log-likelihood deviation of the model under different Lambda values, showing the magnitude of coefficients of different variables in the model. F-H Risk scoring and survival curves demonstrate the relationship between various factors and risk scores, dividing samples into training and testing groups to validate the clinical significance of the model’s predictions
Fig. 7.
Model Function Testing. A and B show two curves representing two different models or tests. Calculate the area under the curve (AUC) at 1 year, 3 years, and 5 years. In C and D, two sets (possibly low-risk and high-risk groups) of survival curves are displayed. These curves may represent overall observed survival (OS) and cumulative hazard rates. E and F show indicators that change over time, such as survival rate or risk. The time axis may range from 0 to a specific number of years, displaying survival rate predictions based on predictive models (such as a nomogram)
Model functionality test
Figure 7A and B show two curves representing different models or tests. The area under the curve (AUC) is calculated at 1, 3, and 5 years. Model A has an AUC of 0.605 at 1 year, 0.653 at 3 years, and 0.775 at 5 years. Model B has an AUC of 0.462 at 1 year, 0.517 at 3 years, and 0.545 at 5 years. Figure 7C and D present survival curves for two groups, possibly low-risk and high-risk. These curves may represent overall survival (OS) and cumulative hazard rates, showing survival rates or risk comparisons at specific time points. The statistical significance (p-value) is indicated, showing a significant difference between the groups (p < 0.001). Figure 8E and F display a measure that changes over time, such as survival rate or risk. The time axis ranges from 0 to a specific number of years, showing survival rate predictions based on a predictive model, like a Nomogram.
Fig. 8.
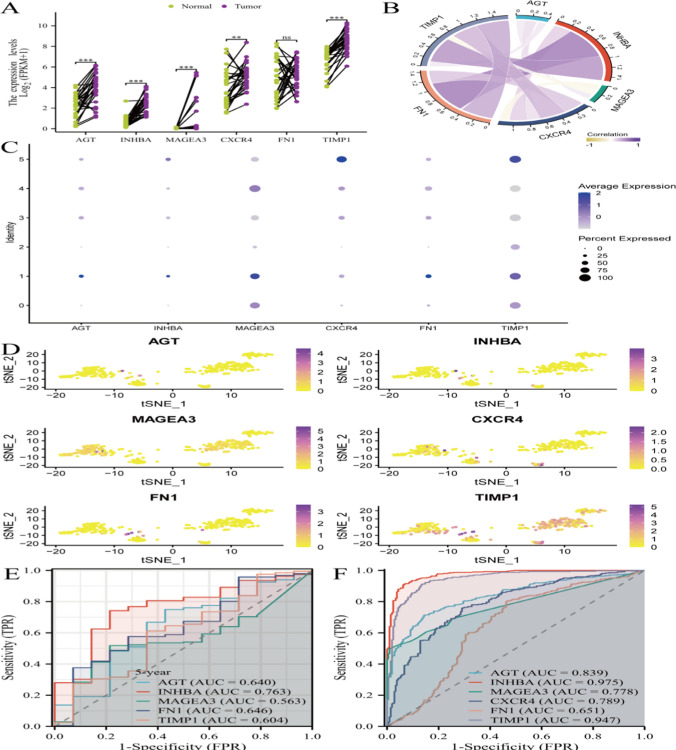
Model gene function testing. A displays the expression levels of specific genes (such as INHBA, AGT, TIMP1, CXCR4, MAGEA3, etc.) in normal and tumor tissues. B uses scatter plots or correlation coefficients to show the correlation between certain genes. C explains the expression of different genes in different types of cells. D may display the distribution of different samples (such as normal and tumor) in t-SNE analysis. E and F show ROC curves of AGT, INHBA, MAGEA3, CXCR4, FN1, TIMP1
Functional testing of the models gene
Figure 8A shows the expression levels of specific genes (such as INHBA, AGT, TIMP1, CXCR4, MAGEA3, etc.) in normal versus tumor tissues. Figure 8B demonstrates the correlation between certain genes using scatter plots or correlation coefficients. Figure 8C illustrates gene expression in different cell types, while Fig. 8D depicts the distribution of samples (such as normal and tumor) in a t-SNE analysis. Figure 8E and F display ROC curves for AGT, INHBA, MAGEA3, CXCR4, FN1, and TIMP1.
Discussion
This study used single-cell transcriptome sequencing and multi-omics analysis to thoroughly explore the complex biological processes in gastric cancer. Our findings enhance the understanding of cellular heterogeneity and molecular mechanisms in GC, providing a valuable resource for identifying new therapeutic targets and biomarkers. Single-cell RNA sequencing revealed gene expression states and the cellular landscape within the GC microenvironment [16, 17]. Importantly, this high-resolution view of the tumor microenvironment (TME) identified differentially expressed genes (DEGs) involved in cancer progression. Temporal and clustering analyses further clarified the roles these DEGs may play [18]. Additionally, bioinformatics analyses using Gene Ontology (GO) and the Kyoto Encyclopedia of Genes and Genomes (KEGG) with DAVID revealed enriched pathways involving key genes, suggesting their potential functions. Machine learning algorithms successfully sorted numerous genes, each potentially indicative of prognosis. Predictive models constructed from these genes demonstrated strong accuracy and potential for GC diagnosis and prognosis [19]. One of the most insightful findings came from immune landscape analysis, primarily through ssGSEA, which elucidated the complex relationships between gene expression and immune cell infiltration [20–22], TIMP1 (Tissue Inhibitor of Metalloproteinases 1) is a protein that plays a role in regulating the extracellular matrix by inhibiting metalloproteinases. In the context of gastric cancer, TIMP1 is often associated with tumor progression and metastasis.TIMP1 is frequently overexpressed in gastric cancer tissues compared to normal tissues. High levels of TIMP1 can correlate with poor prognosis.TIMP1 contributes to the remodeling of the tumor microenvironment, which can facilitate cancer cell invasion and metastasis.Due to its association with aggressive tumor behavior, TIMP1 may serve as a potential biomarker for prognosis in gastric cancer patients.TIMP1 may influence immune cell infiltration and the immune response within the tumor microenvironment, affecting tumor progression.Targeting TIMP1 or its pathways could offer new therapeutic strategies for treating gastric cancer [23–26].
With the combination of single-cell data and multi-omics analysis, a cellular map of GC elasticity has already been predicated, where comprehensive gene expression as well as complex gene-network have also been vaulted. The molecular profiles of AGT, INHBA and TIMP1 were developed with the potential to further investigate their biological functions in tumor microenvironment.
Machine learning algorithms can analyze imaging data, such as endoscopic or histopathological images, to improve early detection and accurate diagnosis of gastric cancer.By analyzing large datasets, machine learning can identify patterns and biomarkers associated with patient outcomes, helping to predict prognosis and survival rates. Algorithms can assess genetic, molecular, and clinical data to tailor treatment plans to individual patients, optimizing therapeutic effectiveness and minimizing side effects.Machine learning can accelerate drug discovery processes by predicting how gastric cancer cells will respond to various compounds, identifying potential new therapies.By integrating multi-omics data (genomics, transcriptomics, proteomics), machine learning helps uncover the complex biological processes and pathways involved in gastric cancer [27–31].
These machine-learning based predictive models have demonstrated good external accuracy, which demonstrates the potential for future clinical implementation. The models have been diligently validated using ROC curves which demonstrate the diagnostic capacity for testing different models on new unseen data.
The clustering analysis was conducted to identify distinct cellular subpopulations within the gastric cancer microenvironment. This approach allows for the characterization of cellular heterogeneity, revealing specific gene expression patterns and pathways associated with different clusters. By doing so, we aim to uncover the roles of various cell types and their interactions in cancer progression, ultimately identifying potential therapeutic targets and biomarkers. This analysis provides a deeper understanding of the tumor microenvironment’s complexity and its impact on disease development and treatment response. As shown in the ROC curves (Fig. 7A and B). Model A demonstrates higher AUC values at 1, 3, and 5 years compared to Model B, indicating better predictive performance. This suggests that Model A more accurately identifies patients’ risk levels and survival probabilities.The survival curves (Fig. 7C and D) further illustrate the distinction, showing a clear separation between high-risk and low-risk groups with significant p-values (p < 0.001). This indicates that Model A provides a more reliable stratification of patients based on risk, contributing to its superior prognostic capability. Overall, the authors attribute the differences to the models’ ability to capture relevant clinical and molecular features, with Model A being more effective in predicting outcomes and guiding clinical decisions.
Overall, this study has provided new insights into the molecular complexities of GC and thereby may potentially offer a solid scientific base for development of innovative therapeutics and diagnostic modalities. Further studies are warranted to validate our findings in larger patient populations and the molecular functions of GC-related genes. Indeed, the discovery of personalised medicine avenues from these findings holds enormous potential to enhance patient outcomes.
Limitation
The study relies on datasets from TCGA , which may not fully capture the genetic diversity present in different populations. This could limit the generalizability of the findings. The study identifies potential gene interactions and pathways, but the complexity of these networks means that further experimental validation is necessary to confirm the findings. The predictive models developed using machine learning are based on existing datasets and may not perform equally well on entirely new or unseen data. The models require further validation in clinical settings.While some novel biomarkers are identified, their roles in cancer biology and potential as therapeutic targets require further investigation.
Conclusion
In summary, this study has identified the important role of ferroptosis in gastric cancer and provided new paradigms for molecular classification, prognosis prediction and therapeutic strategies for GC based on systemic multidimensional bioinformatics analysis.
Electronic supplementary material
Author contributions
Tao Peng has completed the design and writing of the entire text.
Data availability
The data that supported the fndings of this study are openly available in database (GSE84437), more details could be acquired from the corresponding author upon reasonable request.
Declarations
Competing interests
The authors declare no competing interests.
Footnotes
Publisher’s note
Springer Nature remains neutral with regard to jurisdictional claims in published maps and institutional affiliations.
References
- 1.Han Y, Oh JK, Lim MK. The effect of healthy eating on the development of stomach and colorectal cancer by the smoking and drinking status: results from the Korean National Cancer Center (KNCC) community cohort study. Cancer Med. 2024;13(16):e70053. [DOI] [PMC free article] [PubMed] [Google Scholar]
- 2.Pastorino R, Pires Marafon D, Sassano M, Hoxhaj I, Pelucchi C, Liao LM, Rabkin CS, Sinha R, Lunet N, Morais S, et al. Aspirin but not statins is inversely related to gastric cancer with a duration-risk effect: results from the stomach cancer pooling project consortium. Cancer. 2024. 10.1002/cncr.35510. [DOI] [PMC free article] [PubMed] [Google Scholar]
- 3.Zhu W, Dong W, Liu Y, Bai R. The stomach cancer epidemic in Chinese mainland: current trends and future predictions. Chin Med J (Engl). 2024. 10.1097/CM9.0000000000002993 [DOI] [PMC free article] [PubMed] [Google Scholar]
- 4.Ayan D, Gul MA, Karabay U, Bulut SM. Bioinformatic investigation of genetic changes in paraoxonase genes in breast cancer and breast cancer subtypes. Eur J Breast Health. 2024;20(3):178–84. [DOI] [PMC free article] [PubMed] [Google Scholar]
- 5.du Plessis J, Deroubaix A, Omar A, Penny C. A bioinformatic analysis predicts that cannabidiol could function as a potential inhibitor of the MAPK pathway in colorectal cancer. Curr Issues Mol Biol. 2024;46(8):8600–10. [DOI] [PMC free article] [PubMed] [Google Scholar]
- 6.Liang L, Liang X, Yu X, Xiang W. Bioinformatic analyses and integrated machine learning to predict prognosis and therapeutic response based on E3 ligase-related genes in colon cancer. J Cancer. 2024;15(16):5376–95. [DOI] [PMC free article] [PubMed] [Google Scholar]
- 7.Liu J, Xia W, Xue F, Xu C. Exploring a new signature for lung adenocarcinoma: analyzing cuproptosis-related genes through Integrated single-cell and bulk RNA sequencing. Discov Oncol. 2024;15(1):508. [DOI] [PMC free article] [PubMed] [Google Scholar]
- 8.Xu M, Zhang G, Cui T, Liu J, Wang Q, Shang D, Yu T, Guo B, Huang J, Li C. Cross-modal integration of bulk RNA-seq and single-cell RNA sequencing data to reveal T-cell exhaustion in colorectal cancer. J Cell Mol Med. 2024;28(18):e70101. [DOI] [PMC free article] [PubMed] [Google Scholar]
- 9.Zhang Y, Zhang Y, Pan C, Wang W, Yu Y. HPV-driven heterogeneity in cervical cancer: study on the role of epithelial cells and myofibroblasts in the tumor progression based on single-cell RNA sequencing analysis. PeerJ. 2024;12:e18158. [DOI] [PMC free article] [PubMed] [Google Scholar]
- 10.Xie J, Deng W, Deng X, Liang JY, Tang Y, Huang J, Tang H, Zou Y, Zhou H, Xie X. Single-cell histone chaperones patterns guide intercellular communication of tumor microenvironment that contribute to breast cancer metastases. Cancer Cell Int. 2023;23(1):311. [DOI] [PMC free article] [PubMed] [Google Scholar]
- 11.Hernandez-Gamarra M, Salgado-Roo A, Dominguez E, Goiricelaya Seco EM, Veiga-Rua S, Pedrera-Garbayo LF, Carracedo A, Allegue C. CARTAR: a comprehensive web tool for identifying potential targets in chimeric antigen receptor therapies using TCGA and GTEx data. Brief Bioinform. 2024;25(4):bbae326. [DOI] [PMC free article] [PubMed] [Google Scholar]
- 12.Patricio A, Costa RS, Henriques R. Pattern-centric transformation of omics data grounded on discriminative gene associations aids predictive tasks in TCGA while ensuring interpretability. Biotechnol Bioeng. 2024;121(9):2881–92. [DOI] [PubMed] [Google Scholar]
- 13.Abulfaraj AA, Shami AY, Alotaibi NM, Alomran MM, Aloufi AS, Al-Andal A, AlHamdan NR, Alshehrei FM, Sefrji FO, Alsaadi KH, et al. Exploration of genes encoding KEGG pathway enzymes in rhizospheric microbiome of the wild plant Abutilon fruticosum. AMB Express. 2024;14(1):27. [DOI] [PMC free article] [PubMed] [Google Scholar]
- 14.Castaneda EU, Baker EJ. KNeXT: a networkX-based topologically relevant KEGG parser. Front Genet. 2024;15:1292394. [DOI] [PMC free article] [PubMed] [Google Scholar]
- 15.Dvorak P, Hlavac V, Hanicinec V, Rao BH, Soucek P. Genes divided according to the relative position of the longest intron show increased representation in different KEGG pathways. BMC Genomics. 2024;25(1):649. [DOI] [PMC free article] [PubMed] [Google Scholar]
- 16.Cousin S, Guegan JP, Shitara K, Palmieri LJ, Metges JP, Pernot S, Fukuoka S, Koyama S, Nishikawa H, Bellera CA, et al. Identification of microenvironment features associated with primary resistance to anti-PD-1/PD-L1 + antiangiogenesis in gastric cancer through spatial transcriptomics and plasma proteomics. Mol Cancer. 2024;23(1):197. [DOI] [PMC free article] [PubMed] [Google Scholar]
- 17.Gan S, Li C, Hou R, Tian G, Zhao Y, Ren D, Zhou W, Zhao F, Lv K, Yang J. Dynamic changes of the immune microenvironment in the development of gastric cancer caused by inflammation. Mol Ther Oncol. 2024;32(3):200849. [DOI] [PMC free article] [PubMed] [Google Scholar]
- 18.Deng X, Liao T, Xie J, Kang D, He Y, Sun Y, Wang Z, Jiang Y, Miao X, Yan Y, et al. The burgeoning importance of PIWI-interacting RNAs in cancer progression. Sci China Life Sci. 2024;67(4):653–62. [DOI] [PubMed] [Google Scholar]
- 19.!!!. INVALID CITATION !!! [19–21].
- 20.Journal Of Healthcare Engineering. Retracted: construction of an immune-autophagy prognostic model based on ssGSEA immune scoring algorithm analysis and prognostic value exploration of the immune-autophagy gene in endometrial carcinoma (EC) based on bioinformatics. J Healthc Eng. 2023;2023:9834327. [DOI] [PMC free article] [PubMed] [Google Scholar]
- 21.Liu J, Lu J, Wang G, Gu L, Li W. Prognostic characteristics of a six-gene signature based on ssGSEA in sarcoma. Aging. 2024;16(2):1536–54. [DOI] [PMC free article] [PubMed] [Google Scholar]
- 22.Xu R, Du A, Deng X, Du W, Zhang K, Li J, Lu Y, Wei X, Yang Q, Tang H. tsRNA-GlyGCC promotes colorectal cancer progression and 5-FU resistance by regulating SPIB. J Exp Clin Cancer Res. 2024;43(1):230. [DOI] [PMC free article] [PubMed] [Google Scholar]
- 23.Li X, Niu N, Sun J, Mou Y, He X, Mei L. IL35 predicts prognosis in gastric cancer and is associated with angiogenesis by altering TIMP1, PAI1 and IGFBP1. FEBS Open Bio. 2020;10(12):2687–701. [DOI] [PMC free article] [PubMed] [Google Scholar]
- 24.Liu H, Xiang Y, Zong QB, Zhang XY, Wang ZW, Fang SQ, Zhang TC, Liao XH. Mir-6745-TIMP1 axis inhibits cell growth and metastasis in gastric cancer. Aging. 2021;13(21):24402–16. [DOI] [PMC free article] [PubMed] [Google Scholar]
- 25.Macedo FC, Cunha N, Pereira TC, Soares RF, Monteiro AR, Bonito N, Valido F, Sousa G. A prospective cohort study of TIMP1 as prognostic biomarker in gastric and colon cancer. Chin Clin Oncol. 2022;11(6):43. [DOI] [PubMed] [Google Scholar]
- 26.Zheng M, Wang P, Wang Y, Jia Z, Gao J, Tan X, Chen H, Zu G. Clinicopathological and prognostic significance of TIMP1 expression in gastric cancer: a systematic review and meta-analysis. Expert Rev Anticancer Ther. 2024;24(11):1169–76. [DOI] [PubMed] [Google Scholar]
- 27.Del Fernandez-Moreno C, Barrios-Carvajal M, Marti-Obiol ME, Gadea-Mateo R, Martin-Arevalo R, Lopez-Mozos J. Prognostic insights after surgery for advances in understanding signet ring cell gastric cancer: a machine learning approach. J Gastrointest Surg. 2024. 10.1016/j.gassur.2024.09.030. [DOI] [PubMed] [Google Scholar]
- 28.Han G, Liu X, Gao T, Zhang L, Zhang X, Wei X, Lin Y, Yin B. Prognostic prediction of gastric cancer based on H&E findings and machine learning pathomics. Mol Cell Probes. 2024;78:101983. [DOI] [PubMed] [Google Scholar]
- 29.Hou M, Chen J, Yang L, Qin L, Liu J, Zhao H, Guo Y, Yu QQ, Zhang Q. Identification of fatty acid metabolism-related subtypes in gastric cancer aided by machine learning. Cancer Manag Res. 2024;16:1463–73. [DOI] [PMC free article] [PubMed] [Google Scholar]
- 30.Ji K, Shi L, Feng Y, Wang L, Guo H, Li H, Xing J, Xia S, Xu B, Liu E, et al. Construction and interpretation of machine learning-based prognostic models for survival prediction among intestinal-type and diffuse-type gastric cancer patients. World J Surg Oncol. 2024;22(1):275. [DOI] [PMC free article] [PubMed] [Google Scholar]
- 31.Yue C, Xue H. Construction and validation of a nomogram model for lymph node metastasis of stage II-III gastric cancer based on machine learning algorithms. Front Oncol. 2024;14:1399970. [DOI] [PMC free article] [PubMed] [Google Scholar]
Associated Data
This section collects any data citations, data availability statements, or supplementary materials included in this article.
Supplementary Materials
Data Availability Statement
The data that supported the fndings of this study are openly available in database (GSE84437), more details could be acquired from the corresponding author upon reasonable request.


