

Abstract
Lung diseases represent a significant global health threat, impacting both well-being and mortality rates. Diagnostic procedures such as Computed Tomography (CT) scans and X-ray imaging play a pivotal role in identifying these conditions. X-rays, due to their easy accessibility and affordability, serve as a convenient and cost-effective option for diagnosing lung diseases. Our proposed method utilized the Contrast-Limited Adaptive Histogram Equalization (CLAHE) enhancement technique on X-ray images to highlight the key feature maps related to lung diseases using DenseNet201. We have augmented the existing Densenet201 model with a hybrid pooling and channel attention mechanism. The experimental results demonstrate the superiority of our model over well-known pre-trained models, such as VGG16, VGG19, InceptionV3, Xception, ResNet50, ResNet152, ResNet50V2, ResNet152V2, MobileNetV2, DenseNet121, DenseNet169, and DenseNet201. Our model achieves impressive accuracy, precision, recall, and F1-scores of 95.34%, 97%, 96%, and 96%, respectively. We also provide visual insights into our model’s decision-making process using Gradient-weighted Class Activation Mapping (Grad-CAM) to identify normal, pneumothorax, and atelectasis cases. The experimental results of our model in terms of heatmap may help radiologists improve their diagnostic abilities and labelling processes.
Keywords: DenseNet201, Attention, Pooling, Atelectasis, Pneumothorax
Introduction
Lung illness is a major global health concern, generating significant morbidity and mortality around the world. According to the World Health Organization (WHO), lung disorders such as chronic obstructive pulmonary disease (COPD), asthma, lung cancer, and pneumonia account for one out of every six fatalities worldwide, making them one of the main causes of death [1]. Because of the increasing prevalence of lung-related disorders, particularly in developing nations, proper diagnosis of such diseases is critical. Air pollution, smoking, occupational risks, and genetic factors are the principal causes of lung disease [2, 3]. These variables can cause lung tissue inflammation, damage, and scarring, leading to the development of various lung illnesses.
Two major lung diseases are (i) Atelectasis and (ii) Pneumothorax. Atelectasis is a condition caused by factors such as mucus obstructions, tumors, or pressure from outside the lung, which results in a partial or full collapse of lung tissues [4]. Pneumothorax, on the other hand, is generally caused by trauma or injury to the lungs or chest walls, resulting in lung collapse and breathing difficulties due to the presence of air or gas in the pleural cavity [5]. Accurate and timely diagnosis of these conditions from lung images is indispensable for the proper treatment.
Furthermore, early and accurate diagnosis of lung illnesses such as atelectasis might lower the healthcare burden and associated expenses dramatically. The key measures of lung illness detection are advanced screening technologies and diagnostic procedures such as Computed Tomography (CT) scans, X-rays, spirometry, and blood testing [6]. However, radiologists encounter considerable challenges when it comes to accurately analyzing patient health data. Manual identification of lung sickness requires time and is subject to radiologists’ expertise, resulting in delays in diagnosis and treatment [7–9].
X-ray imaging is the most widely used diagnostic technique among all available medical imaging methods. However, raw X-ray images often present several challenges in accurately diagnosing lung diseases. These images can suffer from issues such as low contrast, noise, artefacts, and variations in lighting. These imperfections can obscure critical details and make it challenging for radiologists and Artificial Intelligence (AI) based systems to provide precise diagnoses. To address these challenges, image enhancement techniques are an indispensable component in the medical imaging process. Image enhancement methods, such as contrast stretching, histogram equalization, and noise reduction, improve the quality and clarity of X-ray images. Enhancing the images allows subtle features and abnormalities to be more easily detectable.
In this study, we applied the contrast-limited histogram equalization (CLAHE) enhancement algorithm to improve the image pixel contrast. CLAHE and machine learning techniques were used by Islam and Nahiduzzaman [10] to detect COVID-19 from CT images to achieve an accuracy of 99.73%. A new contrast enhancement method based on brightness preserving dynamic fuzzy histogram equalization and singular value decomposition with discrete wavelet transform techniques was proposed by Mnassri et al. [11] to detect multiple sclerosis from MRI (Magnetic Resonance Imaging) images.
The transfer learning techniques using pre-trained models are playing a significant role in several medical diagnoses, including lung diseases. The models trained on vast datasets with various medical images have proven invaluable in automating the diagnosis process. By leveraging the deep learning capabilities of pre-trained models, computer-aided design systems can recognize complex patterns and abnormalities in X-ray images with high accuracy. This approach speeds up the diagnostic process and ensures a consistent level of precision, making it a vital tool in assisting radiologists and healthcare professionals. Studies have demonstrated the effectiveness of pre-trained deep learning models like ResNet, VGG16, VGG19, Xception, MobilenetV2, Inception, and DenseNet, and they are widely used for the detection and classification of lung diseases like pneumonia [12, 13], COVID-19 [14, 15], pneumothorax [16, 17]. Researchers have reported remarkable success rates in sensitivity and specificity, paving the way for integrating AI-driven solutions into clinical practice. The symbiotic relationship between image enhancement techniques and pre-trained models can revolutionize the field of diagnostic radiology, offering faster and more accurate diagnoses of lung diseases and improving patient health and early recovery [18].
However, very few works have been reported for the identification of lung collapse diseases such as atelectasis and pneumothorax. Motivated by the applications of pre-trained models in medical settings and the need for accurate lung disease diagnosis, the current article aimed to improve the classification of pneumothorax and atelectasis using chest X-ray images. Several benchmark pre-trained models were implemented to determine the best-performing model for improving the proposed model.
The major contributions of the current article are:
Modification in the DenseNet201 model to improve identification of atelectasis and pneumothorax using chest X-ray images only.
A channel attention block is proposed in between each dense block except the last block to better capture the salient features of the images for disease classification.
A hybrid pooling layer is added to the proposed model to improve its learning capabilities.
Furthermore, the performance of five established pre-trained models and their respective variants, VGG [19], Xception [20], MobileNet [21], ResNet [22], and DenseNet [23] are evaluated to classify lung collapse diseases, namely atelectasis, pneumothorax, and healthy lung conditions using X-ray images.
This paper is divided into seven sections. "Related Work" discusses the works related to our proposed approach. "Proposed Approach" section illustrates the proposed approach; "Experiment" section describes the experimental details; and "Results" and "Discussion" sections contain the results and discussion. "Conclusion and Future Work" section concludes the paper by summarizing the current research’s findings and seamlessly explores future avenues for improving the proposed method.
Related Work
Deep neural networks have gained significant prominence in medical imaging and are widely used in computer-aided design (CAD) systems. These systems leverage deep learning algorithms to enhance various aspects like image classification [14, 24, 25], object detection [26], image segmentation [24, 27, 28], and image restoration [29, 30], to name a few.
Chan et al. [31] introduced an approach to detect pneumothorax by combining local binary pattern (LBP) and support vector machine (SVM) techniques. They validated the efficacy of their proposed method using a private dataset. They employed gamma correction to enhance the original images’ mean intensity and five-fold cross-validation to prevent overfitting. Additionally, the authors performed lung region segmentation by eliminating background and noise, utilizing the Sobel edge detection technique to identify rib boundaries. The method achieved an accuracy of 82.2% through five-fold cross-validation. Filice et al. [17] addressed the issue of limited and time-consuming manual annotations for pneumothorax in the National Institutes of Health (NIH) Chest X-ray dataset [32]. The authors proposed a crowdsourcing method that employs machine learning annotations to accelerate and improve the annotation process. They leverage the power of existing machine learning models to generate initial annotations, which are then refined through a crowd-based iterative process. The authors showed that the utilization of the Machine Learning Annotation (MLA) technique expedites the annotation process with relatively high sensitivity at the expense of specificity. Wang et al. [9] proposed an attention-based variant of DenseNet to automatically learn and highlight informative features of pneumonia from X-ray images. The authors used a channel attention block named Squeeze and Excitation (SE) in the DenseNet model to highlight pneumonia information and achieved a classification accuracy of 92.8%, which is 2.4% higher than the existing DenseNet model. Xception model, along with a kernel Gaussian filter, was used by Guler and Polat [18] to classify pneumonia from chest X-ray images to achieve an accuracy of 95.73%. The authors compare the performance of different deep transfer learning methods for pneumonia detection from 5856 chest X-ray images.
CheXNeXt was designed by Rajpurkar et al. [33] to classify 14 lung diseases from chest X-ray images. They used the DenseNet121 model with a weighted binary cross-entropy loss function, where the per-class weights were determined according to the frequency of each class within the training set. Souid et al. [25] used the MobileNet V2 model along with global average pooling and a dense layer of 512 neurons to classify 14 lung diseases. The model achieved an accuracy of 90.11% and an average Area Under the Curve (AUC) of 0.801. Chutia et al. [34] conducted a study where they applied two image enhancement algorithms, namely Discrete Wavelet Transform (DWT) and Contrast-Limited Adaptive Histogram Equalization, to enhance lung X-ray images. During the pre-processing phase, the Conv2D layers are utilized to extract the main features of the improved images. These retrieved features are then input into a DenseNet201 model, which enables efficient and reliable classification.
Tian et al. [35] proposed a deep learning-based approach that combines transfer learning and multi-instance learning techniques for improved pneumothorax classification. The proposed approach used two public datasets to learn local features, followed by global features and achieved an accuracy of 94.4%. Albahli et al. [36] presented an approach that utilizes three deep learning algorithms: ResNet152V2, DenseNet121, and InceptionResNetV2. The proposed model is trained and tested on a dataset consisting of chest X-ray images to classify 14 different lung diseases. The study focuses on developing an effective classification system using these deep learning models for accurate disease diagnosis. Rajasenbagam et al. [13] classified pneumonia and healthy X-ray images using a Generative Adversarial Network (GAN)-based algorithm combined with a VGG19 network. The proposed model is trained on 15,900 X-ray images of the chest and obtained 99.34% accuracy with test images.
The study in [37] focused on enhancing the pre-trained models for the multi-label classification of X-ray images. Instead of using global average pooling, the authors employed adaptive dropout. Since X-ray images can exhibit multiple diseases, the classification problem becomes a multi-label challenge. The authors tackled it by dividing it into multiple binary problems, leading to improved outcomes. Bharti et al. [38] proposed a hybrid model named VDSNet using VGG, Spatial Transformer Network (STN), and data augmentation with a standard CNN. A tabular representation of prominent works done in the area of lung disease identification, highlighting the models, datasets, their performance, and limitations, is presented in Table 1. Aswiga and Shanthi [39] proposed a two-level framework that employs multilevel and feature extraction transfer learning for classifying breast tomosynthesis. Using this feature extraction and transfer learning approach, they achieved an AUC of 0.89.
Table 1.
Analysis of existing methods
| Reference | Objective | Dataset | Method | Acc | Limitations |
|---|---|---|---|---|---|
| Wang et al. [9] | Classification | Chest X-ray2017 | Attention-Based DenseNet | 92.8% | Limited comparison against the state-of-the-art pneumonia classification models. |
| Rajasenbagam et al. [13] | Classification | NIH | VGG19 + DCGAN | 99.34% | Only the comparison against the transfer learning technique is provided. |
| Filice et al. [17] | Segmentation | NIH Dataset | Mask R-CNN | 78% | A proper workflow of machine learning annotation is not provided. |
| Souid et al. [25] | Classification | NIH Dataset | MobileNet V2 | 90.11% | Accuracy and sensitivity is less. |
| Chan et al. [31] | Segmentation | Private Dataset | LBP + SVM | 82.2 | A comprehensive comparison with existing medical image segmentation and feature analysis methods is not included. |
| Wang et al. [32] | Classification | NIH Dataset | ResNet50 | 80.9% | Sensitivity and specificity is less. |
| Guler and Polat [18] | Classification | Labeled Optical Coherence Tomography and Chest X-Ray Images for Classification | Xception | 95.73% | The study doesn’t explore the customization of neural network architectures or the incorporation of domain-specific knowledge. |
| Tian et al. [35] | Classification | NIH and SAHZUSM | ResNet | 94.4% | No comparison against the state-of-the-art methods. |
| Albahli et al. [36] | Classification | NIH | ResNet152 V2, DenseNet121, and InceptionResNetV2 | 41.02% | Model accuracy is very less. |
| Zhang et al. [37] | Montgomery County, Shenzhen, and NIH | modified ResNet | 87.7% | Accuracy is not suitable for real-time implementation. | |
| Bharti et al. [38] | Classification | NIH | VDSNet | 73% | Accuracy is not suitable for real-time implementation. |
The authors in [40] devised a framework that utilizes a deep learning algorithm to accurately identify lung cancer by classifying nodules as either benign or malignant. The integration of the Adaptive Tree Seed Optimization (ATSO) technique is used to alter the Convolution Neural Network (CNN) and create an Improved convolution neural network (ICNN) for classification purposes. The methodology demonstrated a peak accuracy of 96.5% and outperformed existing state-of-the-art technologies in terms of performance. Yuan et al. [41] introduced a multi-modal fusion approach using a multi-branch classification network to identify and categorize lung nodules. The data utilized consisted of (i) radiological data pertaining to pulmonary nodules, (ii) feature maps obtained from various depths of the network, each comprising distinct receptive field information, and (iii) multi-modal features. The experimental findings demonstrate that this model is capable of accurately categorizing benign and malignant pulmonary nodules for clinical diagnosis, achieving the highest levels of accuracy (94.89%), sensitivity (94.91%), and F1-score (94.65%), while maintaining the lowest false positive rate (5.55%).
Various studies have utilized machine learning and deep learning techniques to accurately classify and diagnose lung diseases based on chest X-ray images. However, the existing literature does not explicitly focus on classifying diseases that cause a collapsed lung. This highlights a potential research gap and suggests an opportunity for further investigation in this area.
Proposed Approach
The proposed approach consists of (i) a pre-processing phase where the CLAHE image enhancement algorithm is used to improve the visibility of image details and (ii) transfer learning with modified DenseNet to extract features and classify. The core of our approach lies in the modified DenseNet201, where we have introduced several enhancements to the existing models to address the challenges of lung disease classification. We have replaced the second layer of the original DenseNet model (a max pooling layer) with a hybrid pooling layer. This pooling approach empowers our model to extract more detailed information from the initial convolution layer, thereby improving feature extraction and representation. Furthermore, we have integrated a channel attention mechanism into each dense block of DenseNet201, except for the final dense block. This attention mechanism acts as a spotlight, selectively amplifying the information associated with disease areas while preserving the nuances related to healthy classes. This selective attention is crucial for the model’s ability to make accurate classifications. The architecture of our proposed model is visually represented in Fig. 5. In the following sections ("Effect of Image Enhancement", "Hybrid Pooling", "Channel Attention Blocks" and "Modified DenseNet-201"), we discussed the working of each component in detail.
Fig. 5.

Proposed architecture
Effect of Image Enhancement
In our study, we utilized the CLAHE technique to improve the visual quality and noise suppression of X-ray images by constraining the contrast enhancement applied to each pixel [42]. Specifically, we adopted a tile size of and set the clip limit to 3.0. Figure 1 visually represents (a) the original image, (b) the CLAHE-enhanced image, and (c) the delta image (illustrating the differences between the original and CLAHE-enhanced images). The delta image shown in Fig. 1(c) illustrates pixel-wise variations resulting from the CLAHE process, highlighting regions where the two images exhibit differences. The “delta image” serves as a visual map, helping us to understand the impact of CLAHE image enhancement.
Fig. 1.

Image enhancement and difference analysis: a shows the original image, b displays the CLAHE image, and c presents the delta image, illustrating differences between the original and CLAHE-enhanced images
Hybrid Pooling
In our proposed model, the first max pooling layer was replaced with a hybrid pooling layer, enhancing the feature extraction process for the initial dense block. The remaining pooling layers in the model remained unchanged. During the hybrid pooling process, both average pooling and max pooling operations were applied separately to the feature map, and the results of these operations were then added together. This hybrid approach combined the benefits of both pooling methods, capturing different aspects of the features in the image and enhancing the overall representation. The combined output was subjected to batch normalization. Batch normalization normalized the activation within a layer, ensuring stable and consistent training by reducing internal covariance shifts [43, 44].
Channel Attention Blocks
The channel attention module in DenseNet was used to capture and emphasize informative features within different channels of a convolutional neural network. Its purpose was to enhance the representation capabilities of the network by focusing on important channel-wise information while suppressing less relevant features [45, 46].
In the initial step of channel attention, we have applied Global Average Pooling (GAP) to the feature maps obtained from the dense block. The GAP layer reduces the spatial dimensions and aggregates information across the entire feature map, a step known as the “squeeze” operation. In the second step, the pooled features are passed through fully connected layers. The first fully connected layer acts as a bottleneck, reducing the dimensionality of the input data to extract the most relevant features. The size of the first fully connected layer was equal to the number of channels in the GAP, divided by 16. By decreasing the size of the first fully connected layer, the computational complexity and parameter space of the network are reduced. The size of the second fully connected layer equals the number of channels in the GAP. A “sigmoid” activation function is used to obtain attention weights. These weights represent the importance of each channel, reflecting their relevance to the task. This step is also referred to as the “excitation” operation. The second fully connected layer is the “attention” layer, as we multiplied the output feature map obtained from the dense blocks by to get channel-refined features. Figure 2 demonstrates the architecture of the channel attention module. As shown, was the input feature map received from the dense blocks, where H and W represented the height and width, and C was the number of channels. In the next step, global average pooling was applied to , resulting in , where was the dimension of each channel (C). was the first fully connected layer with neurons set to 16, 32, and 112 for the first, second, and third attention blocks, respectively. Similarly, was the second fully connected layer, with neurons set to 256, 512, and 1792 for the first, second, and third attention blocks, respectively.
Fig. 2.

Channel attention module
Modified DenseNet-201
The DenseNet [23] architecture consists of an initial convolution layer followed by a max pooling layer with a stride equal to 2, four dense blocks, and three transition layers. Each dense block consists of a series of and convolutional layers with the same output size, followed by a concatenation operation that combines the outputs of all previous layers. The transition layers are used to reduce the spatial dimensions of the feature maps between dense blocks. Each transition layer performs convolution and average pooling. This helps to control the network’s growth and improves model efficiency. The classification layer consists of a softmax activation function at the network’s end. Figure 3 demonstrates the overall architecture of DenseNet, unlike traditional CNN models, where N connections for N-layers, in DenseNet, there are connections in an N-layer network, which ultimately helps in feature reuse and information propagation. Figure 4 demonstrates the number of connections in N-layers.
Fig. 3.

DenseNet architecture
Fig. 4.

Number of connections in a dense block
The proposed model takes an input image of size (224, 224, 3) and applies a convolution with a stride of 2. Next, max and average pooling operations are executed on the resulting feature map, each utilizing a pool size and a stride of 2. This yields feature maps from max and average pooling, each of size (56, 56, 64). These two feature maps are combined through element-wise addition using the “add” layer. The resulting feature map maintains its original dimensions, staying at (56, 56, 64), and proceeds to undergo batch normalization. The batch normalization step involves adjusting the feature map by subtracting the batch mean and dividing it by the batch standard deviation. This process is pivotal in preserving consistent scale and feature distribution across the network, enhancing learning. The first dense block consists of 6 repetitions batch normalization layer, ReLU activation, a convolution, another batch normalization layer, ReLU activation, and a convolution. The output feature map after has a shape of (56, 56, 256). The channel attention mechanism is applied after , which includes a global average pooling layer, followed by two fully connected layers with “sigmoid” activation. The output of the channel attention block is obtained by multiplying the attention weights with the feature map, resulting in an output shape of (56, 56, 256). Afterwards, the transition layer reduces the number of filters by half through a convolutional layer. The resulting output feature map has a shape of (56, 56, 128). The transition layer further downsamples the feature map by applying average pooling with a pool size of and a stride of 2. This reduces the spatial dimensions to half and produces an output feature map with a shape of (28, 28, 128).
Another dense block with 12 repetitions is applied to the feature map obtained from the . The output shape after the is (28, 28, 512). The channel attention mechanism is applied again to the output feature map of , resulting in an output shape of (28, 28, 512). The second transition layer reduces the number of filters to 128 and downsamples the feature map to (14, 14) . So, the output shape after is (14, 14, 128). The third dense block () consists of 48 repetitions and produces an output of shape (14, 14, 1792) followed by the third attention block, which produces an output of shape (14, 14, 1792). The output of the third transition layer is (7, 7, 896). The dense block 4 () consists of 48 repetitions and produces output shape of (7, 7, 1920). The global average pooling layer is applied to the output produced by (), which reduces the spatial dimensions of the feature map to , resulting in an output shape of (1, 1, 1920). The output layer is a fully connected classification layer with “softmax” activation that produces the final classification probabilities. The output shape is (3), corresponding to the atelectasis, pneumothorax, and healthy images. The summary of the image sizes produced at various stages of the proposed model is presented in Table 2.
Table 2.
Details about the image sizes at various stages of the proposed model
| Layers | Output Size | Details |
|---|---|---|
| Input Layer | ||
| Convolution Layer | conv, stride =2 | |
| Max Pooling | Max pool, stride =2 | |
| Average Pooling | Avg pool, stride =2 | |
| Hybrid Pooling | [ Both max & avg pooling] | |
| Dense Block 1 | [ conv, conv] | |
| Attention Block 1 | GAP, Dense layers | |
| Transition Layer 1 | conv | |
| Avg pool, stride =2 | ||
| Dense Block 2 | [ conv, conv] | |
| Attention Block 2 | GAP, Dense layers | |
| Transition Layer 2 | conv | |
| Avg pool, stride =2 | ||
| Dense Block 3 | [ conv, conv] | |
| Attention Block 3 | GAP, Dense layers | |
| Transition Layer 3 | conv | |
| Avg pool, stride =2 | ||
| Dense Block 4 | [ conv, conv] | |
| Global Average pooling | global average pooling |
Experiment
This section describes the dataset, implementation details, and evaluation metrics used in the proposed approach to classify pneumothorax, atelectasis, and healthy X-ray images.
Dataset Description
The NIH chest X-ray dataset is a large publicly available dataset of chest X-ray images [32]. The dataset consists of 112,120 X-ray images, out of which 9409 images were considered for analysis as shown in bold in Table 3. It includes 4215 atelectasis images, 3000 healthy images, and 2194 pneumothorax images.
Table 3.
Dataset details
| Class | No. of images in each class |
|---|---|
| Atelectasis | 4215 |
| Pneumothorax | 3000 |
| Healthy | 2194 |
| Total | 9409 |
The total dataset is split into 80% training and 20% testing ratios. Later, during the training phase, 20% of the data is considered for validation from the training set. Table 3 shows the count of images used in the evaluation process. Figure 6 shows sample images for each class, where “a” represents healthy images, “b” represents pneumothorax images, and “c” represents atelectasis images.
Fig. 6.

Sample X-rays used to train and test the proposed model for detecting lung diseases: a Healthy, b Pneumothorax, and c Atelectasis
Experimental Setup
All the experiments are performed on Python 3.7.12 using Keras, Numpy, Pandas and Tensorflow 2.0 libraries. The models trained using categorical cross-entropy as a loss function, an Adam optimizer with a learning rate of 0.0001 for 100 epochs; each epoch contains 187 steps, and each step processes 16 images. The hyperparameters used in the proposed model are provided in Table 4.
Table 4.
The hyperparameters used in the proposed approach
| Hyperparameters | Values |
|---|---|
| Optimizer | Adam |
| Loss function | Categorical cross-entropy |
| Learning rate | 0.0001 |
| Epoch | 100 |
| Batch size | 32 |
| Step per epoch | 187 |
Evaluation Metric
In this study, lung X-ray images are classified into three classes, and the performance of the proposed model is assessed using accuracy, precision, recall, F1-score, and AUC values.
The aforementioned matrices are calculated using True Positive , False Positive , True Negative , and False Negative instances. refers to the number of correctly predicted positive instances, refers to the number of negative instances predicted as positive, refers to the number of negative instances predicted as negative, and refers to the number of positive instances predicted as negative. The following equations (1 to 5) denote the precision, recall, F1-score, and AUC.
| 1 |
| 2 |
| 3 |
| 4 |
| 5 |
Results
Several experiments were conducted to assess the performance of the proposed model for disease classification in lung X-ray images. The results obtained are discussed in this section.
Classification Results of the Proposed Model
To better understand the model behavior, we created two scenarios: (i) a binary classification between healthy vs infected with any lung disease, and (ii) a Multi-class classification was performed for atelectasis, pneumothorax, and healthy.
Healthy vs Infected Diseases
For binary classification, three experiments were conducted. Table 5 shows the performance of each classification: pneumothorax vs healthy, atelectasis vs healthy and infected vs healthy. Our proposed model is quite accurate while classifying pneumothorax vs. healthy with an average precision of 98%, an average recall of 95%, an average F1-score of 96%, an average AUC value of 0.97, and an accuracy of 98.25%, as shown in bold in Table 5, compared to atelectasis vs. healthy having an accuracy of 95.21% only and infected vs. healthy having an accuracy of 93.21 only.
Table 5.
Performance of binary classifications performed on the proposed model
| Classification | Pathology | Accuracy | Precision | Recall | F1-Score | AUC |
|---|---|---|---|---|---|---|
| Pnemothourax | 99% | 96% | 97% | 0.98 | ||
| Pnemothourax vs Healthy | Healthy | 98.25% | 96% | 94% | 95% | 0.95 |
| Average | 98% | 95% | 96% | 0.97 | ||
| Atelectasis | 96% | 97% | 96% | 0.97 | ||
| Atelectasis vs Healthy | Healthy | 95.21% | 94% | 89% | 91% | 0.97 |
| Average | 95% | 93% | 94% | 0.97 | ||
| Infected | 98% | 96% | 97% | 0.94 | ||
| Infected vs Healthy | Healthy | 93.21% | 85% | 87% | 86% | 0.94 |
| Average | 92% | 92% | 92% | 0.94 |
Classification of Atelectasis, Pnemouthorax, and Healthy Classes
In this subsection, the result of multi-class classification is discussed. Table 6 depicts the performance of our proposed model on multi-class classification. Among all the classes, our model classified pneumothorax more accurately than other classes, with precision, recall, and an F1-Score of 98%, 98% and 97%. Atelectasis is identified with second best performance measure, having precision, recall, and an F1-Score of 98%, 96% and 95%, and the healthy class is identified as having the least performance with precision, recall, and an F1-Score of 95%, 93%, and 96%.
Table 6.
Performance of multi-class classifications performed on the proposed model
| Pathology | Accuracy | Precision | Recall | F1-Score | AUC |
|---|---|---|---|---|---|
| Atelectasis | 98% () | 96% () | 95% () | 0.98 () | |
| Pneumothorax | 95.34% () | 98% () | 98% () | 97% () | 0.99 () |
| Healthy | 95% () | 93% () | 96% () | 0.99 () | |
| Average | 97% () | 96% () | 96% () | 0.99 () |
The proposed model shows a better accuracy of 98.25% on the binary classification of pneumothorax vs. healthy. However, the accuracy declines by 2.91% on multi-class classification. AUC (Area Under the Curve) is also used to evaluate the performance of the proposed model. Figures 7 and 8 illustrate the AUC and confusion matrix of the proposed model, respectively. The AUC of pneumothorax and healthy is 99%, and for atelectasis, the AUC is 98%. The values (\pm x) in Table 6 show the variations of the results across various runs.
Fig. 7.
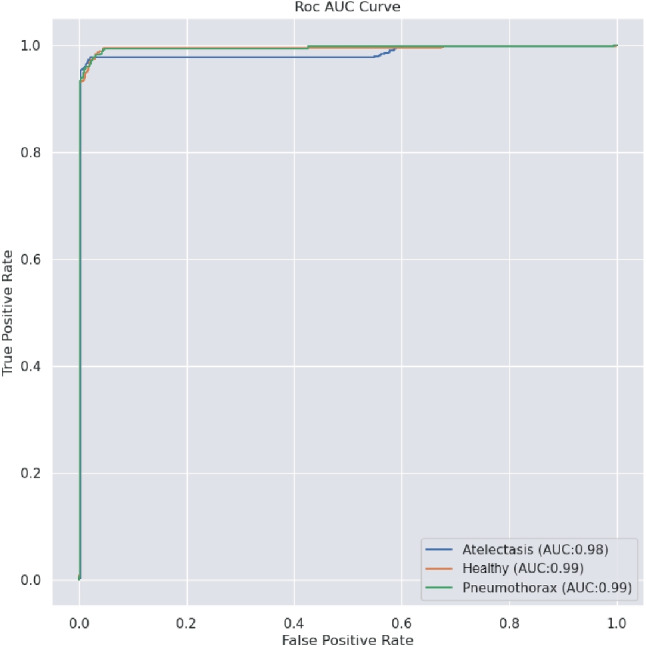
ROC curves for the proposed model over 100 epochs
Fig. 8.

Confusion Matrix of the proposed model
Comparison with Other Pre-trained Models
Twelve existing pre-trained models: VGG16, VGG19, InceptionV3, Xception, ResNet50, ResNet152, ResNet50V2, ResNet152V2, MobileNetV2, DenseNet121, DenseNet169, and DenseNet201, are trained with the current dataset and validated. The performance of each benchmark model is depicted in Table 7. The addition of channel attention (CA) blocks to the DenseNet201 model increases the precision by 6%, as shown in the second last row of Table 7. The use of CLAHE to improve the contrast of the images boosts the precision by 2%, as shown in the bold in the last row of Table 7.
Table 7.
The classification performance of the proposed model with CLAHE enhanced images compared to other CNN models
| CNN Models | Precision | Recall | F1-score | Trainable Parameters |
|---|---|---|---|---|
| VGG16 | 40% | 53% | 48% | 14,716,227 |
| VGG19 | 42% | 53% | 47% | 20,025,923 |
| InceptionV3 | 76% | 75% | 75% | 21,808,931 |
| Xception | 79% | 63% | 70% | 20,867,627 |
| ResNet50 | 69% | 68% | 68% | 23,593,859 |
| ResNet152 | 55% | 52% | 53% | 58,377,091 |
| ResNet50V2 | 64% | 65% | 64% | 23,570,947 |
| ResNet152V2 | 58% | 55% | 56% | 58,337,795 |
| MobileNetV2 | 61% | 62% | 61% | 2,261,827 |
| DenseNet121 | 76% | 73% | 74% | 7,040,579 |
| DenseNet169 | 79% | 69% | 74% | 12,647,875 |
| DenseNet201 | 89% | 87% | 88% | 18,327,747 |
| Proposed Model with raw images | 95% | 96% | 95% | 18,561,541 |
| Proposed Model with CLAHE enhanced images | 97% | 96% | 96% | 18,561,541 |
Table 8 briefly compares the performance of the state-of-the-art and our proposed approach based on the AUC. All the existing works are multi-class classifications of 8 to 14 lung diseases, including atelectasis and pneumothorax and excluding the healthy class. The AUC values obtained by our model are shown in bold in the last column of Table 8.
Table 8.
Comparisons of AUC values of existing works and proposed approach
| Pathology | Wang et al. [32] | Yao et al. [47] | Rajpurkar et al. [48] | Souid et al. [25] | Albahli et al. [49] | Guan et al. [50] | Proposed Approach |
|---|---|---|---|---|---|---|---|
| Atelectasis | 0.71 | 0.77 | 0.86 | 0.80 | 0.74 | 0.85 | 0.98 |
| Pneumothorax | 0.80 | 0.84 | 0.94 | 0.87 | 0.89 | 0.92 | 0.99 |
| Healthy | — | — | — | — | — | — | 0.99 |
| Average | 0.76 | 0.81 | 0.90 | 0.84 | 0.82 | 0.89 | 0.99 |
Compression with Different Sampling Methods
We comprehensively evaluated our model using various sampling techniques, including stratified, random, and holdout sampling. The goal was to assess the model’s performance under different conditions. We also experimented with various batch sizes and learning rates to understand how they impact the model’s training and results. This extensive evaluation allowed us to gain valuable insights into the model’s robustness and adaptability across diverse data subsets and learning rate settings, providing a well-rounded perspective on its capabilities and limitations. Table 9 presents a thorough analysis of various sampling techniques in combination with different batch sizes (16, 32, 64) and learning rates (0.001, 0.0001, and 0.0001). As illustrated in Table 9, various sampling methods exhibit distinct performance characteristics. Among them, holdout sampling stands out as the top performer, achieving remarkable results with a batch size of 16 and a learning rate of 0.0001, boasting an accuracy of 96%, precision of 98%, recall of 96%, and F1-score of 95%, as shown in bold in the twentieth row of Table 9. Stratified sampling also demonstrates strong performance, particularly in accuracy, when using a batch size of 16 and a learning rate of 0.001, reaching an accuracy of 97%, precision of 97%, recall of 95%, and an F1-score of 94%, as shown in bold in the first row of Table 9. On the other hand, random sampling excels in accuracy with a batch size of 64 and a learning rate of 0.001, achieving an accuracy of 90%, precision of 92%, recall of 80%, and an F1-score of 72%.
Table 9.
Comparisons of the proposed model at different batch sizes and learning rates
| Sampling Technique | Batch Size | Learning Rate | Accuracy | Precision | Recall | F1-score |
|---|---|---|---|---|---|---|
| 0.001 | 97% | 97% | 95% | 94% | ||
| 16 | 0.0001 | 95% | 94% | 97% | 94% | |
| 0.00001 | 95% | 92% | 95% | 92% | ||
| 0.001 | 97% | 93% | 97% | 96% | ||
| Stratified | 32 | 0.0001 | 96% | 88% | 96% | 90% |
| Sampling | 0.00001 | 95% | 92% | 95% | 94% | |
| 0.001 | 97% | 83% | 97% | 90% | ||
| 64 | 0.0001 | 97% | 83% | 97% | 90% | |
| 0.00001 | 94% | 82% | 94% | 85% | ||
| 0.001 | 89% | 64% | 89% | 75% | ||
| 16 | 0.0001 | 89% | 64% | 89% | 75% | |
| 0.00001 | 89% | 64% | 89% | 75% | ||
| 0.001 | 88% | 74% | 88% | 76% | ||
| Random | 32 | 0.0001 | 89% | 64% | 89% | 75% |
| Sampling | 0.00001 | 89% | 64% | 89% | 75% | |
| 0.001 | 90% | 92% | 80% | 72% | ||
| 64 | 0.0001 | 85% | 84% | 85% | 77% | |
| 0.00001 | 89% | 63% | 87% | 70% | ||
| 0.001 | 94% | 95% | 94% | 93% | ||
| 16 | 0.0001 | 96% | 98% | 96% | 95% | |
| 0.00001 | 88% | 68% | 88% | 83% | ||
| 0.001 | 89% | 88% | 89% | 87% | ||
| Holdout | 32 | 0.0001 | 89% | 88% | 86% | 87% |
| Sampling | 0.00001 | 89% | 88% | 89% | 87% | |
| 0.001 | 95% | 84% | 95% | 80% | ||
| 64 | 0.0001 | 89% | 83% | 84% | 85% | |
| 0.00001 | 88% | 81% | 88% | 85% |
Model Interpretation and Statistical Significance Test
To interpret the predictions of the model, we generate heatmaps utilizing class activation mappings (CAMs), which visually depict the most significant regions within the image affected by the diseases [51]. To generate the CAMs, we input an image into the fully trained network and extract the feature maps that are produced by the last convolutional layer. Let the be the last convolutional layer, and the feature map and be the weights of of feature map leading to pathology p.
Then CAM will generate , which contains the most salient features used in classifying the image having pathology p. Equation 6 describes the working of CAMs:
| 6 |
Figure 9 shows the heat map generated by the proposed model in the classification task. As shown, the model identifies the most important features used for identifying pathology p. Along with the heat map generation, a probability prediction on random images is made to identify how accurately our proposed model predicts p.
Fig. 9.

Heat maps generated by the proposed model
We performed hypothesis testing and formulated the following hypotheses to ensure our results are statistically consistent across multiple runs. These hypotheses are pivotal in our statistical analysis to establish a meaningful conclusion from the results.
Null hypothesis (): The test results differ significantly among different runs.
Alternative hypothesis (): The test results do not differ significantly across different runs.
Our results are statistically significant; we performed a t-test at a 5% significance level (95% confidence level) and ran the experiments ten times to ensure robustness and eliminate potential training-related ambiguity. The calculated t-statistics for accuracy, precision, recall, and F1-score are as follows: 1.264, 0.2941, 1.263, and 0.902, respectively. All these values fall below the critical t-value of 1.833 at a significance level () of 0.05. Consequently, we reject the null hypothesis. This statistical perspective indicates no significant differences in the results across the various experimental runs.
Discussion
One of the significant findings of the current research is a modified DenseNet model for the identification of diseases having collapsed lungs. The DenseNet201 model is modified by using hybrid pooling and incorporating attention blocks within each dense block except the last one. DenseNet201 is considered a base model after comparing its performance with other existing CNN models. The performance of each CNN model is discussed in Table 7. The addition of attention blocks within each dense block aimed to improve the model’s ability to focus on informative features and suppress irrelevant ones. Attention mechanisms have shown promising results in various computer vision tasks by allowing the model to selectively attend to important regions [9, 52]. By integrating attention blocks, the modified DenseNet201 exhibits enhanced discriminative power and better captures subtle patterns in the images. Figure 10 displays the visual analysis of the feature maps produced by the attention block. The other finding is the inclusion of combined features from both max pooling and average pooling on the second layer of the DenseNet model. This approach empowers the model to capture fine-grained details, leading to an increase in accuracy.
Fig. 10.

Heat maps generated by the proposed model at different channel attention blocks
The third finding is that the use of limited adaptive histogram equalization to enhance the input images allows the modified DenseNet201 to receive better visibility of image leading to improved performance. CLAHE improves precision by 2% and F1-score by 1%.
Comparing classification methods, our model performs better on binary class classification with a 98.25% accuracy for pneumothorax vs healthy, in contrast to the accuracy of 95.34% on multi-class classification. Choosing a proper batch size also impacts the efficiency of the model’s performance. After experimenting with various batch sizes, we observed that using a batch size of 16 yielded improved results for the proposed model.
In our proposed model, we also explored various activation functions, including Rectified Linear Unit (ReLU), Parametric Rectified Linear Unit (PReLU), Leaky ReLU, and Exponential Linear Unit (ELU), with their respective performances depicted in Fig. 11. As depicted, ReLU and PReLU exhibit nearly identical precision and F1-scores. However, PReLU outperforms all other functions in terms of accuracy, while ReLU has the highest recall among them. ELU and Leaky ReLU did not yield satisfactory results. Additionally, we investigated different optimizers, namely Adam, SGD, and RMSprop, while keeping the other hyperparameters constant, as depicted in Table 4. When compared to RMSprop and SGD, the result that Adam optimizer obtained is better, as shown in bold in Table 10. RMSprop achieved an accuracy rate of 94.20% and demonstrated a strong recall of 95%, showcasing its effectiveness in identifying relevant data. In contrast, SGD attained a lower accuracy rate of 85.01%. However, Adam outperformed all the optimizers with an impressive accuracy rate of 95.34%, with a precision of 97% and a recall of 96%. These results highlight Adam as the standout performer among the optimizers in terms of both accuracy and precision. Furthermore, the integration of attention blocks within different dense blocks is investigated and discovered that incorporating attention after the first, second, and third dense blocks results in improved performance. The performance of the model on various batch sizes and different attention mechanisms is presented in Table 11, where the best results are shown in bold.
Fig. 11.

The evaluation of various activation functions in our proposed model’s performance
Table 10.
Effect of different optimizer on the proposed model
| Optimizer | Accuracy | Precision | Recall | F1-score |
|---|---|---|---|---|
| RMSprop | 94.20% | 88% | 95% | 96% |
| SGD | 85.01% | 82% | 86% | 85% |
| Adam | 95.34% | 97% | 96% | 96% |
Table 11.
The performance of DenseNet201 with incorporated channel attention on different dense blocks for classification
| CNN Models | Batch Size | Precision | Recall | F1-score |
|---|---|---|---|---|
| DenseNet201 | 16 | 89% | 87% | 88% |
| DenseNet201 | 32 | 87% | 84% | 85% |
| DenseNet201 | 64 | 82% | 83% | 82% |
| DenseNet201+ CA + SA | 92 | 88% | 90% | 67% |
| DenseNet201+ CA on Block | 16 | 91% | 88% | 89% |
| DenseNet201+ CA on Block | 16 | 91% | 88% | 89% |
| DenseNet201+ attention on Block and block | 16 | 94% | 93% | 93% |
| Proposed model without image enhancement | 16 | 95% | 96% | 95% |
| Proposed model with CLAHE-enhanced image | 16 | 97% | 96% | 96% |
The modifications made to the DenseNet201 model by incorporating hybrid pooling, attention blocks within each dense block, and enhancing the images using CLAHE resulted in improved classification performance. The proposed model highlights the importance of attention mechanisms and pre-processing techniques in enhancing the discriminative power and feature representation of deep learning models. The choice of DenseNet201 as the base model is justified through a comprehensive comparison with other CNN architectures. The proposed work can contribute to the growing body of research in deep learning and provide valuable insights for improving the performance of CNN models in image classification tasks.
The proposed model is limited in terms of a large number of parameters. The proposed model has over 18 million parameters, making it a heavy-weight model. Another limitation is that the proposed model has to be evaluated on similar datasets. The proposed model has yet to be evaluated for other diseases, including pneumonia, mass, and nodules. Also, the model is not validated using other datasets.
Conclusion and Future Work
In this paper, we propose a modified DenseNet201 architecture that integrates attention mechanisms and hybrid pooling to promote classification performance. The input X-ray images are first pre-processed to remove noises and enhance the image visually using the CLAHE image enhancement algorithm. We have added a hybrid pooling layer by replacing the conventional max pooling in the DenseNet model. We have also generated a heatmap of the images to highlight the pixels helping in classifying an image into a specific class. We also did extensive experiments with different batch sizes, optimizers, and activation functions to fine-tune our model’s performance and ensure its optimal configuration for precise disease identification. We also used various sampling techniques to create our train and test samples and made various runs of the system to find that the system is yielding statistically similar performances across various runs.
The current research can be extended by using other explainability models such as saliency maps, feature visualization, and Grad-CAM. In future, the model can be used for other diseases with X-ray as an imaging technique. The same model may also be trained and tested with other imaging techniques, such as CT scans and MRIs; it would be interesting to see the performance of the proposed model in other domain datasets encompassing a variety of medical conditions and non-medical settings also.
Author Contributions
All the authors contributed equally.
Data Availability
The dataset for the current study is available at www.kaggle.com/nih-chest-xrays/data.
Declarations
Conflict of Interest
The authors declare no competing interests.
Footnotes
Publisher's Note
Springer Nature remains neutral with regard to jurisdictional claims in published maps and institutional affiliations.
References
- 1.Bhandary, A., Prabhu, G.A., Rajinikanth, V., Thanaraj, K.P., Satapathy, S.C., Robbins, D.E., Shasky, C., Zhang, Y.-D., Tavares, J.M.R., Raja, N.S.M.: Deep-learning framework to detect lung abnormality - A study with chest X-ray and lung CT scan images. Pattern Recognition Letters 129, 271–278 (2020) [Google Scholar]
- 2.Zheng, M., Marron, R.M., Sehgal, S.: Hard Metal Lung Disease and Other Rare Occupational Lung Diseases, pp. 101–109. CRC Press, Boca Raton (2023)
- 3.Tarlo, S.M.: Occupational lung diseases. Canadian Journal of Respiratory, Critical Care, and Sleep Medicine 4(sup1), 6–8 (2020) [Google Scholar]
- 4.Peroni, D., Boner, A.: Atelectasis: mechanisms, diagnosis and management. Paediatric Respiratory Reviews 1(3), 274–278 (2000) [DOI] [PubMed] [Google Scholar]
- 5.Posner, K., Needleman, J.P.: Pneumothorax. Pediatrics in Review 29(2), 69–70 (2008) [DOI] [PubMed] [Google Scholar]
- 6.Brenner, D.R., McLaughlin, J.R., Hung, R.J.: Previous Lung Diseases and Lung Cancer Risk: A Systematic Review and Meta-Analysis. PloS one 6(3), 17479 (2011) [DOI] [PMC free article] [PubMed] [Google Scholar]
- 7.Lavine, M.: The Early Clinical X-ray in the United States: Patient Experiences and Public Perceptions. Journal of the History of Medicine and Allied Sciences 67(4), 587–625 (2012) [DOI] [PubMed] [Google Scholar]
- 8.Ramgopal, S., Lorenz, D., Navanandan, N., Cotter, J.M., Shah, S.S., Ruddy, R.M., Ambroggio, L., Florin, T.A.: Validation of Prediction Models for Pneumonia Among Children in the Emergency Department. Pediatrics 150(1) (2022) [DOI] [PMC free article] [PubMed]
- 9.Wang, K., Jiang, P., Meng, J., Jiang, X.: Attention-Based DenseNet for Pneumonia Classification. IRBM 43(5), 479–485 (2022) [Google Scholar]
- 10.Islam, M.R., Nahiduzzaman, M.: Complex features extraction with deep learning model for the detection of COVID19 from CT scan images using ensemble based machine learning approach. Expert Systems with Applications 195, 116554 (2022) [DOI] [PMC free article] [PubMed] [Google Scholar]
- 11.Mnassri, B., Echtioui, A., Kallel, F., Ben Hamida, A., Dammak, M., Mhiri, C., Ben Mahfoudh, K.: New contrast enhancement method for multiple sclerosis lesion detection. Journal of Digital Imaging 36(2), 468–485 (2023) [DOI] [PMC free article] [PubMed] [Google Scholar]
- 12.Chhabra, M., Kumar, R.: An Advanced VGG16 Architecture-Based Deep Learning Model to Detect Pneumonia from Medical Images. In: Emergent Converging Technologies and Biomedical Systems: Select Proceedings of ETBS 2021, pp. 457–471 (2022)
- 13.Rajasenbagam, T., Jeyanthi, S., Pandian, J.A.: Detection of pneumonia infection in lungs from chest X-ray images using deep convolutional neural network and content-based image retrieval techniques. Journal of Ambient Intelligence and Humanized Computing, 1–8 (2021) [DOI] [PMC free article] [PubMed]
- 14.Gaur, P., Malaviya, V., Gupta, A., Bhatia, G., Pachori, R.B., Sharma, D.: COVID-19 disease identification from chest CT images using empirical wavelet transformation and transfer learning. Biomedical Signal Processing and Control 71, 103076 (2022) [DOI] [PMC free article] [PubMed] [Google Scholar]
- 15.Ferreira Junior, J.R., Cardona Cardenas, D.A., Moreno, R.A., de Sá Rebelo, M.d.F., Krieger, J.E., Gutierrez, M.A.: Novel Chest Radiographic Biomarkers for COVID-19 Using Radiomic Features Associated with Diagnostics and Outcomes. Journal of Digital Imaging 34, 297–307 (2021) [DOI] [PMC free article] [PubMed]
- 16.Upasana, C., Tewari, A.S., Singh, J.P.: An attention-based Pneumothorax Classification using Modified Xception Model. Procedia Computer Science 218, 74–82 (2023) [Google Scholar]
- 17.Filice, R.W., Stein, A., Wu, C.C., Arteaga, V.A., Borstelmann, S., Gaddikeri, R., Galperin-Aizenberg, M., Gill, R.R., Godoy, M.C., Hobbs, S.B., et al: Crowdsourcing pneumothorax annotations using machine learning annotations on the NIH chest X-ray dataset. Journal of Digital Imaging 33, 490–496 (2020) [DOI] [PMC free article] [PubMed] [Google Scholar]
- 18.Güler, O., Polat, K.: Classification performance of Deep Transfer Learning Methods for Pneumonia Detection from Chest X-Ray Images. Journal of Artificial Intelligence and Systems 4(1), 107–126 (2022) [Google Scholar]
- 19.Simonyan, K., Zisserman, A.: Very Deep Convolutional Networks for Large-Scale Image Recognition. arXiv preprint arXiv:1409.1556 (2014)
- 20.Chollet, F.: Xception: Deep learning with depthwise separable convolutions. In: Proceedings of the IEEE Conference on Computer Vision and Pattern Recognition, pp. 1251–1258 (2017)
- 21.Sandler, M., Howard, A., Zhu, M., Zhmoginov, A., Chen, L.-C.: MobileNetV2: Inverted Residuals and Linear Bottlenecks. In: Proceedings of the IEEE Conference on Computer Vision and Pattern Recognition, pp. 4510–4520 (2018)
- 22.He, K., Zhang, X., Ren, S., Sun, J.: Deep Residual Learning for Image Recognition. In: Proceedings of the IEEE Conference on Computer Vision and Pattern Recognition, pp. 770–778 (2016)
- 23.Huang, G., Liu, Z., Van Der Maaten, L., Weinberger, K.Q.: Densely Connected Convolutional Networks. In: Proceedings of the IEEE Conference on Computer Vision and Pattern Recognition, pp. 4700–4708 (2017)
- 24.Huemann, Z., Hu, J., Bradshaw, T.: ConTEXTual Net: A Multimodal Vision-Language Model for Segmentation of Pneumothorax. arXiv preprint arXiv:2303.01615 (2023) [DOI] [PMC free article] [PubMed]
- 25.Souid, A., Sakli, N., Sakli, H.: Classification and Predictions of Lung Diseases from Chest X-rays Using MobileNet V2. Applied Sciences 11(6), 2751 (2021) [Google Scholar]
- 26.Alaba, S.Y., Ball, J.E.: Deep Learning-Based Image 3D Object Detection for Autonomous Driving. IEEE Sensors Journal (2023) [DOI] [PMC free article] [PubMed]
- 27.Rahman, T., Khandakar, A., Kadir, M.A., Islam, K.R., Islam, K.F., Mazhar, R., Hamid, T., Islam, M.T., Kashem, S., Mahbub, Z.B., et al: Reliable Tuberculosis Detection Using Chest X-ray With Deep Learning, Segmentation and Visualization. IEEE Access 8, 191586–191601 (2020) [Google Scholar]
- 28.Cho, Y., Kim, J.S., Lim, T.H., Lee, I., Choi, J.: Detection of the location of pneumothorax in chest X-rays using small artificial neural networks and a simple training process. Scientific Reports 11(1), 13054 (2021) [DOI] [PMC free article] [PubMed] [Google Scholar]
- 29.De Vos, B.D., Berendsen, F.F., Viergever, M.A., Sokooti, H., Staring, M., Išgum, I.: A deep learning framework for unsupervised affine and deformable image registration. Medical Image Analysis 52, 128–143 (2019) [DOI] [PubMed] [Google Scholar]
- 30.Sharma, P., Bisht, I., Sur, A.: Wavelength-Based Attributed Deep Neural Network for Underwater Image Restoration. ACM Transactions on Multimedia Computing, Communications and Applications 19(1), 1–23 (2023) [Google Scholar]
- 31.Chan, Y.-H., Zeng, Y.-Z., Wu, H.-C., Wu, M.-C., Sun, H.-M.: Effective Pneumothorax Detection for Chest X-ray Images Using Local Binary Pattern and Support Vector machine. Journal of Healthcare Engineering 2018 (2018) [DOI] [PMC free article] [PubMed]
- 32.Wang, X., Peng, Y., Lu, L., Lu, Z., Bagheri, M., Summers, R.M.: ChestX-ray8: Hospital-Scale Chest X-ray Database and Benchmarks on Weakly-Supervised Classification and Localization of Common Thorax Diseases. In: Proceedings of the IEEE Conference on Computer Vision and Pattern Recognition, pp. 2097–2106 (2017)
- 33.Rajpurkar, P., Irvin, J., Ball, R.L., Zhu, K., Yang, B., Mehta, H., Duan, T., Ding, D., Bagul, A., Langlotz, C.P., et al: Deep learning for chest radiograph diagnosis: A retrospective comparison of the CheXNeXt algorithm to practicing radiologists. PLoS medicine 15(11), 1002686 (2018) [DOI] [PMC free article] [PubMed]
- 34.Chutia, U., Tewari, A.S., Singh, J.P.: Collapsed lung disease classification by coupling denoising algorithms and deep learning techniques. Network Modeling Analysis in Health Informatics and Bioinformatics 13(1), 1 (2023) [Google Scholar]
- 35.Tian, Y., Wang, J., Yang, W., Wang, J., Qian, D.: Deep multi-instance transfer learning for Pneumothorax classification in chest X-ray images. Medical Physics 49(1), 231–243 (2022) [DOI] [PubMed] [Google Scholar]
- 36.Albahli, S., Rauf, H.T., Algosaibi, A., Balas, V.E.: AI-driven deep CNN approach for multi-label pathology classification using chest X-Rays. PeerJ Computer Science 7, 495 (2021) [DOI] [PMC free article] [PubMed] [Google Scholar]
- 37.Zhang, Q., Bai, C., Liu, Z., Yang, L.T., Yu, H., Zhao, J., Yuan, H.: A GPU-based residual network for medical image classification in smart medicine. Information Sciences 536, 91–100 (2020) [Google Scholar]
- 38.Bharati, S., Podder, P., Mondal, M.R.H.: Hybrid deep learning for detecting lung diseases from X-ray images. Informatics in Medicine Unlocked 20, 100391 (2020) [DOI] [PMC free article] [PubMed] [Google Scholar]
- 39.Aswiga, R., Shanthi, A.: Augmenting transfer learning with feature extraction techniques for limited breast imaging datasets. Journal of Digital Imaging 34(3), 618–629 (2021) [DOI] [PMC free article] [PubMed] [Google Scholar]
- 40.Dhasny, L.M., Prakash, M.: An improved convolution neural network and modified regularized K-Means-Based automatic lung nodule detection and classification. Journal of Digital Imaging 36, 1431–1446 (2023) [DOI] [PMC free article] [PubMed] [Google Scholar]
- 41.Yuan, H., Wu, Y., Dai, M.: Multi-modal feature fusion-based multi-branch classification network for pulmonary nodule malignancy suspiciousness diagnosis. Journal of Digital Imaging 36(2), 617–626 (2023) [DOI] [PMC free article] [PubMed] [Google Scholar]
- 42.Reza, A.M.: Realization of the contrast limited adaptive histogram equalization (CLAHE) for real-time image enhancement. Journal of VLSI Signal Processing Systems For Signal, Image and Video Technology 38, 35–44 (2004) [Google Scholar]
- 43.Tong, Z., Tanaka, G.: Hybrid pooling for enhancement of generalization ability in deep convolutional neural networks. Neurocomputing 333, 76–85 (2019) [Google Scholar]
- 44.Ru, L., Du, B., Zhan, Y., Wu, C.: Weakly-supervised semantic segmentation with visual words learning and hybrid pooling. International Journal of Computer Vision 130(4), 1127–1144 (2022) [Google Scholar]
- 45.Woo, S., Park, J., Lee, J.-Y., Kweon, I.S.: CBAM: Convolutional block attention module. In: Proceedings of the European Conference on Computer Vision (ECCV), pp. 3–19 (2018)
- 46.Bastidas, A.A., Tang, H.: Channel attention networks. In: Proceedings of the IEEE/CVF Conference on Computer Vision and Pattern Recognition Workshops, pp. 0–0 (2019)
- 47.Yao, L., Poblenz, E., Dagunts, D., Covington, B., Bernard, D., Lyman, K.: Learning to diagnose from scratch by exploiting dependencies among labels. arXiv preprint arXiv:1710.10501 (2017)
- 48.Rajpurkar, P., Irvin, J., Zhu, K., Yang, B., Mehta, H., Duan, T., Ding, D., Bagul, A., Langlotz, C., Shpanskaya, K., et al.: CheXNet: Radiologist-Level Pneumonia Detection on Chest X-rays with Deep Learning. arXiv preprint arXiv:1711.05225 (2017)
- 49.Szegedy, C., Vanhoucke, V., Ioffe, S., Shlens, J., Wojna, Z.: Rethinking the Inception Architecture for Computer Vision. In: Proceedings of the IEEE Conference on Computer Vision and Pattern Recognition, pp. 2818–2826 (2016)
- 50.Guan, Q., Huang, Y., Zhong, Z., Zheng, Z., Zheng, L., Yang, Y.: Diagnose like a Radiologist: Attention Guided Convolutional Neural Network for Thorax Disease Classification. arXiv preprint arXiv:1801.09927 (2018)
- 51.Zhou, B., Khosla, A., Lapedriza, A., Oliva, A., Torralba, A.: Learning deep features for discriminative localization. In: Proceedings of the IEEE Conference on Computer Vision and Pattern Recognition, pp. 2921–2929 (2016)
- 52.Farag, M.M., Fouad, M., Abdel-Hamid, A.T.: Automatic Severity Classification of Diabetic Retinopathy Based on DenseNet and Convolutional Block Attention Module. IEEE Access 10, 38299–38308 (2022) [Google Scholar]
Associated Data
This section collects any data citations, data availability statements, or supplementary materials included in this article.
Data Availability Statement
The dataset for the current study is available at www.kaggle.com/nih-chest-xrays/data.