

Abstract
Biomass pyrolysis greatly impacts climates, ecosystem dynamics, air quality, human health, global carbon and nitrogen cycle. The emissions of nitrogen-containing compounds from biomass pyrolysis highly depend on the protein nitrogen existing in biomass. However, the quantitative kinetic information, including the rate constant and apparent activation energy of individual amino acid induced by pyrolysis are still yet to be well-constrained. Towards this, we performed a series of controlled pyrolysis experiments where 18 equimolar free amino acids standard mixtures were pyrolyzed under ambient oxygen at temperatures between 160 and 240 °C. Additionally, straw samples were pyrolyzed to understand the mechanism of combined amino acids in protein liberation to free amino acids during pyrolytic processes. Our observations indicated that an increase in heating duration and temperature promote the degradation of free amino acids. Further, the heating stability of the 18 examined amino acids varied, which could be related to the length and functional groups present in their side chains. Our result shows that the degradation processes of all examined 18 amino acids followed irreversible first-order reaction kinetics in air within the given temperature range, with their activation energy ranging from 88.5 to 137.44 kJ mol−1. The distinct distribution patterns of both combined and free amino acids in aerosol samples from straw pyrolytic processes were obtained. The kinetic information of amino acids garnered herein helps to elucidate the transformation mechanisms of nitrogenous compounds during biomass burning.
Keywords: Degradation kinetics, Amino acids, Biomass pyrolysis, Distribution characteristics
Subject terms: Biogeochemistry, Environmental sciences
Introduction
Annually, approximately 400–500 million hectares (Mha) of the Earth’s surface are affected by vegetation fires1,2. Furthermore, vegetation fires significantly influence regional and global climates3,4, the global ecosystem dynamics5,6, air quality and human health7–9, carbon and nitrogen cycle3,10,11. A majority of studies investigating the fate of nitrogen during vegetation fires have concentrated on the production of ammonia, organic nitrogen, and NOx (NO and its oxidation products)12–16. These N-containing compounds in biomass burning aerosols have been confirmed to originate from the pyrolysis of nitrogen-containing compounds in biomass materials, specifically proteinaceous materials16–19, as 60–80% of nitrogen in biomass is present as protein-N20. Furthermore, high levels of free amino acids (FAAs) in aerosols were observed for open biomass burning events11,21,22. Free Amino acids, including Glycine (Gly), Serine (Ser), Phenylalanine (Phe), Threonine (Thr), and Proline (Pro), have been detected in volcanic emissions23. Free Alanine (Ala), Aspartic acid (Asp), Glutamine (Gln), and Glycine (Gly) have been measured in tobacco smoke24. Therefore, biomass burning has been suggested as a possible source of free amino acids in aerosols25. Besides that, the distribution of released amino acids during biomass pyrolysis differs significantly from that of natural sources (plants and soil)26. However, the mechanisms behind the release of FAAs into the atmosphere during biomass pyrolysis are largely unknown. This phenomenon may be closely related to the thermal stability and decomposition behavior of FAAs and proteins during pyrolysis. Thus, it is essential to elucidate the transformation of proteinaceous materials during biomass burning.
Upon thermal treatment, organic matter containing amino acids, peptides or proteins can produce cyclic dipeptides (DKPs, 2,5-diketopiperazines)27,28. Fabbri et al.27 suggested that the pyrolytic production of DKPs from amino acids is attributed to the condensation of amino acids into dipeptides in the melt, which then undergo cyclization with the elimination of water. However, the relative abundance of DKPs does not reflect the frequency of the corresponding amino acid sequences in protein chains. This discrepancy is explained by the varying tendencies of amino acids and peptides to form cyclic dipeptides and the occurrence of degradation reactions in the lateral chain, leading to the formation of distinctive DKPs, such as through the loss of functional groups (amine, guanidine, or cyanamide) 27,28. Faisal et al.29 proposed that the reaction pathway of dipeptides consists of consecutive reversible reactions involving cyclodipeptides, linear dipeptides, and FAAs. Linear dipeptides undergo cyclodehydration to form cyclic peptides, which further hydrolyze to reform linear dipeptides or FAAs29. Additionally, Ren and Zhao30 suggested that the secondary cracking reactions of DKPs are numerous and versatile. The cleavage at different locations in the DKP cyclic structure typically yields various secondary products, such as nitriles, amine, imines, pyrroline, hydantoins and α-lactam30. FAAs also can decompose further via deamination and decarboxylation, resulting in the formation of organic acids and amines17,31. This indicates that the transformation process of amino acids and proteins during biomass heating is highly complex. It remains unclear which specific species FAAs are released into aerosols through the biomass pyrolysis process and how the distribution of amino acids in aerosols differs from that in raw biomass.
Numerous studies have examined the hydrothermal kinetics and behavior of α-alanine, glycine and β-alanine32 and amino acids with functionally substituted side chains (phenylalanine (Phe), serine (Ser), threonine (Thr), proline (Pro), histidine (His), and methionine (Met))31,33,34, as well as dipeptide35,36. Importantly, these studies explored amino acid decomposition in high temperature and pressure aqueous solution. In addition, thermodynamic and kinetic data of the thermal decomposition process of amino acids in the solid phase under anoxic condition have been quantified 37,38. However, to the best of our knowledge, real-time studies providing quantitative kinetic information, such as the rate constant and activation energy of individual amino acid at high temperature in air are yet to be available. This gap in knowledge hinders the development of a generalized model to elucidate thermal degradation-induced changes in the distribution pattern of CAAs and FAAs during plant pyrolysis and the application of the distribution of amino acids as proxies to identify biomass burning sources.
To shed light on the current knowledge gaps, we analyzed the degradation of 18 equimolar amino acids at five distinct heating temperatures (160, 180, 200, 220, and 240 °C), varying the duration of heating. Further, the changes in the distribution of CAAs and FAAs induced by degradation during straw pyrolysis were examined, aim to: (1) obtain quantitative kinetic information of FAAs degradation during heating in air; (2) compare the degradation-induced changes in the distribution pattern of CAAs and FAAs in straw pyrolysis.
Materials and methods
Pyrolysis experiment of amino acids standard mixtures
In order to determine how different temperatures and times of heating affect the concentration of amino acids in residual materials during pyrolytic processes, five controlled heating experiments were performed.
A mixed liquid standard containing 18 amino acids (alanine (Ala), asparagine (Asn), aspartate (Asp), histidine (His), glutamine (Gln), glutamate (Glu), glycine (Gly), isoleucine (Ile), proline (Pro), phenylalanine (Phe), leucine (Leu), lysine (Lys), methionine (Met), serine (Ser), threonine (Thr), valine (Val), tyrosine (Tyr) and tryptophan (Trp), Sigma-Aldrich, St Louis, MO, USA) was prepared. Since proteinogenic amino acids arginine and cystine were not successfully converted into N(O)-(tert-butyldimethylsilyl) derivatives during the silyl derivatization process39, they were excluded in analysis. Each amino acid in this mixed standard was at a concentration of 1 nmol μL−1. One milliliter of this standard, containing 1 μmol of each amino acid was transferred to a pre-ashed quartz tube (850 °C for 2 h). The standard mixture was then lyophilized to dried solid powder prior to the pyrolysis experiment. Controlled pyrolysis experiments were conducted in a muffle furnace at five targeted heating temperature (160, 180, 200, 220, and 240 °C, respectively) and the muffle furnace was pre-heated for 30 min. After temperature stabilizes at the deepest part of the furnace, standard mixture of 18 amino acids were immediately exposed to the targeted temperature. The first group was carried out at the temperature of 160 °C for up to 5, 10 30 min, 2, 4, 6 and 8 h. The second group was exposed to 180 °C heating for 5, 10 30 min, 1, 2, 3 and 4 h. The third group was undertaken at temperatures of 200 °C heating for 5, 10 30 min, 1, 1.5, 2 and 4 h. The fourth group was exposed to 220 °C up to 2, 3 5, 10, 30, 2 and 4 h. The last experiment was undertaken at temperatures of 240 °C with the heating time consistent with 220 °C. Throughout the experiment, temperature measurements recorded with a thermocouple temperature meter (Eutech™ Temp 10, Thermo Scientific) exhibited fluctuations of ± 5 °C in the heating temperature. The heating experiments for amino acid standard mixture samples at each temperature and heating duration were conducted in triplicate. The heating time of amino acids varies at different temperatures, which is due to the different decomposition rates of amino acids at different temperatures. In order to obtain better kinetics curves of amino acids pyrolysis during the heating, the duration of the heating time is longer at low temperatures and shorter at high temperatures. The samples were heated at the extreme end of the muffle furnace to avoid the relatively cooler regions near the frontal part closer to the door. Moreover, the furnace door was kept open during the whole heating process to allow ambient air circulation and mimic the natural oxic condition.
After pyrolyzed, 250 μL of α-aminobutyric acid (250 μL, 1 nmol μL−1) aqueous solution was added into the quartz tube as an internal reference. The samples were then frozen dried and stored at − 80 °C prior to analysis.
Combustion experiment of straw
Rice straw samples (n = 3) were collected during July 2017 in Nanchang area (115.1°E, 28.2°N). In laboratory, straw was heated in cooking stoves, which is a domestic furnace widely used by residents. Heating time typically lasted 30 to 40 min. The sampling volume ranged from 26.6 to 41.9 m−3. The heating temperature of straw was 240 °C. Total suspended particulates (TSP) samples from straw heating were sampled at 1 m above the fire level from the funnel. Emissions from the stove were collected using a large iron exhaust hood and then sampled into the high-volume air sampler for TSP sample collection. The high-volume air samplers (KC‐1000, Qingdao Laoshan Electronic Instrument Company, China) pumped at 1050 L min−1 through 25 × 20 cm quartz fiber filters. Before sampling, quartz fiber filters were heated at 450 °C for 10 h to remove any organics. After sampling, filters were wrapped in pre-combusted (450 °C) aluminum foil envelopes, placed in separate plastic bags, and stored at − 20 °C prior to analysis.
Extraction and purification of amino acids in straw samples
The amino acids in straw samples included the two fractions (i) the free amino acids (FAAs) (i.e. those amino acids present in dissolvable state, directly extracted by Milli-Q water) (ii) the combined amino acids (CAAs) (i.e. those amino acids present in peptides and proteins, released by hydrolysis). The extraction method of plant sample was provided in our earlier publication40. Briefly, For FAAs in straw samples, 0.2–1 g straw was ground in liquid nitrogen into fine powders using a mortar and pestle. Then the straw power was extract by Milli-Q water twice and heated at 100 °C for 5 min to precipitate proteins. Subsequently, the extracted was then centrifuged for 5 min at 10,000 g and 5 °C, the supernatant was obtained. After 250 μL α-aminobutyric acid (1 nmol μL−1) aqueous solution was added as an internal reference, the exacted FAA was freeze-dried, redissolved in 1 ml of 0.1 M hydrochloric acid, and adjusted to pH = 1 and then immediately purified by a cation-exchange column (Dowex 50 W × 8 H+, 200–400 mesh size, Sigma-Aldrich). The cation exchange resin in the column was prepared following the method described by Amelung and Zhang41. The resin was activated by pre-rinsing with 25 ml of 2 M NaOH, conditioned with 25 ml of 2 M HCl, and washed with 40 ml of Milli-Q water until its pH approached neutrality. The purification procedure following the method described in previous studies42,43. First, the exacted FAA was added to the resin column. The centrifuge tube was then washed with 4 ml of 0.1 M HCl, and the resulting solution was also added to the resin column. To remove starch, sugars, organic acids, and other impurities, the resin was rinsed with five portions of 5 ml Milli-Q water. Finally, the amino acid fraction was eluted with three portions of 3 ml 10 wt% NH4OH aqueous solution and collected in glass tubes.26Then, the samples were then frozen dried prior to further analysis. It is noted that peptide hydrolysis under acidic conditions requires strong acids (6 M HCl)44 and high temperatures (above 100 °C)29,45. Under mild acidic conditions (pH = 1) and within brief purification time, cyclic dipeptides hydrolysis do not occur46. Therefore, only FAAs are extracted, purified and measured in the collected samples.
For CAAs in straw samples, approximately 30–40 mg of plant were ground into fine powders in liquid nitrogen. Then, well ground and homogenized straw powder was hydrolyzed by the hydrolysis method to convert total amino acids (TAAs) in samples to FAAs26.In brief, after the addition of 200 μl ascorbic acids aqueous solution at a concentration of 2.5 μg μl−1 and 10 ml 6 M HCl, glass hydrolysis tube was flushed with N2, then tightly sealed. The samples were hydrolyzed for 24 h at 110 °C. After cooling to room temperature, the hydrolyzed solution was dried with a stream of nitrogen. After dried, the hydrolyzed solution was redissolved in 0.1 M HCl and an internal reference aqueous solution (250 μl α-aminobutyric acid, 1 nmol μl−1) was added. Then, the hydrolyzed TAAs in straw samples were purified in the same way as FAAs in straw and frozen dried. The concentration of CAAs was obtained by subtracting the concentration of FAAs from that of TAAs.
Extraction and purification of amino acids in aerosol samples from straw pyrolysis
Similar to the straw sample, amino acids in aerosol samples also included FAAs and CAAs. For FAA analysis, each quarter the filter was extracted by 50 ml Milli-Q water. After ultrasonic vibration, shaken and centrifugalize, the extract was then filtered through a 0.22um polytetrafluoroethylene filter. After 250 μl α-aminobutyric acid (1 nmol μL−1) aqueous solution was added, the exacted FAA was adjusted to pH = 1 and then purified by a cation-exchange column (Dowex 50 W × 8 H+, 200–400 mesh size, Sigma-Aldrich). Finally, the samples were evaporated to dryness40.
For CAA in aerosol sample, the similar hydrolysis method as straw samples was used. One-eighth of each aerosol filter was hydrolyzed by 6 M HCl. After the hydrolysis, the sample was dried with a stream of nitrogen and then completely dissolved again in 0.1 M HCl. 250 μl α-aminobutyric acid (1 nmol μl−1) was added. Subsequently, the samples were purified by a cation-exchange column. The concentrations of the CAAs in aerosol samples were also calculated as the difference between the TAAs and FAAs concentrations.
Analysis of amino acids
After extraction, purification and frozen dried, AAs were prepared as AA-tert-butyl dimethylsilyl (tBDMS) derivatives. The derivatization procedures of the amino acids were prepared using a modified version of the method reported in a previous publication40. In brief, 150 μg anhydrous Na2SO4, 200 μL pyridine, and 50 μL N-methyl-N-(tert-butyldimethylsilyl) trifluoroacetamide were added to frozen dried amino acids in that order. Finally, the total amounts of dried samples were heated at 70 °C for 1 h to achieve the derivatization of amino acids.
The concentration of AA-tert-butyl dimethylsilyl (tBDMS) derivatives were determined by using a Thermo Trace GC (Thermo Scientific, Bremen, Germany) connected into a Thermo ISQ QD single quadrupole MS, which can provide the structural and concentration information for each eluting peak. The method detection limits (MDLs, n = 5) of the investigated individual AAs ranged from 0.2 pmol μL−1 for Phe to 48 pmol μL−1 for Trp (Table S1). Correlation coefficients obtained from linear regression analysis of calibration curves were better than 0.9865. Measurement results for blank samples with α-aminobutyric acid (1 nmol μL −1) as an internal reference were below the MDLs. To evaluate the recovery and accuracy of this pre-treatment, amino acid standard mixtures were added to the blank filters. The recovery of individual FAAs ranged from 79% for Tyr to 103% for Ala (Table S1) and showed high reproducibility (< 15%). The recoveries for most hydrolyzed AAs were higher than 74% and presented high reproducibility (< 10%). Lower recoveries were observed for hydrolyzed Tyr (52%), and relatively low reproducibility was noted for Asp and Glu (< 20%). These findings are consistent with previous studies, possibly due to the hydrolysis processes47,48. Hydrolysis completely decomposes Trp and promotes the deamination of Gln and Asn to Glu and Asp, respectively. Overall, the recoveries of free and hydrolyzed amino acids are considered satisfactory.
Data analysis
All statistical procedures and graphs were performed using Origin 2021 (OriginLab Corporation, Massachusetts, USA). The data were processed using nonlinear curve fit to establish an exponential relationship between residual concentration of individual amino acids under certain temperature and reaction time, and the results were accepted for P values < 0.05. We conducted a one-way analysis of variance (ANOVA) to examine the influence of heating time on the residual percentage of FAAs after heating at each experimental time. Tukey’s honestly significant difference (TukeyHSD) test was employed to determine significant differences in the residual percentage of FAAs post-heating. Further, differences in the residual percentage of FAAs following heating for 10 min at temperatures of 160, 180, 200, 220, and 240 °C, and variations in the residual percentage of 18 individual FAAs after heating at 180 °C, were analyzed using the one-way ANOVA procedure and compared using the Tukey-HSD test. In all analyses, statistically significant differences were defined as P < 0.05.
Results
Influence of heating conditions on the degradation of free amino acids
18 free amino acids were heated at different temperatures for a period, and their residual percentage (residual amino acid concentration after heating/initial amino acid concentration before heating × 100%) is shown in Fig. 1. The heating time, heating temperature, and types of free amino acids all have a significant impact on the residual percentage of amino acids, which was described below:
Fig. 1.

Residual percentage of 18 amino acids (residual amino acid concentration after heating / initial amino acid concentration (as mole%) under specific heating times at temperatures of 160, 180, 200, 220, and 240 °C.
Influence of heating duration
At each experimental temperature, the residual percentage of individual free amino acids significantly decreased with the increase in heating duration (ANOVA, P < 0.05), indicating that prolonged heating time significantly promote the degradation of 18 individual free amino acids. For example, after heating for 5 and 10 min at 160 °C, the remaining percentage of the majority 18 amino acids did not decrease (p > 0.05, Table S2), except for Glu and Asn (P < 0.05), suggesting that most free amino acids did not degrade after being heated for 10 min at 160 °C. When the heating time increases to 30 min, Glu, Asn and Gln exhibited significant degradation (P < 0.05), with their average residual percentages at 86, 97 and 69% respectively. After heating for up to 2 h, the residual percentages of Glu and Gln had dropped to 14%, but Tyr, Leu, Ile, Met, Val, and Phe still did not show significant degradation (the residual percentage was still above 90%, p > 0.05), only 12 types of amino acids had noticeably degraded (p < 0.05). Following 8 h heating, all 18 FAAs had significantly degraded (p < 0.05). Among them, Glu and Asn had completely degraded, and the residual percentage of Gln had dropped to 8%.
At higher temperatures, the decomposition of free amino acids was more sensitive to heating duration. For example, at 240 °C, heating for 2 min can cause Glu and Gln to degrade, and after heating for 5 min, all types of amino acids significantly degraded (p < 0.05, Table S3), with their residual percentage not exceeding 40%.
Influence of heating temperature
When the heating time remained constant, it was observed that an increase in heating temperature corresponded to a significant degradation for 18 free amino acids (ANOVA, p < 0.05, Table S4), resulting in a smaller residual percentage. Using a heating duration of 10 min as an example (as depicted by the pink circles in Fig. 1), at 160 °C, and the residual percentage for all 18 free amino acids was maintained at 100%, indicating no degradation occurred. At 180 °C, only Asn, Gln, Lys and His displayed significant degradation (p < 0.05, Table S4), with residual percentages of 86.8, 74.1, 94.7 and 95.2% respectively. A further increase to 200 °C led to decreased residual percentages of FAAs, with Glu and Gln dropping further to 65.2 and 53.1% respectively. At 220 °C, all FAAs species significantly degraded (p < 0.05, Table S4), with a sharp decline in their residual percentages (below 50%). For Asn (1.1%) and Gln (0.6%), degradation was nearly complete. By 240 °C, only a small percentage of Tyr remained (27.9%), with the other amino acids no longer detectable.
Stability of free amino acids during heating
The degree of degradation for free amino acids is closely related to their types. With the given experimental heating temperature and time, significant differences were observed in the residual percentages of different types of free amino acids, as displayed in Fig. 1. As a result, the stability of amino acids during heating can be determined according to their residual percentages’ changes with heating temperature and time. Within the temperature range of 160 to 240 °C, the degradation sequence of the 18 amino acids followed a consistent pattern under each experimental temperature condition. The amino acids that degraded initially were Gln, Glu, and Asn, as depicted on the right side of the Fig. 1, while Tyr, shown on the left side of the Fig. 1, degraded last. Consequently, based on the results of one-way analysis of variance (ANOVA) for amino acid thermal decomposition at 180 °C, amino acids with residue percentages significantly higher than 50% after 1 h heating, and notably higher than those of other amino acid species (P < 0.05, Table S5), are classified as hard-to-degrade amino acids. These include Tyr, Leu, Ile, Met, Val, and Phe. Conversely, amino acids with residue percentages significantly lower than 70% after heating for 30 min, and significantly lower than those of other amino acid species (P < 0.05, Table S6), are classified as easy-to-degrade amino acids, including Asn, Glu, and Gln.
The minimum time required for free amino acids degradation
Free amino acids require a minimum time (i.e., minimum degradation time) for degradation during heating. This minimum degradation time varies across different types of free amino acids (Table S7), influenced by the heating temperature. Notably, these 18 amino acids form the essential building blocks of proteins. Consequently, during the heating process of biomass, two critical minimum degradation times should be closely attended to the first minimum degradation time pertains to the minimum degradation time for the most easily degradable amino acids (Gln, Glu, and Asn) (Table S7). Below this time threshold, all amino acids remain stable, suggesting that the protein is undisturbed and intact. Therefore, this minimum degradation time can be obtained by analyzing the shortest time needed for Gln, Glu, and Asn to degrade at a given heating temperature (Table S7). For example, at 160 °C, Glu and Gln start degrading only after a heating duration of 30 min.
The second minimum degradation time corresponds to the shortest degradation duration required for the most resistant amino acid to degradation. Any heating duration longer than this indicates that all types of amino acids have begun to be destroyed. Therefore, this minimum degradation time is defined as the shortest time for the most resistant amino acid (Tyr) has begun to degrade. This value can be obtained by analyzing the shortest time needed for free Tyr to decompose at a given burning temperature (Table S7). For instance, at 160 °C, only when the heating time reached 2 h, Tyr started to degrade, with its residual percentage being 97.7%. Therefore, at a temperature of 160 °C, the minimum time required for the degradation of Tyrosine (Tyr) is 2 h, at which point all 18 free amino acids have been destroyed.
Kinetics reaction of free amino acids
Rate constants
Investigating the reaction kinetics of various free amino acids during heating will help understand the thermal degradation mechanism of free amino acids during the pyrolytic process, including the reaction rates and activation energies associated with heating-induced degradation of different free amino acids at a given temperature. The reaction rate constant in the heating induced degradation process of free amino acids can be discerned by analyzing variations in the molar concentration of different free amino acids with respect to temperature and time. Under experimental temperature conditions, the residual molar concentration of 18 kinds of free amino acids shows a negative exponential relationship with heating time (Fig. S1), which complies with the first-order reaction kinetics model:
 |
1 |
As described in Ref35, t is the heating time, Ct is the residual molar concentration after heating time t, C0 is the initial molar concentration, and k is the first-order reaction rate constant. The slope of this equation signifies the degradation rate constants (k) of free amino acids, induced by heating, at specific temperatures (Table 1). The standard error of k values for individual amino acids is provided in Table S8 of the supplementary materials. As can be seen from Table 1, when the heating temperature raised from 160 to 240 °C, the rate constants of 18 types of free amino acids increases. Notably, the reaction rate constants of different free amino acids varied significantly (Table 1). The rate constants of easily degraded amino acids such as Gln, Glu were significantly larger than those of difficult-to-degraded amino acids (e.g., Tyr). This disparity contributes to the differences in the residual percentages of various free amino acids at identical heating temperature and durations (Fig. 1).
Table 1.
First-order reaction rate constants of 18 free amino acids at temperatures of 160, 180, 200, 220, and 240 °C.
| AA | 160 °C | 180 °C | 200 °C | 220 °C | 240 °C |
|---|---|---|---|---|---|
| Tyr | 0.02 | 0.13 | 0.37 | 3.41 | 6.84 |
| Leu | 0.03 | 0.31 | 0.80 | 4.92 | 10.15 |
| Ile | 0.04 | 0.34 | 0.86 | 6.00 | 10.25 |
| Phe | 0.05 | 0.41 | 1.08 | 7.44 | 10.46 |
| Met | 0.06 | 0.38 | 0.96 | 7.08 | 10.33 |
| Val | 0.07 | 0.43 | 1.02 | 9.45 | 10.62 |
| Ala | 0.13 | 0.66 | 1.52 | 11.90 | 11.29 |
| Thr | 0.22 | 0.91 | 2.11 | 11.83 | 14.32 |
| Trp | 0.22 | 0.82 | 2.05 | 9.75 | 12.69 |
| Pro | 0.20 | 0.85 | 1.96 | 6.03 | 14.93 |
| Lys | 0.22 | 1.00 | 2.30 | 10.28 | 12.19 |
| Gly | 0.27 | 0.92 | 2.22 | 10.65 | 14.06 |
| Asp | 0.26 | 0.97 | 2.43 | 11.30 | 13.24 |
| Ser | 0.32 | 1.00 | 2.39 | 12.81 | 15.34 |
| Gln | 0.71 | 2.73 | 3.50 | 22.35 | 37.10 |
| Asn | 0.51 | 1.39 | 2.70 | 17.52 | 20.31 |
| His | 0.30 | 1.13 | 2.53 | 10.42 | 12.44 |
| Glu | 0.65 | 1.89 | 3.12 | 14.88 | 27.98 |
E
By taking the logarithm of the Arrhenius Eq. (2), we can get the Eq. (3):
 |
2 |
 |
3 |
According to the Ref31 and 35, where k is the reaction rate constant, lnA is the pre-exponential factor, T is the heating temperature, E is the activation energy, and R is the universal gas constant (8.314 J mol−1 K−1).
At a given temperature (160–240 °C), the natural logarithm (lnk) of the rate constant k for the degradation of free amino acids induced by burning (k value in Table 1) exhibits a linear negative correlation (p < 0.01) with the reciprocal of the experimental heating temperature (1/T), with a slope of (−E/R) (Fig. S2). Therefore, the activation energy (E) of each free amino acids can be determined by multiplying the slope of the linear relationship between lnk and 1/T for each amino acid with the universal gas constant ‘R’ (E = slope × R). The calculation results show that the range of activation energy for the degradation reaction of 18 free amino acids during heating is 88.5–137.4 kJ/mol. Among these, Tyr possesses the highest activation energy, while Gln has the lowest (Table 2).
Table 2.
Activation energies of the thermal degradation of 18 free amino acids and their respective standard errors at temperature ranged from 160–240 °C.
| Amino acid | Calculated E value (KJ/mol) |
|---|---|
| Tyr | 136.1 ± 9.9 |
| Leu | 132.6 ± 9.9 |
| Ile | 130.4 ± 9.9 |
| Phe | 126.6 ± 9.9 |
| Met | 122.3 ± 9.9 |
| Val | 121.7 ± 9.9 |
| Ala | 108.1 ± 9.9 |
| Thr | 99.9 ± 9.9 |
| Trp | 97.3 ± 9.9 |
| Pro | 97.0 ± 9.9 |
| Lys | 95.6 ± 9.9 |
| Gly | 95.0 ± 9.9 |
| Asp | 94.7 ± 9.9 |
| Ser | 94.1 ± 9.9 |
| Gln | 91.6 ± 9.9 |
| Asn | 90.0 ± 9.9 |
| His | 89.2 ± 9.9 |
| Glu | 87.6 ± 9.9 |
To further evaluate the factors influencing the degradation rates of free amino acids during heating, we analyzed the relationship between the degradation rate constants (k value in Table 1) of 18 free amino acids under given experimental heating temperatures (160–240 °C) and their melting points and activation energy. The results showed a significant linear negative correlation between the degradation rate of free amino acids at a given temperature and their melting points (r2 > 0.45, p < 0.01) (Fig. S4). There was also a significant negative exponential relationship between the degradation rate of these amino acids and the activation energy required for the degradation reaction at a specific temperature (r2 > 0.35, p < 0.01) (Fig. S4). Of all the free amino acids, Tyr had the highest melting point (342 °C) and activation energy (137.44 kJ/mol), thus, its degradation rate was the lowest among all types of free amino acids. On the other hand, Gln, which demonstrated the fastest degradation rate, possessed the lowest melting point and (177 °C). Its activation energy (92.5 kJ/mol) was also lower than most types of free amino acids (only slightly higher than Asn, His, and Glu). Therefore, the degradation rate of free amino acids during heating is influenced by their melting points and activation energy. In other words, the higher the melting point and activation energy of the free amino acid, the lower the degradation rate, and vice versa.
Distribution of combined and free amino acids pre- and post- pyrolysis of straw
During the pyrolytic process, apart from some residual combined amino acids in the straw being preserved, other combined amino acids are either directly decomposed or converted into free amino acids, which subsequently undergo degradation reactions. The degradation mechanism of free amino acids during pyrolysis process was obtained from the above free amino acid combustion experiments, but the transformation mechanism of combined amino acids during the pyrolysis is still unclear. Here, we analyzed the percentage changes of combined and free amino acids in straw and aerosol pre- and post-pyrolysis at 240 °C, to explore the mechanism behind the conversion of CAAs and FAAs in rice straw during pyrolysis.
CAAs
Significant differences were observed in the percentages of combined amino acids in the total CAAs pool before and after the pyrolysis of straw, except for Pro and Val. As shown in Fig. 2a, there were no dominant types of combined amino acids in the straw pre-pyrolysis, but post-pyrolysis, the combined Gly and Ala were the dominant amino acids in the aerosol, with their percentage composition markedly increasing from 9.2 and 9.8% to 32.8 and 32.3% respectively, as shown in Fig. 2b. Some combined amino acids (His, Tyr, Met, Trp, and Lys) were nearly undetectable in the straw post pyrolysis. These indicate that the combined Gly and Ala in the straw were relatively stable during pyrolysis, while the combined His, Tyr, Met, Trp, and Lys were highly unstable and prone to transformation.
Fig. 2.

The average percentage of combined amino acids (a) in straw, (b) in aerosol, and the average percentage of free amino acids (c) in straw and (d) in aerosol. The straw was heated at 240 °C.
FAA
Similar to combined amino acids, the percentage of free amino acids in straw also exhibited a significant alteration post-combustion (Fig. 2c and d). Prior to combustion, the types and percentage of free amino acids in straw were similar to those of the combined ones, with a relatively even distribution of all amino acids (Fig. 2c). However, post-pyrolysis, the types of free amino acids in the aerosol noticeably decreased, with only Ala, Pro, Gly, Asp, and Ser being detectable (Fig. 2d). Among them, Asp and Gly dominated, accounting for 52.5 and 31.6% of the total free amino acids in the aerosol, respectively.
The concentration of FAAs, CAAs and the ration of FAA/CAA in raw straw were showed in Table S9. To further investigate the distribution of amino acids in different forms (free and combined), the ratio of the percentage of free to combined amino acids (DAA = FAA%/CAA%) in both straw and aerosol were calculated. This ratio (DAA) reflects the relative changes in the percentages of free and combined amino acids pre- and post- straw pyrolysis. As depicted in Fig. 3, the pyrolytic process altered the DAA of amino acids. Prior to combustion, the DAAs of Ala, Pro, Gly, Ser, and Asp in straw were relatively close (all around 0.8, with an average of 0.8 ± 0.4, green bars in Fig. 3), but post-pyrolysis, the DAAs of these five amino acids in the aerosol varied greatly (for example, Ala was only 0.2, while Asp reached up to 1209.9, yellow bars in Fig. 3). Since other free amino acids were not detected in the aerosol, their DAAs are 0. We will not discuss the transformation of these amino acids during the pyrolytic processes further.
Fig. 3.
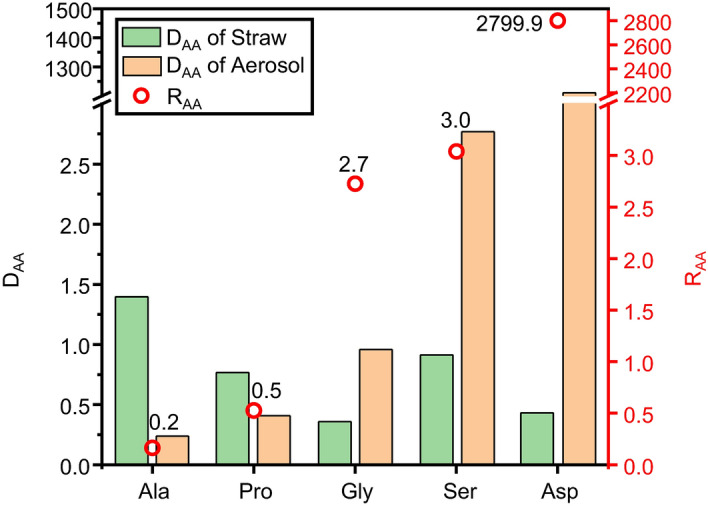
The ratio of the percentage of free to combined amino acids (DAA = FAA%/CAA%) in both straw (green column) and aerosol (orange column) formed from straw heating at 240 °C, as well as the redistribution (red circle) of Ala, Pro, Gly, Ser and Asp in the aerosol (RAA).
The ratio of the DAA of different types of amino acids in straw and aerosol was further calculated to examine the redistribution forms of distinct amino acids in the aerosol (RAA), as outlined in Eq. 4.
 |
4 |
As shown in Fig. 3, there was a huge difference in the RAA values of the five detectable free amino acids during the pyrolytic process, with Ala only being 0.2 and Asp peaking at 2799.9 (red circles in Fig. 3). This could suggest substantial differences in the transformation mechanisms and efficiencies of these five amino acids during the pyrolytic processes.
The DAA value of Gly, Ser, and Asp in aerosols emitted from pyrolysis was significantly higher than their respective DAA value in the straw (higher RAA value), indicating that these three amino acids are more likely to accumulate in the free form in the aerosol during pyrolysis; while the low RAA values of Ala and Pro suggest that the combined forms of Ala and Pro are more difficult to transform into the free form during pyrolysis.
Discussion
Impact of side chains on the heating stability of amino acids
This study comparatively analyzes the kinetic information and degradation behavior of 18 amino acids at 160, 180, 200, 220, and 240 °C. The findings reveal diverse burning stability across various types of amino acids. Under the same combustion temperature and duration, the degree and rate of degradation vary among different types of amino acids (Fig. 1 and Table 1). Generally, under oxic conditions, amino acids with a cyclic structure on the side chain (Tyr and Phe) have stronger stability than aliphatic amino acids; hydrophobic amino acids (Ala, Val, Leu, and Ile) exhibit greater stability than hydrophilic amino acids (Ser, Glu, and Asp); for aliphatic amino acids, those with simpler structures, like Ala, show relatively better stability. To our knowledge, this is the first study exploring the heating stability of 18 amino acids in air.
However, previous studies showed that in high-temperature, high-pressure water bodies, the heating stability of amino acids were also significantly influenced by the length and the functional groups of their side chains31,34. Sato et al.31 compared the degradation rates of Gly, Ala, Leu, Asp, Phe, and Ser in high-temperature and high-pressure water. They found that the degradation rates of hydrophilic amino acids (Ser and Asp) were higher than those of hydrophobic amino acids (Leu and Phe). They also observed that simpler structured amino acids are more thermally stable at high temperatures, with Asp degrading the fastest and Ala degrading the slowest. Li and Brill34 investigated the role of different functional groups in the side chains of amino acids on their degradation rates under hydrothermal conditions. They found that the presence of hydroxyl, aromatic, nitrogenous, imidazole, and thioether groups in the side chains can cause differences in the pyrolysis rate of amino acids by up to 120 times. Similarly, under the protection of inert gas, the thermal pyrolysis stability of amino acids at high temperatures is also significantly affected by the side chains of amino acids. Rodante37 found that under high-temperature conditions protected by nitrogen, amino acids with cyclic structures on the side chains (such as Trp, Phe, and Tyr) showed better thermal stability than those with fatty side chains. In contrast, amino acids with negatively charged side chains (COO–) like Asp and Glu showed the poorest thermal stability due to the promotion of decarboxylation by the negatively charged side chain. They also found that for α-amino acids, longer side chains make the amino acids more prone to pyrolysis. Therefore, we speculate that the thermal degradation rates of amino acids are affected by the length of the side chain and the difference in functional groups under various conditions.
Kinetics of amino acid degradation during heating
The experiment demonstrates that within the temperature range of 160–240 °C, the concentration of 18 amino acids decreases exponentially with the increase of reaction time, indicating that their degradation processes during heating under ambient oxygen all conform with the irreversible first-order reaction kinetics (Fig. S1). The rate constants for the combustion and pyrolysis reactions of the 18 amino acids in air within this temperature range are provided (Table 1). Previous studies on the hydrolysis of amino acids in high-temperature, high-pressure water bodies and under inert gas protection or vacuum conditions showed that degradation of amino acids under anoxic condition also follow first-order reaction kinetics (Table 3). For instance, in water bodies at 200–340 °C and 20 MPa, the hydrolysis reactions of Gly, Ala, Leu, Phe, and Ser complied with first-order reaction kinetics31. The decarboxylation reactions of Phe, Ser, Thr, Pro, His, and Met in aqueous solutions under T = 270–340 °C, P = 275 bar conditions also conformed to first-order kinetics34. Similarly, Qian et al.35 found that the degradation reactions of Gly, Ala, and Glu in aqueous solutions protected by N2 at 220 °C all complied with first-order reaction kinetics, with their degradation rate exponentially increasing as the temperature rises. Besides, studies have shown that the high-temperature pyrolysis process of sulfur-containing amino acids (Met and Cys) under vacuum conditions also conforms to first-order reaction kinetics38. However, the reported hydrolysis rates of amino acids in aqueous solutions (6.63 × 10⁻⁴–1.36 × 10⁻³ h−1) are much slower than the degradation rates of solid amino acids in air in this study (0.02–27.98 h−1), which could be because the oxygen accelerates the degradation of amino acids49.
Table 3.
Detailed overview of the experimental conditions and observations of studies presenting quantitative kinetic information on the stability of amino acids.
| References | Condition | Amino acids | Kinetic reaction | E (KJ mol−1) |
|---|---|---|---|---|
| Kinetics of AA decomposition in high temperature and high pressure water | ||||
| Li and Brill 34 | pH = 1.5–8.5, T = 270–340 °C, P = 275 bar | Phe, Ser, Thr, Pro, His, Met | First order rate law | 110.0–190.55 (320 °C) |
| Cox and Seward 32 | T = 120–165 °C 20 bar | Ala cyclization | First order rate law | 114 |
| Qian et al. 35 | 100–220 °C Water steam pressure | Ala,Gly,Glu,Gly-Gly | First order rate law | 98.9(dipeptide Gly-Gly) |
| Sato et al. 31 | 200–340 °C, 20 MPa | Ala, Gly,Phe, Ser and Asp | First order rate law | 154 (Ala) |
| Changi et al. 33 | 220–350 °C | Phe | First order rate law | 144 |
| Kinetics of AA decomposition under nitrogen or in an evacuated system | ||||
| Yablokov et al. 38 | Evacuated system, T = 190–240 °C heating rate 10 °C/min | Met, Ser | First order rate law | 184–195 |
| Rodante 37 | N2-filled dry box, T = 77–600 °C,heating rate 10 °C/min | 19 Amiono acids | First order rate law | 2.1–38.8 |
| Kinetics of protein decomposition under nitrogen protection | ||||
| Ali et al. 50 | From ambient to 900 °C | Protein of Botryococcus braunii | Follow Šesták and Berggren (SB) models | 49.5–109 |
| Aniza et al. 51 | From room temperature to 600 °C | Protein of microalgae | Follow independent parallel reaction (IPR) and particle swarm optimization (PSO) model | 126.69–304.61 |
| Viju et al. 52 | From room temperature to 1000 °C | Protein of Nannochloropsis oculata | Follow distributed activation energy model | 106 |
| Kinetics of AA decomposition under natural condition (ambient oxygen) | ||||
| This study | 160–240 °C | 18 Amino acids | First-order | 88.50–137.44 |
In this study, the change in the degradation rate of 18 amino acids with temperature follows the linearized Arrhenius rate law (Fig. S2). The results of the residual analysis for the linear fitting were displayed in Fig. S3. According to the Arrhenius formula, the activation energy required for the degradation of amino acids at temperatures ranging from 160–240 °C was found to be 88.5–137.44 kJ mol−1 (Table 2). This falls in line with the activation energy required for amino acid degrade under similar temperature in hydrothermal conditions, for example, the activation energy (E) required for Ala to undergo ring formation (120–165 °C, 20 bar) is 114 kJ mol−121. In this study, the activation energy required for degradation of Ala was found to be similar, at 109.20 kJ mol−1. Similarly, the activation energy of Gly degradation in this study is 95.9 kJ mol−1, which is close to the activation energy for the hydrolysis of Gly dipeptide under steam pressure at 100–220 °C (98.9 kJ mol−1) 35. This could be because the mechanisms of amino acids degradation in air are similar to their hydrolysis mechanism under hydrothermal conditions at comparable temperatures.
Moreover, the activation energy needed for amino acid degradation presented in this study aligns with the range of activation energy required for protein pyrolysis in biomass as outlined in previous research. For instance, the activation energy required for protein pyrolysis in Botryococcus braunii lied between 49.5 and 109 kJ·mol−1, with their conversion rate varied from 7.5 to 92.5% 50. Under low-temperature conditions (< 300 °C), the activation energy needed for protein pyrolysis in microalgae ranged from 126.69 to 304.61 kJ·mol−1 51. The activation energy required for the pyrolysis process of proteins in Nannochloropsis oculata was reported to be between 90.74–99.31 kJ·mol−1 52.
Distribution of the amino acids in aerosol-a marker for biomass pyrolysis
Past research on nitrogenous compounds released from biomass pyrolysis has chiefly focused on NH3, NOx13, and other nitrogenous gaseous products like HCN 12,15, with nitrogenous compounds in particulate matter often being overlooked. Straw pyrolysis experiments have demonstrated that the aerosol produced contains both combined and free-form amino acids, demonstrating that biomass pyrolysis releases amino acids into atmospheric particulate matter (Fig. 2). Moreover, a large discrepancy between the percentage characteristics of amino acids (both combined and free) in the aerosol and in the straw were observed (Fig. 2). Comparing the percentage distribution characteristics of amino acids in straw, the percentage of the combined amino acids Gly and Ala in the aerosol released from straw pyrolysis significantly increased, becoming the dominant types of combined amino acids. Besides that, Pro accounted for a relative high portion (13.5%) in the aerosol. These three amino acids are the most likely to form cyclic dipeptides during pyrolysis 28. Douda and Basiuk28 found in their offline pyrolysis experiments involving nine amino acid species that Pro, Ala, and Gly yielded high amounts of cyclic dipeptides known as 2,5-diketopiperazines (DKPs), with the yields of these cyclic dipeptides exceeding the recovery of the starting free amino acids during pyrolysis. They attributed this phenomenon for Gly and Ala to minimal steric hindrance in their cyclodimerization, as Gly lacks an α-alkyl substituent and Ala has only small methyl substituent. Despite Pro having a large α-substituent connected directly to the nitrogen atom, a high yield of cyclic dipeptides was still observed28. Numerous studies also suggested that Pro readily forms DKPs when thermally treated with amino acids and proteins27,53 and DKPs derived from Pro are considered quite stable54. In contract, the formation of DKPs from the most hydrophilic amino acids, such as Asp, Glu, Asn, and Lys, may be inhibited55. Moreover, degradation reactions of the side chain occur during protein pyrolysis, which could lead to the conversion of specific amino acids in the protein chains into cyclic peptides containing other amino acid species. For example, during the pyrolysis of Pro-Asp, Asp residue would loss the lateral chain (decarboxylation) to form isomeric cyclo (Pro-Ala)27. The high percentage of combined Ala in aerosols during the pyrolysis of straw may also result from the loss of side chains of other amino acids in the protein chains. We propose that the high percentage of Ala, Gly, and Pro observed in aerosols released during the pyrolysis of straw is due to the easier formation of cyclic dipeptides containing these three amino acids during protein degradation. In the hydrolysis processes of filter samples, under the conditions of heating at 110 °C with 6 M HCl, these cyclic dipeptide were hydrolyzed into free Ala, Gly, and Pro, which can be measured.
On the other hand, the tendency for the loss of lateral chains from various amino acid residues during protein pyrolysis can also lead to the formation of heterocyclic nitrogen compounds that do not contain amino acids. During the pyrolysis of Gly-Lys dipeptide, Lys losses the amino group to form pyrrolidino[1,2a]3,6-piperazinediones with a 4-butenyl lateral chain27. The loss of lateral chains from aromatic amino acids produces toluene and indole. Glu and Gln undergo cyclization with the elimination of water and ammonia, respectively, resulting in the formation of cyclo(Pro-pyroGlu). This may explain the disappearance of bound Tyr, Trp, and Lys in the aerosols released during straw combustion, as well as the significant decrease in the percentage of bound Asp and Glu in the aerosols compared to their percentages in the raw straw samples. Therefore, the distribution of CAAs in aerosols released from straw pyrolysis may indicate which amino acid species in the protein chain of the raw material are prone to forming stable cyclic dipeptides.
For FAA species, extraction was performed using Milli-Q water. The cyclic peptides do not hydrolyze under the conditions used for FAA extraction29,44–46. Consequently, only FAA species were measured. In this study, the distribution of FAAs in aerosols during straw pyrolysis differs from that of CAAs. The aerosol only contains the free amino acids Asp, Gly, Pro, Ala, and Ser, with Asp and Gly being the main types of free amino acids. This suggested that pyrolysis pathway of FAAs is different from that of CAAs. This typical distribution characteristic of amino acids in aerosol from biomass pyrolysis sources was also found in our previous research. Our previous research revealed a higher percentage of both combined and free Gly in particulate matter emitted from biomass pyrolysis compared to their percentage in plant and soil sources26. Additionally, it was found that when influenced by biomass combustion in Western Siberia, Russia, free amino acids in the Arctic aerosols, which exhibited a positive correlation with the biomass combustion indicator levoglucosan, were primarily composed of free Gly and D-Ala 56. Since the pyrolysis reaction of protein/amino acid is very complex30, the FAAs formed during the biomass pyrolysis may resulted from numerous secondary reactions involving cyclic dipeptide and linear dipeptide30,57. Ren and Zhao30 suggested that the main products of these secondary reactions include amine and imine. Weiss et al.57 indicated that the central peptide bond can be cleaved; however, this process is specific to the glycine dimer, in which the Cα atoms are not shielded by side chains. It is interesting to find that free Gly and Asp being the predominant free amino acid in aerosols emitted from straw pyrolysis. This characteristic could potentially be used as a tracer to track the impact of straw pyrolysis sources.
Conclusions
This work serves to understand the conversion mechanism from protein N to free amino acids, including the liberation process of combined amino acids and degradation process of free amino acids during biomass pyrolysis. Our heating experiments of equimolar free amino acids at temperatures ranged from 160 to 240 °C in air indicated that the stability of 18 amino acids varied during heating processes. This variation is closely related to the length and functional groups present in their side chains. Within the temperature range of 160–240 °C, we observed that the degradation processes of all 18 amino acids, under ambient oxygen during heating, conformed to irreversible first-order reaction kinetics. Applying the Arrhenius formula, the activation energy required for the degradation of amino acids at temperatures ranging from 160–240 °C was found to be 88.5–137.44 kJ mol−1. In this study, the typical distribution characteristics of amino acids in aerosol from straw burning were observed. Gly and Ala were found to be the dominant types of combined amino acids, while only five free form amino acids (including Ala, Pro, Gly, Asp, and Ser) can be detected in the aerosol, which could potentially be used as biomarkers to trace the impact of straw pyrolysis sources. This study will enhance the accuracy of evaluating the impact of biomass pyrolysis on the composition of amino acids in biomass and elucidating the transformation mechanisms of protein-N during biomass pyrolysis. However, the main components in different kinds of biomass exert varying effects on the conversion of proteins and amino acids30. Moreover, the stability of intermediates produced from different amino acids during pyrolysis is variable; thus, the distribution of proteins and amino acids may depend on the specific types present in the raw biomass 27. Future research should focus on comparative studies of the release of FAAs and CAAs in aerosols generated from the pyrolysis of various biomass types. This research will establish a foundation for utilizing protein materials to trace biomass pyrolysis processes.
Supplementary Information
Author contributions
Ren-Guo Zhu: conceptualization, methodology, software, writing—original draft. Hua-Yun Xiao: data curation, supervision, writing—review & editing. Zhongkui Zhou: resources. Meiju Yin: investigation, formal analysis. Hao Xiao: investigation, methodology. Caixia Hu: formal analysis, software. Guo Wei: software. Cheng Liu: methodology.
Funding
This work was supported by the National Natural Science Foundation of China (Grant No. 42363011).
Data availability
Data is provided within the manuscript or supplementary information files.
Declarations
Competing interests
The authors declare no competing interests.
Footnotes
Publisher’s note
Springer Nature remains neutral with regard to jurisdictional claims in published maps and institutional affiliations.
Supplementary Information
The online version contains supplementary material available at 10.1038/s41598-024-79032-8.
References
- 1.Giglio, L., Boschetti, L., Roy, D. P., Humber, M. L. & Justice, C. O. The collection 6 MODIS burned area mapping algorithm and product. Remote Sens. Environ.217, 72–85. 10.1016/j.rse.2018.08.005 (2018). [DOI] [PMC free article] [PubMed] [Google Scholar]
- 2.Randerson, J. T., Chen, Y., van der Werf, G. R., Rogers, B. M. & Morton, D. C. Global burned area and biomass burning emissions from small fires. J. Geophys. Res. Biogeosci.10.1029/2012JG002128 (2012). [Google Scholar]
- 3.Bowman, D. M. J. S. et al. Vegetation fires in the anthropocene. Nat. Rev. Earth Environ.1, 500–515. 10.1038/s43017-020-0085-3 (2020). [Google Scholar]
- 4.Ramanathan, V. & Carmichael, G. Global and regional climate changes due to black carbon. Nat. Geosci.1, 221–227. 10.1038/ngeo156 (2008). [Google Scholar]
- 5.Sarangi, V., Roy, S. & Sanyal, P. Effect of burning on the distribution pattern and isotopic composition of plant biomolecules: Implications for paleoecological studies. Geochim. Cosmochim. Acta318, 305–327. 10.1016/j.gca.2021.12.003 (2022). [Google Scholar]
- 6.Pellegrini, A. F. A. et al. Low-intensity frequent fires in coniferous forests transform soil organic matter in ways that may offset ecosystem carbon losses. Glob. Change Biol.27, 3810–3823. 10.1111/gcb.15648 (2021). [DOI] [PubMed] [Google Scholar]
- 7.Vernooij, R. et al. Stable carbon isotopic composition of biomass burning emissions—implications for estimating the contribution of C3 and C4 plants. Atmos. Chem. Phys.22, 2871–2890. 10.5194/acp-22-2871-2022 (2022). [Google Scholar]
- 8.Chen, J. et al. A review of biomass burning: Emissions and impacts on air quality, health and climate in China. Sci. Total Environ.579, 1000–1034. 10.1016/j.scitotenv.2016.11.025 (2017). [DOI] [PubMed] [Google Scholar]
- 9.Liang, L. et al. Biomass burning impacts on ambient aerosol at a background site in East China: Insights from a yearlong study. Atmos. Res.231, 104660. 10.1016/j.atmosres.2019.104660 (2020). [Google Scholar]
- 10.Certini, G., Nocentini, C., Knicker, H., Arfaioli, P. & Rumpel, C. Wildfire effects on soil organic matter quantity and quality in two fire-prone Mediterranean pine forests. Geoderma167–168, 148–155. 10.1016/j.geoderma.2011.09.005 (2011). [Google Scholar]
- 11.Mace, K. A., Artaxo, P. & Duce, R. A. Water-soluble organic nitrogen in Amazon Basin aerosols during the dry (biomass burning) and wet seasons. J. Geophys. Res. Atmos.10.1029/2003JD003557 (2003). [Google Scholar]
- 12.Song, W. & Liu, X.-Y. Nitrogen isotope signatures of oxidized nitrogen species from biomass burning. Appl. Geochem.150, 105569. 10.1016/j.apgeochem.2023.105569 (2023). [Google Scholar]
- 13.Fibiger, D. L. & Hastings, M. G. First measurements of the nitrogen isotopic composition of NOx from biomass burning. Environ. Sci. Technol.50, 11569–11574. 10.1021/acs.est.6b03510 (2016). [DOI] [PubMed] [Google Scholar]
- 14.Roberts, J. M. et al. The nitrogen budget of laboratory-simulated western US wildfires during the FIREX 2016 fire lab study. Atmos. Chem. Phys.20, 8807–8826. 10.5194/acp-20-8807-2020 (2020). [Google Scholar]
- 15.Anca-Couce, A., Sommersacher, P., Evic, N., Mehrabian, R. & Scharler, R. Experiments and modelling of NOx precursors release (NH3 and HCN) in fixed-bed biomass combustion conditions. Fuel222, 529–537. 10.1016/j.fuel.2018.03.003 (2018). [Google Scholar]
- 16.Song, J. et al. Molecular characterization of nitrogen-containing compounds in Humic-like substances emitted from biomass burning and coal combustion. Environ. Sci. Technol.56, 119–130. 10.1021/acs.est.1c04451 (2022). [DOI] [PubMed] [Google Scholar]
- 17.Turekian, V. C., Macko, S., Ballentine, D., Swap, R. J. & Garstang, M. Causes of bulk carbon and nitrogen isotopic fractionations in the products of vegetation burns: Laboratory studies. Chem. Geol.152, 181–192. 10.1016/S0009-2541(98)00105-3 (1998). [Google Scholar]
- 18.Ren, Q. & Zhao, C. NOx and N2O precursors from biomass pyrolysis: Nitrogen transformation from amino acid. Environ. Sci. Technol.46, 4236–4240. 10.1021/es204142e (2012). [DOI] [PubMed] [Google Scholar]
- 19.Ren, Q. & Zhao, C. NOx and N2O precursors from biomass pyrolysis: Role of cellulose hemicellulose lignin. Environ. Sci. Technol.47, 8955–8961. 10.1021/es4017574 (2013). [DOI] [PubMed] [Google Scholar]
- 20.Chen, H. et al. NOx precursors from biomass pyrolysis: Distribution of amino acids in biomass and Tar-N during devolatilization using model compounds. Fuel187, 367–375. 10.1016/j.fuel.2016.09.075 (2017). [Google Scholar]
- 21.Zangrando, R. et al. Five primary sources of organic aerosols in the urban atmosphere of Belgrade (Serbia). Sci. Total Environ.571, 1441–1453. 10.1016/j.scitotenv.2016.06.188 (2016). [DOI] [PubMed] [Google Scholar]
- 22.Samy, S., Robinson, J., Rumsey, I. C., Walker, J. T. & Hays, M. D. Speciation and trends of organic nitrogen in southeastern U.S. fine particulate matter (PM2.5). J. Geophys. Res.: Atmos.118(4), 1996–2006. 10.1029/2012JD017868 (2013). [Google Scholar]
- 23.Scalabrin, E. et al. Amino acids in arctic aerosols. Atmos. Chem. Phys.12, 10453–10463. 10.5194/acp-12-10453-2012 (2012). [Google Scholar]
- 24.Schmeltz, I. & Hoffmann, D. Nitrogen-containing compounds in tobacco and tobacco smoke. Chem. Rev.77, 295–311. 10.1021/cr60307a001 (1977). [Google Scholar]
- 25.Barbaro, E. et al. Free amino acids in Antarctic aerosol: Potential markers for the evolution and fate of marine aerosol. Atmos. Chem. Phys.15, 5457–5469. 10.5194/acp-15-5457-2015 (2015). [Google Scholar]
- 26.Zhu, R.-G. et al. Sources and transformation processes of proteinaceous matter and free amino acids in PM2.5. J. Geophys. Res. Atmos.125, e2020JD032375. 10.1029/2020jd032375 (2020). [Google Scholar]
- 27.Fabbri, D., Adamiano, A., Falini, G., De Marco, R. & Mancini, I. Analytical pyrolysis of dipeptides containing proline and amino acids with polar side chains. Novel 2,5-diketopiperazine markers in the pyrolysates of proteins. J. Anal. Appl. Pyrolysis95, 145–155. 10.1016/j.jaap.2012.02.001 (2012). [Google Scholar]
- 28.Douda, J. & Basiuk, V. A. Pyrolysis of amino acids: Recovery of starting materials and yields of condensation products. J. Anal. Appl. Pyrolysis56, 113–121. 10.1016/S0165-2370(00)00078-4 (2000). [Google Scholar]
- 29.Faisal, M., Sato, N., Quitain, A. T., Daimon, H. & Fujie, K. Hydrolysis and cyclodehydration of dipeptide under hydrothermal conditions. Ind. Eng. Chem. Res.44, 5472–5477. 10.1021/ie0500568 (2005). [Google Scholar]
- 30.Ren, Q. & Zhao, C. Evolution of fuel-N in gas phase during biomass pyrolysis. Renew. Sustain. Energy Rev.50, 408–418. 10.1016/j.rser.2015.05.043 (2015). [Google Scholar]
- 31.Sato, N., Quitain, A. T., Kang, K., Daimon, H. & Fujie, K. Reaction kinetics of amino acid decomposition in high-temperature and high-pressure water. Ind. Eng. Chem. Res.43, 3217–3222. 10.1021/ie020733n (2004). [Google Scholar]
- 32.Cox, J. S. & Seward, T. M. The reaction kinetics of alanine and glycine under hydrothermal conditions. Geochim. Cosmochim. Acta71, 2264–2284. 10.1016/j.gca.2007.01.020 (2007). [Google Scholar]
- 33.Changi, S., Zhu, M. & Savage, P. E. Hydrothermal reaction kinetics and pathways of phenylalanine alone and in binary mixtures. ChemSusChem5, 1743–1757. 10.1002/cssc.201200146 (2012). [DOI] [PubMed] [Google Scholar]
- 34.Li, J. & Brill, T. B. Spectroscopy of hydrothermal reactions 25: Kinetics of the decarboxylation of protein amino acids and the effect of side chains on hydrothermal stability. J. Phys. Chem. A107, 5987–5992. 10.1021/jp0224766 (2003). [Google Scholar]
- 35.Qian, Y., Engel, M. H., Macko, S. A., Carpenter, S. & Deming, J. W. Kinetics of peptide hydrolysis and amino acid decomposition at high temperature. Geochim. Cosmochim. Acta57, 3281–3293. 10.1016/0016-7037(93)90540-D (1993). [DOI] [PubMed] [Google Scholar]
- 36.Sakata, K., Kitadai, N. & Yokoyama, T. Effects of pH and temperature on dimerization rate of glycine: Evaluation of favorable environmental conditions for chemical evolution of life. Geochim. Cosmochim. Acta74, 6841–6851. 10.1016/j.gca.2010.08.032 (2010). [Google Scholar]
- 37.Rodante, F. Thermodynamics and kinetics of decomposition processes for standard α-amino acids and some of their dipeptides in the solid state. Thermochim. Acta200, 47–61. 10.1016/0040-6031(92)85105-5 (1992). [Google Scholar]
- 38.Yablokov, V. A., Vasina, Y. A., Zelyaev, I. A. & Mitrofanova, S. V. Kinetics of thermal decomposition of sulfur-containing amino acids. Russ. J. Gen. Chem.79, 1141–1145. 10.1134/S1070363209060188 (2009). [Google Scholar]
- 39.Molero, G., Aranjuelo, I., Teixidor, P., Araus, J. L. & Nogués, S. Measurement of 13C and 15N isotope labeling by gas chromatography/combustion/isotope ratio mass spectrometry to study amino acid fluxes in a plant-microbe symbiotic association. Rapid Commun. Mass Spectrom.25, 599–607. 10.1002/rcm.4895 (2011). [DOI] [PubMed] [Google Scholar]
- 40.Zhu, R.-G., Xiao, H.-Y., Zhang, Z. & Lai, Y. Compound-specific δ15N composition of free amino acids in moss as indicators of atmospheric nitrogen sources. Sci. Rep.8, 14347. 10.1038/s41598-018-32531-x (2018). [DOI] [PMC free article] [PubMed] [Google Scholar]
- 41.Amelung, W. & Zhang, X. Determination of amino acid enantiomers in soils. Soil Biol. Biochem.33, 553–562. 10.1016/S0038-0717(00)00195-4 (2001). [Google Scholar]
- 42.Zhang, Z. et al. A reliable compound-specific nitrogen isotope analysis of amino acids by GC-C-IRMS following derivatisation into N-pivaloyl-iso-propyl (NPIP)esters for high-resolution food webs estimation. J. Chromatogr. B1033–1034, 382–389. 10.1016/j.jchromb.2016.09.004 (2016). [DOI] [PubMed] [Google Scholar]
- 43.Zhang, Z., Xiao, H., Zheng, N., Gao, X. & Zhu, R. G. Compound-specific isotope analysis of amino acid labeling with stable isotope nitrogen (15N) in higher plants. Chromatographia79, 1197–1205. 10.1007/s10337-016-3126-9 (2016). [Google Scholar]
- 44.Borthwick, A. D. 2,5-diketopiperazines: Synthesis, reactions, medicinal chemistry, and bioactive natural products. Chem. Rev.112, 3641–3716. 10.1021/cr200398y (2012). [DOI] [PubMed] [Google Scholar]
- 45.Harris, J. I., Cole, R. D. & Pon, N. G. The kinetics of acid hydrolysis of dipeptides. Biochem J.62, 154–159. 10.1042/bj0620154 (1955). [DOI] [PMC free article] [PubMed] [Google Scholar]
- 46.Synge, R. L. The kinetics of low temperature acid hydrolysis of gramicidin and of some related dipeptides. Biochem J.39, 351–355. 10.1042/bj0390351 (1945). [DOI] [PMC free article] [PubMed] [Google Scholar]
- 47.Mandalakis, M., Apostolaki, M. & Stephanou, E. G. Trace analysis of free and combined amino acids in atmospheric aerosols by gas chromatography-mass spectrometry. J. Chromatogr. A1217, 143–150. 10.1016/j.chroma.2009.11.021 (2010). [DOI] [PubMed] [Google Scholar]
- 48.Samy, S., Robinson, J. & Hays, M. D. An advanced LC-MS (Q-TOF) technique for the detection of amino acids in atmospheric aerosols. Anal. Bioanal. Chem.401, 3103–3113. 10.1007/s00216-011-5238-2 (2011). [DOI] [PubMed] [Google Scholar]
- 49.Shock, E. L. Do amino acids equilibrate in hydrothermal fluids?. Geochim. Cosmochim. Acta54, 1185–1189. 10.1016/0016-7037(90)90450-Y (1990). [Google Scholar]
- 50.Ali, I., Naqvi, S. R. & Bahadar, A. Kinetic analysis of Botryococcus braunii pyrolysis using model-free and model fitting methods. Fuel214, 369–380. 10.1016/j.fuel.2017.11.046 (2018). [Google Scholar]
- 51.Aniza, R. et al. Independent parallel pyrolysis kinetics of extracted proteins and lipids as well as model carbohydrates in microalgae. Appl. Energy.300, 117372. 10.1016/j.apenergy.2021.117372 (2021). [Google Scholar]
- 52.Viju, D., Gautam, R. & Vinu, R. Application of the distributed activation energy model to the kinetic study of pyrolysis of Nannochloropsis oculata. Algal Res.35, 168–177. 10.1016/j.algal.2018.08.026 (2018). [Google Scholar]
- 53.Smith, G. G., Sudhakar Reddy, G. & Boon, J. J. Gas chromatographic–mass spectrometric analysis of the Curie-point pyrolysis products of some dipeptides and their diketopiperazine. J. Chem. Soc., Perkin Trans.2(2), 203–211. 10.1039/P29880000203 (1988). [Google Scholar]
- 54.Fischer, P. M. Diketopiperazines in peptide and combinatorial chemistry. J. Pept. Sci.9, 9–35. 10.1002/psc.446 (2003). [DOI] [PubMed] [Google Scholar]
- 55.Noguerola, A. S., Murugaverl, B. & Voorhees, K. J. An investigation of dipeptides containing polar and nonpolar side groups by curie-point pyrolysis tandem mass spectrometry. J. Am. Soc. Mass Spectrom.3, 750–756. 10.1016/1044-0305(92)87088-G (1992). [DOI] [PubMed] [Google Scholar]
- 56.Feltracco, M. et al. Free and combined L-and D-amino acids in arctic aerosol. Chemosphere220, 412–421. 10.1016/j.chemosphere.2018.12.147 (2019). [DOI] [PubMed] [Google Scholar]
- 57.Weiss, I. M., Muth, C., Drumm, R. & Kirchner, H. O. K. Thermal decomposition of the amino acids glycine, cysteine, aspartic acid, asparagine, glutamic acid, glutamine, arginine and histidine. BMC Biophys.11, 2. 10.1186/s13628-018-0042-4 (2018). [DOI] [PMC free article] [PubMed] [Google Scholar]
Associated Data
This section collects any data citations, data availability statements, or supplementary materials included in this article.
Supplementary Materials
Data Availability Statement
Data is provided within the manuscript or supplementary information files.