Abstract
AIM
To investigate the features of retinal ischemic injuries in a novel mouse model with bilateral carotid artery stenosis (BCAS).
METHODS
BCAS was induced with microcoil implantation in 6-8-week-old C57BL6 mice. Cerebral blood flow was monitored at 2, 7, and 28d postoperatively. Retinal morphological changes were evaluated by fundus photography and hematoxylin-eosin staining. Fluorescein fundus angiography (FFA) was performed to detect retinal vascular changes and circulation. The levels of apoptosis, activation of neurogliosis, and expression of hypoxia-inducible factor (HIF)-1α in the retina were assessed by Western blotting and immunofluorescence staining, followed by retinal ganglion cell (RGC) density detection. Additionally, electrophysiological examinations including photopic negative response (PhNR) was also performed.
RESULTS
The mice demonstrated an initial rapid decrease in cerebral blood flow, followed by a 4-week recovery period after BCAS. The ratio of retinal artery and vein was decreased under fundus photography and FFA. Compared with the sham mice, BCAS mice showed thinner retinal thickness on day 28. Additionally, apoptosis was increased and RGC density was decreased mainly in peripheral retinal region. Neurogliosis was mainly located in the inner retinal layers, with a stable increase in HIF-1α expression. The dark-adapted electroretinogram showed a notable reduction in the a-, b-, and oscillatory potential (OP) wave amplitudes between days 2 and 7; this gradually recovered over the following 4wk. However, the b- and OP-wave amplitudes were still significantly decreased on PhNR examination on day 28.
CONCLUSION
BCAS can result in relatively mild retinal ischemia injuries in mice, mainly in the inner layer and peripheral region. Our study provides a novel animal model for investigating retinal ischemic diseases.
Keywords: bilateral carotid artery stenosis, retinal ischemia, mice, cerebral hypoperfusion, ischemic injury
INTRODUCTION
The retina is a neural tissue that is metabolically active and susceptible to ischemic injury, which involves various pathogenic mechanisms, such as neuronal depolarization, ionic imbalance, and oxidative stress[1]. However, these mechanisms have yet to be fully comprehended. Retinal ischemia is a common causative factor of several retinal clinical diseases, including ischemic optic neuropathies, retinal artery or vein occlusion, retinal ischemia syndrome, glaucoma, and diabetic retinopathy, leading to irreversible visual disability[2]. Hence, the pathophysiology and molecular mechanisms of retinal ischaemia injury have been given more research attention in both human and animal models. Several human-generated and naturally occurring retinal ischemia models are generated mainly through intraocular pressure (IOP) elevation or the occlusion of retina-related arteries[2]. Introducing sterile fluid into the vitreous chamber to increase IOP, usually over 110 mm Hg, can block the blood supply to the retina in mice, and is widely used to study retinal ischemia-reperfusion injury, especially in acute angle-closure glaucoma[3]. Neural gliosis, retinal ganglion cell (RGC) apoptosis, and retinal inflammation are the major retinal degenerations observed in this model, with the advantages of being temporary, reversible, and easy to create and reproduce[4]. However, this model is not appropriate for studying retinal ischemic diseases that are not associated with high IOP or that present as chronic ischemic injuries, such as the ocular ischemic syndrome (OIS) or normal tension glaucoma (NTG).
Occlusion of retina-related arteries, such as the ophthalmic artery, middle cerebral artery, or common carotid artery, can directly reduce blood flow to retina without interference of IOP. Ophthalmic artery ligation can lead to severe retinal ischemic injury, including obvious visual dysfunction, thinning of the retina, and increased gliosis and apoptosis[5]. However, ophthalmic artery ligation is highly technically demanding due to the close anatomical proximity between the optic vessel and nerve, and easily leads to direct compression of the optic nerve axons[2]. Another well-accepted retinal ischemia model via vascular occlusion is the middle cerebral artery occlusion (MCAO)[6]–[7]. This model involves occlusion of the blood supply using a filament inserted through the external and common/internal carotid artery, then advanced into the middle cerebral artery[8]. In MCAO model, decreases of retinal function are transient, and morphological alterations in the retina are not detectable[9]. However, ischemic stress is evoked as hypoxia-inducible factor (HIF)-1α and heat shock protein (HSP) expressed in the RGC layer and gliosis activation in Müller cells[10]. As the degree of perfusion depends on the position of a filament which is difficult to control, the effect of the MCAO is unstable. Additionally, bilateral common carotid artery occlusion (BCCAO) was first induced in adult rats[11]. BCCAO can produce complex and delayed neuronal disorder in the retina; specifically, RGCs, neurons in the inner nuclear layer, and photoreceptors are damaged at one week, two months, and four months after BCCAO surgery, respectively[12]. However, the lack of posterior communicating arteries and severe cerebral hypoperfusion leads to a extremely high mortality rate in mice after BCCAO[13].
The bilateral carotid artery stenosis (BCAS) mouse model, based on the same principles as BCCAO and MCAO, was first proposed by Shibata et al[14] in 2004. The key modeling procedure of BCAS is rotating two microcoils made by piano wire around each common carotid artery, leading to chronic cerebral hypoperfusion with a relatively high survival rate[15]. As a result of improved modeling skills over the last five years, the BCAS has become widely used for studies of cerebral small vessel diseases[16]–[19]. Besides, recent studies have indicated that BCAS may also induce a decrease in retinal blood volume and impairment in visual function[17]–[18],[20]. However, the morphological and functional changes of retinal ischemia injuries in BCAS still remain unclear. Hence, our study mainly aimed to investigate the features of retinal ischemic injury in a BCAS model and to evaluate the usefulness of BCAS as a novel animal model for investigating retinal ischemic diseases.
MATERIALS AND METHODS
Ethical Approval
All animal experimental protocols were approved by the Institutional Animal Care and Use Committee at the Eye and ENT Hospital of Fudan University and were conducted in accordance with the guidelines of the Association for Research in Vision and Ophthalmology Statement and of the Animal Research: Reporting in vivo Experiments.
Animal
Male adult C57BL/6 mice aged 6-8wk were procured from Jiesijie Experimental Animals Co., Ltd. (Shanghai, China) and housed in a temperature-controlled living space with freely accessible food and water. Animals were randomized into BCAS and sham groups.
Bilateral Carotid Artery Stenosis Surgery
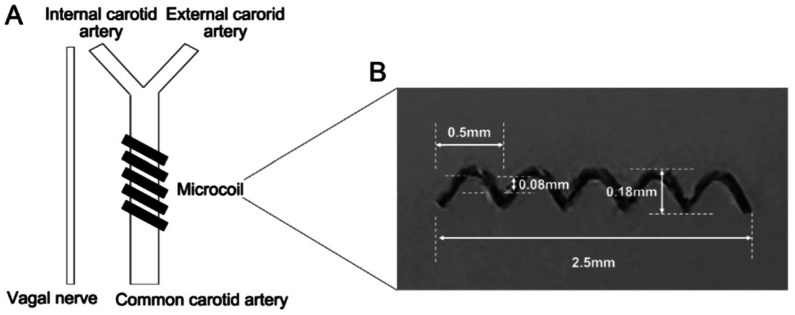
BCAS was induced according to a previously established protocol by Shibata et al[14]. Briefly, an incision was performed in the middle cervical line to expose both common carotid arteries, followed by applying microcoils (Sawane Spring, Wuxi SAMINI SPRING, Chian) with 0.18 mm internal diameter to both arteries (Figure 1). The same surgical procedure was performed in the sham group, except for microcoil placement. Laser Doppler imaging (moorLDI; Moor Instruments Ltd. UK) was utilized to monitor cerebral blood flow, and cerebral microperfusion was scanned repeatedly before and at 2, 7, and 28d following BCSA surgery. The results are presented as color-coded images and assessed in average cerebral perfusion units using moorLDI.
Figure 1. BCAS surgery.
A: Surgery diagram; B: Details of microcoil (material: SWP-A with gold plating, specifications: 0.08×0.18×0.5×2.5 mm, Wuxi SAMINI SPRING, China). BCAS: Bilateral carotid artery stenosis.
Fundus Photography and Fluorescein Fundus Angiography
Mice were anesthetized, and 1% tropicamide eye drops were used for pupil dilation before image acquisition at 2, 7, and 28d after BCSA surgery. A retinal imaging system (Optoprobe, OPTO-RIS, England) was used to capture the fundus images in vivo. The diameters of the major retinal artery and vein were measured and averaged at two optic disc radiators using the Image J software (v1.51 j8, USA) based on these fundus images, and the ratio of retinal artery and vein was calculated[21]. For fluorescein fundus angiography (FFA), 10% fluorescein sodium (A610203, Sangon Biotech., China) was injected into the retro-orbital sinus at a 0.05 mL/20 g concentration. The fundus image was obtained under the 488-nm excitation from a blue solid-state laser using Optoprobe. Based on the dynamics angiography of FFA, the time from the start of fluorescent stain injection to first appearance of retinal artery fill was recorded as retinal circulation time, the time from the first artery fill to the first vein fill was recorded as arterial filling time, and the time of all vein fills was recorded as venous filling time.
Histology
Mice from the two groups were euthanized using isoflurane anesthesia on postoperative day 28. The eyes were removed and fixed in 4% paraformaldehyde (Biosharp, Beijing, China) at 4°C for 24h. After dehydration and paraffin embedding, eyeballs were cut into 5-µm-thick sections and underwent hematoxylin-eosin (H&E) staining. Retinal images were captured using light microscopy (Olympus IX73, Japan). Retinal thickness values were measured and averaged at 200, 400, 800, and 1200 µm distances from the central optic nerve head on both sides.
Immunofluorescence Staining
The eyeballs from the sham and BCAS groups were dissected on postoperative day 28 and fixed in Fekete's solution overnight at 4°C. Subsequently, the eyeballs were dehydrated for 2 days at 4°C in a sucrose solution gradient of 20% and 30% and then embedded in an optimal cutting temperature compound. Using a freezing microtome (Leica, Nussloch, Germany), 10-µm-thick serial sections of eye tissue were cut and placed on adhesion microscope slides. Frozen sections were then blocked with 5% bovine serum albumin for 30min at approximately 25°C. To detect glial fibrillary acidic protein (GFAP), these sections were exposed to the primary antibody (1:2000, anti-GFAP, Abcam, ab7260, UK) overnight at 4°C and washed thrice with phosphate buffer saline (PBS). The sections were then incubated in darkness with secondary antibodies (1:1000, Alexa Fluor 488, ab150077, Abcam) and 4,6-diamidino-2-phenylindole (1:1500, C1002, Beyotime, China) for 2h. The One Step TUNEL Apoptosis Assay Kit (C1089-1, Beyotime) was performed to detect apoptotic cells according to the manufacturer's protocols. The sections were examined under a fluorescence microscope (Olympus IX73, Japan). The intensity of GFAP and counts of TUNEL-positive retinal cells in sham and BCAS groups under the same magnification and location were then detected by Image J software (v1.51 j8, USA).
Retinal Ganglion Cell Detection
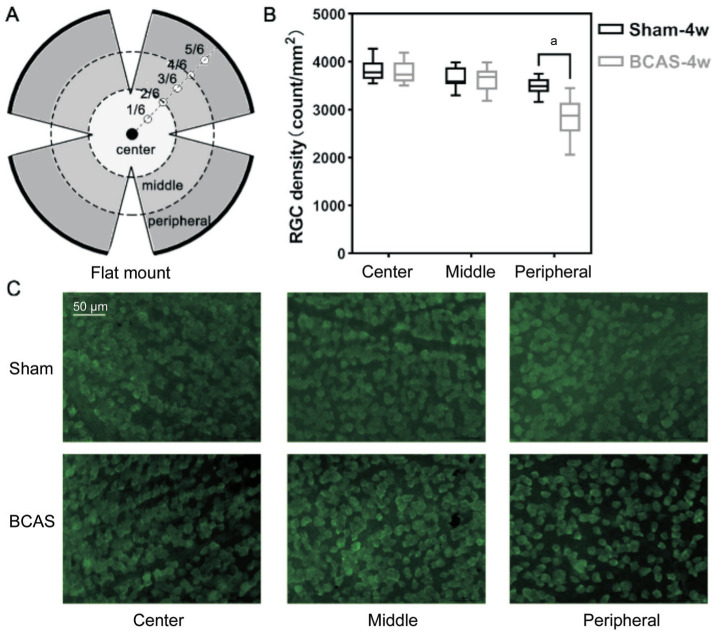
The retinas were gently resected on postoperative day 28 in the sham and BCAS groups and subsequently incubated with the primary antibody (antiRBPMS, ABN1362, Merck) overnight at 4°C. They were then diluted in PBS containing 0.3% Triton X-100 (Thermo Fisher Scientific, Canada) and 3% normal serum. After rinsing three times with PBS for 15min each time, the retinas were incubated with the secondary antibody (1:1000, Alexa Fluor 488, ab150077, Abcam) for 1.5h at approximately 25°C. Subsequently, the sections were washed thrice with PBS and examined under a fluorescence microscope (Olympus IX73, Japan) to visualize RGCs. RGC density was assessed at different distances from the central optic disc as the center (1/6), middle (3/6), and peripheral (5/6) retinal regions and subsequently quantified per unit area by computing mean cell counts (counts/mm2).
Western Blot
To obtain a detailed differential expression of proteins over the postoperative period, the retinas from the two surgery groups were dissected carefully at 2, 7, 14, and 28d postoperatively and then lysed on ice in redioimmunoprecipitation assay buffer (Sigma, USA) containing protease and phosphatase inhibitor cocktail (1:100, #5872, Cell Signaling Technology, USA). The protein lysates were resolved by electrophoresis of sodium dodecyl sulfate-polyacrylamide gel and electrotransferred onto the polyvinylidene difluoride membranes. Then 2% bovine serum albumin solution was used to block the membranes for 1h and the membranes were then incubated at 4°C for 24h with primary antibodies against HIF-1α (1:1000, AF1009, Affinity Biosciences, China), GFAP (1:5000, ab7260, Abcam), Bcl-2 (1:2000, 12789-1-AP, Proteintech, USA), caspase-3 (1:2000, ab184787, Abcam), and β-actin (1:2000, AF7018, Affinity Biosciences). After several washes, we incubated the membranes with horseradish peroxidase-conjugated secondary antibodies (1:1000, S001, Affinity Biosciences) at approximately 25°C for 1.5h. An enhanced chemiluminescence substrate kit (Femto-sig ECL, 180-506, Tanon, China) and an imaging system (JS-M6, P&Q Science & Technology, China) were used to visualize the protein. Image J software (v1.51 j8, USA) was utilized for the densitometric analysis of the bands.
Electroretinogram and PhNR Testing
Animals in the BCAS group were dark adapted for over 4h, and pupils were fully dilated using tropicamide drops. Two contacting electrodes were fixed on each cornea with a 2.5% hypromellose lubricating gel to keep it moist after anesthetization. Subcutaneous needle electrodes were used as reference electrodes. Full-field electroretinograms (ERGs) were performed at 2, 7, and 28d after BCAS with the ESPION system (Diagnosis LLC, Lowell, MA, USA) at flash intensities ranging from 0.01 to 3.0 cd per second/m2. Meanwhile, photopic negative response (PhNR) testing was performed at 10.0 cd per second/m2 at 28d postoperatively. The main parameters were recorded as amplitudes of a-waves, b-waves, OP-waves, and PhNR waves and averaged for each mouse.
Statistical Analysis
Two normally distributed sham and BCAS groups were compared using Student's t-tests, and data within the group from different times postoperatively were analyzed using a one-way analysis of variance. The data were shown as mean±standard deviation (SD) for continuous variables. All statistical analyses were performed by SPSS (v25.0, IBM Corp, USA). A P-value of less than 0.05 was considered to indicate statistically significant differences.
RESULTS
Brain Blood Flow Changes in BCAS Mice
The microcoils were successfully implanted in each mouse. Compared with the preoperative values, the cerebral blood flow was reduced to 74.1% (P<0.01), 82.3% (P<0.05), and 93.8% (P>0.05) on postoperative days 2, 7, and 28 in the BCAS group (Figure 2). No animal died during the 4-week study period, and only one mouse had cerebral blood flow that returned to the preoperative level at week 4 after surgery.
Figure 2. Cerebral blood flow changes after BCAS surgery.
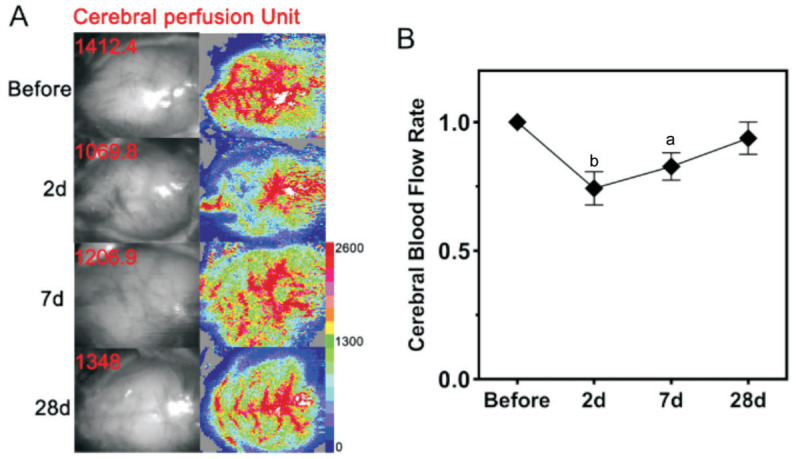
A: Cranium scanning in C57BL/6J mice via laser Doppler imaging before and at 2, 7, and 28d after BCAS; B: Cerebral blood flow rate (average postoperative perfusion unit/preoperative perfusion unit×100%) before and at 2, 7, and 28d after BCAS. n=5. aP<0.05, bP<0.01 vs preoperatively using one-way analysis of variance. BCAS: Bilateral carotid artery stenosis.
Morphological Changes in Retinal Vasculature and FFA in BCAS Mice
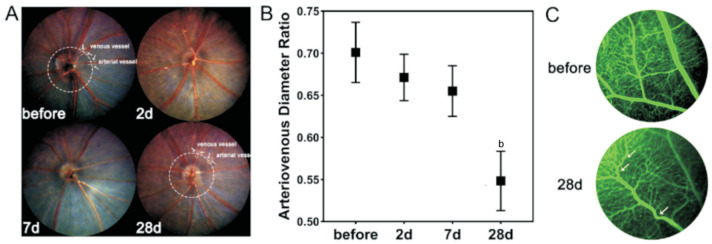
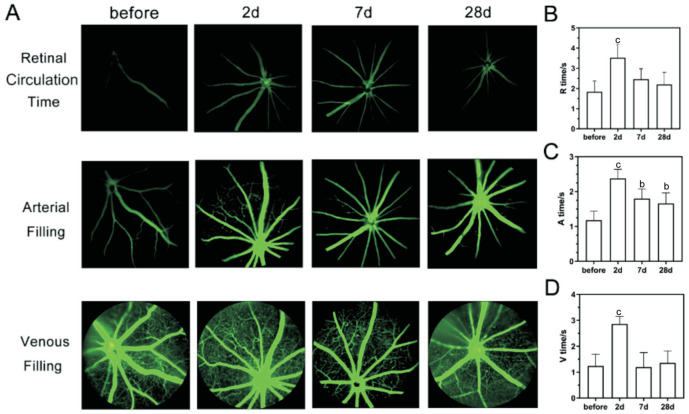
Fundus photography revealed that the retinal arteries of mice were gradually narrowed after BCAS, leading to a continuous decrease in the ratio of retinal artery and vein, with a significant difference between the 4th week and the preoperative period (from 0.70 to 0.55, P<0.01; Figure 3A, 3B). Additionally, no obvious signs of severe retinal ischaemia were observed in BCAS by FFA, such as perfusion zones, fluorescence leakage, or neovascularization, but noticeable tortuous retinal veins in the peripheral retinal area were detected on postoperative day 28 (Figure 3C). As for the retinal perfusion in BCAS by FFA (Figure 4A), the retinal circulation time was significantly prolonged on postoperative day 2 (3.52±0.66s, P<0.001) compared to preoperatively (1.84±0.53s), but gradually recovered on 7d (2.46±0.51s, P>0.05) and 28d (2.20±0.83s, P>0.05; Figure 4B). Besides, the arterial filling time was significantly prolonged on all postoperative day 2, 14, and 28 (2.38±0.28, 1.80±0.27, 1.66±0.40s, P<0.05) compared to before BCAS (1.18±0.25s; Figure 4C). In addition, there was no significant difference in venous filling time on postoperative day 7 (1.20±0.56s, P>0.05) and day 28 (1.36±0.46s, P>0.05) compared with those preoperatively (1.24±0.45s), except for day 2 (2.86±0.30s, P<0.001; Figure 4D).
Figure 3. Morphological changes of retinal vasculature in BCAS.
A: Fundus images before and at 2, 7, and 28d after BCAS, and diameters measuring of retinal artery and vein; B: The ratio of retinal artery and vein before and on 2, 7, and 28d after BCAS; n=5, bP<0.01 vs preoperatively using one-way analysis of variance; C: Tortuous retinal veins (white arrow) in the peripheral retinal region before and on 28d after BCAS under FFA. BCAS: Bilateral carotid artery stenosis; FFA: Fluorescein fundus angiography.
Figure 4. FFA in BCAS.
A: FFA images at retinal circulation time, arterial filling time, and venous filling time before and at 2, 7, and 28d after BCAS; B: The retinal circulation time (R time), arterial filling time (A time), and venous filling time (V time) before and on 2, 7, and 28d after BCAS; n=5, bP<0.01, cP<0.001 vs preoperatively using one-way analysis of variance. BCAS: Bilateral carotid artery stenosis; FFA: Fluorescein fundus angiography.
H&E and Fluorescence Staining of the Retina
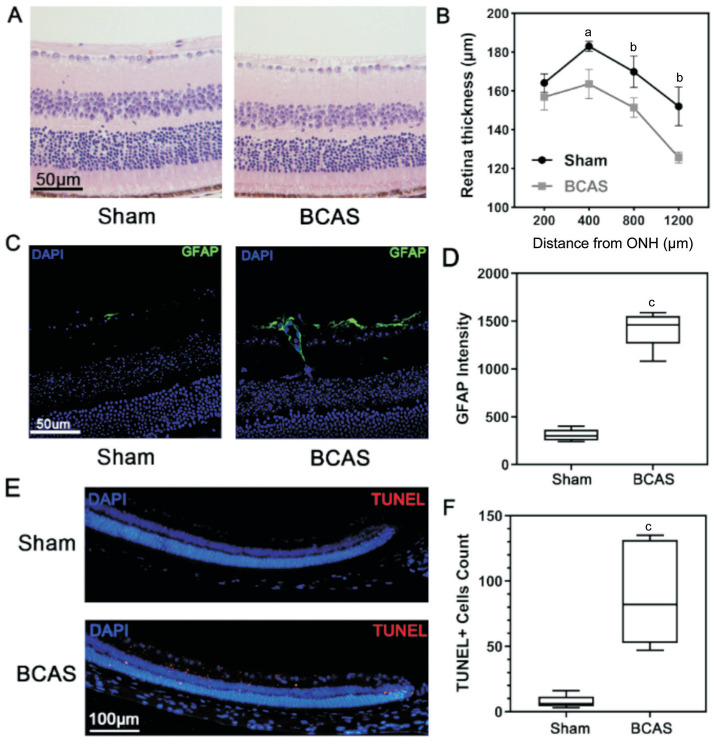
H&E staining showed a significant difference in retinal thickness between the BCAS and sham groups on postoperative day 28. The values measured at distances of 400, 800, and 1200 µm in the BCAS group were 163.6±7.5, 151.4±5.0, and 125.7±2.8 µm, thinner as 10.6% (P<0.05), 11.0% (P<0.01), and 17.3% (P<0.01) compared with the sham group, respectively (Figure 5A, 5B). However, no remarkable morphological changes were found in different layers of retinal tissue. Glial hyperplasia of the retina was observed by fluorescence staining in the BCAS group (Figure 5C, 5D). Besides, increased signs of apoptosis in the peripheral retinal area, mainly in the inner layer, were also noted (Figure 5E, 5F).
Figure 5. H&E and immunofluorescence staining of the retina.
A: H&E staining of the retina from sham and BCAS mice after 28d at a distance of 400 µm from the ONH; scale bar, 50 µm; B: Retinal thickness on postoperative day 28; n=5 in each group, aP<0.05, bP<0.01 between the sham and BCAS group (Student's t-test); C: GFAP immunofluorescence stain in retina (blue: DAPI; green: GFAP) on postoperative day 28; scale bar, 50 µm; D: GFAP intensity on postoperative day 28; n=5 in each group, cP<0.001 between the sham and BCAS group (Student's t-test); E: Apoptosis assay in peripheral retina (blue: DAPI; red: TUNEL) of sham and BCAS on postoperative day 28; scale bar, 100 µm; F: TUNEL-positive cells count in peripheral retina; n=5 in each group, cP<0.001 between the sham and BCAS group (Student's t-test). H&E: Hematoxylin-eosin; BCAS: Bilateral carotid artery stenosis; ONH: Optic nerve head; GFAP: Glial fibrillary acidic protein.
Retina Ganglion Cell Density
The results indicated that the average RGC density in the central, middle, and peripheral retinal regions (Figure 6A) were 3850±246, 3665±237, and 3485±195/mm2, respectively, in the sham group, and 3779±245, 3631±272, and 2836±459/mm2, respectively, in the BCAS group. Notably, RGC density in the peripheral region was lower by 18.6% (P<0.05) in the BCAS group, while no significant differences were found in the central and middle retinal regions (P>0.05; Figure 6B, 6C).
Figure 6. RGC density.
A: The flat mount of the retina and three regional subdivisions (center, middle, and peripheral); B: RGC density in the three regions on postoperative day 28; n=5 in each group, aP<0.05 between the sham group and BCAS group (Student's t-test); C: Anti-RBPMS (green) staining of three retinal regions in the sham and BCAS mice on postoperative day 28; scale bar, 50 µm. RGC: Retinal ganglion cell; BCAS: Bilateral carotid artery stenosis.
Western Blot
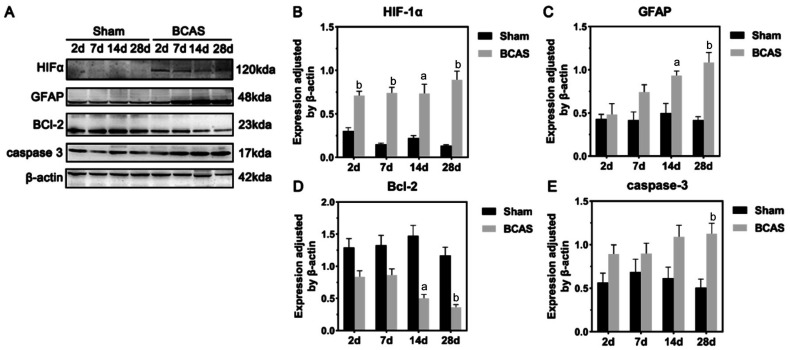
The general results of Western blot of retina in the sham and BCAS groups were shown in Figure 7. HIF-1α protein expression levels in the retina were significantly incresed in BCAS on postoperative days 2, 7, 14, and 28 (P<0.01, P<0.01, P<0.05, P<0.01, respectively; Figure 7B). Significant increases in GFAP protein expression were observed in the BCAS group during the 4-week postoperative period compared to the sham group (2wk: P<0.05; 4wk: P<0.01; Figure 7C). Besides, expression of Bcl-2 was significantly lower in the BCAS group at both the 2nd (P<0.01) and 4th (P<0.01) weeks postoperatively (Figure 7D). In contrast, cleaved caspase-3 expression differed between the two groups only on postoperatively days 28 (P<0.01; Figure 7E).
Figure 7. Western blot of retina samples from sham and BCAS mice.
A: Differential expression of HIF-1α, GFAP, Bcl-2, caspase-3, and β-actin in the retina of sham and BCAS mice after 2, 7, and 28d; B-E: Quantitative analysis of the expressions of HIF-1α, GFAP, BCL-2, and caspase-3 normalized according to β-actin expression at postoperative days 2, 7, 14, and 28; n=5 in each group, aP<0.05, bP<0.01 between the sham group and the BCAS group (Student's t-test). BCAS: Bilateral carotid artery stenosis; HIF: Hypoxia-inducible factor; GFAP: Glial fibrillary acidic protein.
Electrophysiological Changes of Retina in BCAS
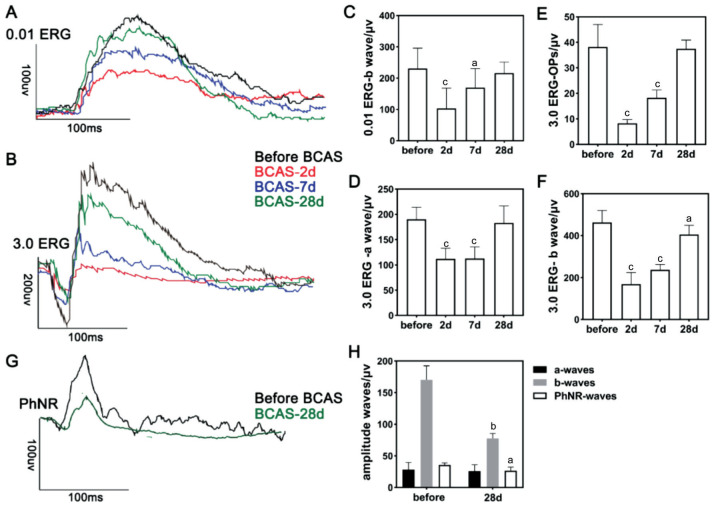
In the 0.01 ERG program (Figure 8), preoperative testing showed an average b-wave amplitude of 228.6±66.7 µV in the BCAS. However, on postoperative days 2 and 7, the average amplitude of the b-wave significantly decreased to 77.3±28.0 µV (P<0.001) and 175.2±44.0 µV (P<0.05), respectively. No significant difference was observed in the values at the 4th week postoperatively compared with those preoperatively (Figure 8C). The a-wave amplitude was also not significantly different throughout the 4wk. In the 3.0 ERG program (Figure 8B), preoperative testing indicated that the average amplitudes were 190.0±24.0, 462.8±57.3, and 32.14±8.8 µV in the a-wave, b-wave, and OP wave, respectively. On postoperative days 2, 7, and 28, the average a-wave amplitude decreased to 111.7±22.7 µV (P<0.001), 113.0±21.3 µV (P<0.001), and 182.8±33.1 µV (P>0.05), respectively (Figure 8D). Meanwhile, the average b-wave amplitudes were decreased to 172.9±59.0 µV (P<0.001), 226.1±40.1 µV (P<0.001), and 405.6±44.4 µV (P<0.05), respectively (Figure 8F). The average OP wave amplitudes were significantly decreased after 2d and 2wk but not at 4wk postoperatively, measuring as 8.3±1.5 µV (P<0.001), 18.3±3.0 µV (P<0.001), and 37.5±3.3 µV (P>0.05), respectively (Figure 8E). Additionally, on postoperative day 28 compared to before BCAS (Figure 8G, 8H), the b-wave amplitudes decreased from 170.3±22.1 to 77.8±7.7 µV (P<0.01), and the PhNR wave decreased from 35.7±3.3 to 26.8±5.4 µV (P<0.05).
Figure 8. ERG and PhNR examination of BCAS mice.
A-B: ERG examinations at 0.01 and 3.0 programs preoperatively and on postoperative days 2, 7, and 28 after BCAS; C-F: The amplitudes of b, a, and OP waves under 0.01 and 3.0 ERG programs before and at postoperative days 2, 7, and 28 after BCAS, n=10 in each group, aP<0.05, cP<0.001 vs preoperatively using one-way analysis of variance; G: The PhNR test in sham and BCAS mice on postoperative day 28; H: The amplitudes of a, b, and PhNR waves in sham and BCAS mice on postoperative day 28, n=5 in each group, aP<0.05, bP<0.01 between the sham group and the BCAS group (Student's t-test). ERG: Electroretinograms; PhNR: Photopic negative response; BCAS: Bilateral carotid artery stenosis; OP: Oscillatory potential.
DISCUSSION
Our study is the first to systematically summarize and demonstrate retinal ischemic injury of BCAS mouse model by detecting retinal ischemic morphological and functional changes without being induced by elevated IOP. According to a previous study, the mortality rate of MCAO at 4-month in mice ranges from 5% to 44%, whereas that of BCCAO mice reaches 100% at 2h postoperatively[13],[22]. In our study, one mouse died due to overtraction of the vagus nerve during BCAS operation, and the overall mortality rate of BCAS was approximately 10% at 4wk postoperatively, which was obviously superior to MCAO and BCCAO mice. Eyelid ptosis, or the disappearance of pupillary reflexes to light in the operated eye, can occur in retinal ischemic models with complete vascular occlusion, such as BCCAO[13],[23]. However, our study did not observe these signs, suggesting that the overall degree of retinal blood flow hypoperfusion after BCAS in mice was relatively mild and well tolerated. Our study indicates that the BCAS model might be optional for studying non-high IOP related retinal ischemic diseases.
In previous studies, induction in BCAS using a microcoil with 0.18 mm inner diameter resulted in an initial acute reduction in cerebral blood flow of 30%–40%, which then recovered to approximately 85% of the preoperative level within 1–3mo[14],[17]. Similar results using the same microcoil size were obtained in the current study with a relatively faster cerebral blood flow recovery. This is possibly due to the variable amounts of retrograde flow recruitment and posterior communicating artery variation in different individuals, according to a previous study[18]. Further, a significant decrease in the retinal arteriovenous ratio were observed 28d after BCAS in our study, which is a sign of hypoperfusion in the retinal ischemia model[24]. Although we did not find obvious vascular signs of retinal ischaemia, the tortuosity of small blood vessels in the retina may be an indirect sign of whole-brain hypoperfusion. As the eye is considered an extension of the central nervous system[25], retinal vascular changes (such as venular caliber and arteriolar fractal dimensions[26]) are highly correlated with cerebral vascular diseases, especially small vessel ischemic disease mimicked by BCAS[27]–[28]. Thus, BCAS might be an effective method for further investigating and better understanding the interactions of retinal and cerebral ischemia. Additionally, it is necessary to extend the observation time of the model appropriately and incorporate the detection of additional vascular-related molecules, such as vascular endothelial growth factor, in order to further enhance our understanding of retinal vascular changes and homeostasis under hypoperfusion status in our subsequent study of BCAS.
Although direct quantification of retinal blood flow in mice is currently difficult, FFA can help us assess the state of retinal circulation. Our FFA examination showed that the retinal circulation time was significantly prolonged at 2d postoperatively, but gradually recovered at 7 and 28d. This is basically consistent with the results of cerebral blood flow after BCAS, which may be related to the recovery of collateral circulation. Besides, the prolongation of arterial and venous filling time also indicated decreased retinal blood perfusion after BCAS. In fact, the prolongation of the arm-to-retina circulation time is one of the most important and specific diagnostic criteria for OIS, which is primarily caused by severe plaques and stenosis in the carotid artery[29]. Thus, our findings suggest that BCAS may be an ideal animal model for the study of OIS.
Morphological investigations in numerous models of retinal ischemia have revealed an obvious decrease in retinal thickness[7],[30], which is consistent with our results after BCAS. However, the retinal ischemia injury of BCAS might also be slight because no severe morphological changes in the retina were detected in our study at 4wk. The RGCs were reduced by almost 20% only in the peripheral retina at 4wk postoperatively, which was less severe than that observed in other retinal ischemia models[31]–[33]. Damage to RGCs, mainly in the peripheral retina, has been reported in several studies, usually in some chronic elevated IOP models[34]–[36]. Our findings indicate that peripheral RGCs are more sensitive to blood hypoperfusion than those in the central or middle region, and that the hypoperfusion might also involve in the peripheral RGCs death during chronic IOP elevation in past studies. In addition, it was also consistent with the results of apoptosis assays conducted on retinal sections on postoperative day 28. We speculated that this phenomenon might be induced not only by the external carotid artery retrograde flow recruitment for the central region[18], but also by the presence of pericyte-induced “no-reflow” in the peripheral retina area after early ischemia[37]–[38]. Previous studies have shown that NTG is more likely to be caused by ischaemia, rather than a high IOP[39]–[40]. Therefore, our findings indicate that BCAS may be also useful for investigating the pathological mechanisms of NTG.
Ischemia in neural tissues commonly results in the activation and proliferation of glial cells[41]. In our study, the western blot assay confirmed a cumulative increase in the levels of the GFAP protein, a glial marker, in the retina 28d after BCAS. Evaluation of immunofluorescent sections also indicated that glial activation was limited within the inner layer of the retina. Further, it was milder than that in traditional models of retinal ischemia-reperfusion injury, in which gliosis was observed in multiple retinal layers[4],[42]. HIF-1α is a key regulator of the up-regulation of hypoxia-responsive genes, and detection of HIF-1α can help us determine the occurrence and durations of hypoperfusion states in tissues[43]–[44]. Protein expression of HIF-1α in the retina was maintained at high levels for at least 4wk after BCAS. In contrast, HIF-1α was only detectable within the initial 24h in a previous model of acute retinal ischemia[13]. We hypothesized that the retina under BCAS experienced a low level of chronic hypoperfusion within 7d after early ischemia, which lasted for at least 4wk. Importantly, BCAS resulted in persistent chronic apoptosis that appeared after ≥2wk, during which apoptosis-related proteins Bcl-2 and caspase-3 were also significantly altered in the expression levels.
The results of the ERG test exhibited a significant decline in the amplitude of a-waves and b-waves under the 3.0 program and that of b-waves under the 0.01 program during the early postoperative period (postoperative days 2 and 7). These findings indicate the compromised functions of photoreceptors, Müller cells, and bipolar cells during the initial acute hypoperfusion in BCAS. Although the origin of OPs has not yet been established, our study's decreased OP wave amplitudes may indicate dysfunction of bipolar and amacrine cells in BCAS[45]–[46]. These early electrophysiological decreases were followed by a gradual recovery, consistent with the recovery of cerebral blood flow over the next weeks. The initial transient retinal deficits and subsequent functional recovery may be associated with the degree of extracellular glutamate and glutamine synthetase according to a previous study[9], and further research is needed. The significant decrease in b-wave amplitude after 28d was observed only under the 3.0 ERG program, indicating inner retinal injury from early ischemic damage[42]. In addition, no significant differences were found in the amplitudes of the a-wave and PhNR waves at week 4. The decreased amplitudes of b-wave and PhNR indicated relatively inactive electrical activity of ON- and OFF-cone bipolar cells and the RGC layer[47], confirming the mild injury to the RGCs. However, ERG can only assess electrophysiological changes of the ischemic retina in BCAS, whereas there may be hypoperfusion injury in the entire visual pathway. Thus, more methods are needed to evaluate the neurological changes in combined eye-brain ischemia, such as the visual evoked potential test.
One limitation of our study was that we could not determine whether the retinal ischemic injury was due to early acute blood decline or chronic mild ischemia. It is also a concern of studying cerebral neuronal dysfunction in BCAS[18]. A deeper investigation of detailed dynamic changes in retinal hemodynamics of BCAS is needed for the selection of appropriate time window to investigate retinal ischemia injury, possibly different from the 28d applied in this study. In addition, previous studies have indicated chronic ischemic changes in white matter and optic tracts in BCAS[17],[48]; however, it is still unknown whether the pathological changes in the BCAS retina are associated with or affected by ischemic injury from the central nervous system and further research is required. In fact, evaluating cerebral functions via visual function test is commonly conducted in past cerebral ischaemia studies using BCAS models, which also needs to be re-considered. Additionally, although our study demonstrates the functional and morphological alterations of retinal ischemia injury in the BCAS, further investigation of the specific molecular mechanisms and pathological processes involved still needs to be conducted, which is the focus of our subsequent research.
In conclusion, a mild retinal ischemia injury was observed after BCAS, and it could be a novel useful mice model for investigating retinal ischemic diseases. Besides, the BCAS model might help us better understand the pathological processes in both ocular and cerebral neurological ischemia.
Footnotes
Authors' contributions: Shu L performed the literature search, experiment, and data acquisition; Zhang YJ contributed to analysis and manuscript preparation; Chen XX performed manuscript editing and helped perform the analysis with constructive discussions; Sun XH contributed to the conception and design of the study.
Foundations: Supported by The State Key Program of the National Natural Science Foundation of China (No.82030027); the National Natural Science Foundation of China (No.82101123).
Conflicts of Interest: Shu L, None; Zhang YJ, None; Chen XX, None; Sun XH, None.
REFERENCES
- 1.Osborne NN, Casson RJ, Wood JP, Chidlow G, Graham M, Melena J. Retinal ischemia: mechanisms of damage and potential therapeutic strategies. Prog Retin Eye Res. 2004;23(1):91–147. doi: 10.1016/j.preteyeres.2003.12.001. [DOI] [PubMed] [Google Scholar]
- 2.D'Onofrio PM, Koeberle PD. What can we learn about stroke from retinal ischemia models? Acta Pharmacol Sin. 2013;34(1):91–103. doi: 10.1038/aps.2012.165. [DOI] [PMC free article] [PubMed] [Google Scholar]
- 3.Souza Monteiro de Araújo D, De Logu F, Adembri C, Rizzo S, Janal MN, Landini L, Magi A, Mattei G, Cini N, Pandolfo P, Geppetti P, Nassini R, Calaza KDC. TRPA1 mediates damage of the retina induced by ischemia and reperfusion in mice. Cell Death Dis. 2020;11(8):633. doi: 10.1038/s41419-020-02863-6. [DOI] [PMC free article] [PubMed] [Google Scholar]
- 4.Luo H, Zhuang J, Hu P, Ye W, Chen S, Pang Y, Li N, Deng C, Zhang X. Resveratrol delays retinal ganglion cell loss and attenuates gliosis-related inflammation from ischemia-reperfusion injury. Invest Ophthalmol Vis Sci. 2018;59(10):3879–3888. doi: 10.1167/iovs.18-23806. [DOI] [PubMed] [Google Scholar]
- 5.Zhang X, Cheng M, Chintala SK. Optic nerve ligation leads to astrocyte-associated matrix metalloproteinase-9 induction in the mouse retina. Neurosci Lett. 2004;356(2):140–144. doi: 10.1016/j.neulet.2003.10.084. [DOI] [PubMed] [Google Scholar]
- 6.Prasad SS, Kojic L, Wen YH, Chen Z, Xiong W, Jia W, Cynader MS. Retinal gene expression after central retinal artery ligation: effects of ischemia and reperfusion. Invest Ophthalmol Vis Sci. 2010;51(12):6207–6219. doi: 10.1167/iovs.10-5632. [DOI] [PubMed] [Google Scholar]
- 7.Matei N, Leahy S, Blair NP, Shahidi M. Assessment of retinal oxygen metabolism, visual function, thickness and degeneration markers after variable ischemia/reperfusion in rats. Exp Eye Res. 2021;213:108838. doi: 10.1016/j.exer.2021.108838. [DOI] [PMC free article] [PubMed] [Google Scholar]
- 8.Minhas G, Morishita R, Anand A. Preclinical models to investigate retinal ischemia: advances and drawbacks. Front Neurol. 2012;3:75. doi: 10.3389/fneur.2012.00075. [DOI] [PMC free article] [PubMed] [Google Scholar]
- 9.Allen RS, Sayeed I, Cale HA, Morrison KC, Boatright JH, Pardue MT, Stein DG. Severity of middle cerebral artery occlusion determines retinal deficits in rats. Exp Neurol. 2014;254:206–215. doi: 10.1016/j.expneurol.2014.02.005. [DOI] [PMC free article] [PubMed] [Google Scholar]
- 10.Kalesnykas G, Tuulos T, Uusitalo H, Jolkkonen J. Neurodegeneration and cellular stress in the retina and optic nerve in rat cerebral ischemia and hypoperfusion models. Neuroscience. 2008;155(3):937–947. doi: 10.1016/j.neuroscience.2008.06.038. [DOI] [PubMed] [Google Scholar]
- 11.Block F, Schwarz M, Sontag KH. Retinal ischemia induced by occlusion of both common carotid arteries in rats as demonstrated by electroretinography. Neurosci Lett. 1992;144(1-2):124–126. doi: 10.1016/0304-3940(92)90731-l. [DOI] [PubMed] [Google Scholar]
- 12.Yamamoto H, Schmidt-Kastner R, Hamasaki DI, Yamamoto H, Parel JM. Complex neurodegeneration in retina following moderate ischemia induced by bilateral common carotid artery occlusion in Wistar rats. Exp Eye Res. 2006;82(5):767–779. doi: 10.1016/j.exer.2005.09.019. [DOI] [PubMed] [Google Scholar]
- 13.Lee D, Kang H, Yoon KY, Chang YY, Song HB. A mouse model of retinal hypoperfusion injury induced by unilateral common carotid artery occlusion. Exp Eye Res. 2020;201:108275. doi: 10.1016/j.exer.2020.108275. [DOI] [PubMed] [Google Scholar]
- 14.Shibata M, Ohtani R, Ihara M, Tomimoto H. White matter lesions and glial activation in a novel mouse model of chronic cerebral hypoperfusion. Stroke. 2004;35(11):2598–2603. doi: 10.1161/01.STR.0000143725.19053.60. [DOI] [PubMed] [Google Scholar]
- 15.Dinh QN, Arumugam T. The bilateral carotid artery stenosis (BCAS) model of vascular dementia. Methods Mol Biol. 2024;2746:67–72. doi: 10.1007/978-1-0716-3585-8_5. [DOI] [PubMed] [Google Scholar]
- 16.Tuo QZ, Zou JJ, Lei P. Rodent models of vascular cognitive impairment. J Mol Neurosci. 2021;71(5):1–12. doi: 10.1007/s12031-020-01733-2. [DOI] [PubMed] [Google Scholar]
- 17.Ishikawa H, Shindo A, Mizutani A, Tomimoto H, Lo EH, Arai K. A brief overview of a mouse model of cerebral hypoperfusion by bilateral carotid artery stenosis. J Cereb Blood Flow Metab. 2023;43(2_suppl):18–36. doi: 10.1177/0271678X231154597. [DOI] [PMC free article] [PubMed] [Google Scholar]
- 18.Foddis M, Winek K, Bentele K, Mueller S, Blumenau S, Reichhart N N, Crespo-Garcia S, Harnett D, Ivanov A, Meisel A, Joussen A, Strauss O, Beule D, Dirnagl U, Sassi C. An exploratory investigation of brain collateral circulation plasticity after cerebral ischemia in two experimental C57BL/6 mouse models. J Cereb Blood Flow Metab. 2020;40(2):276–287. doi: 10.1177/0271678X19827251. [DOI] [PMC free article] [PubMed] [Google Scholar]
- 19.Fraga E, Medina V, Cuartero MI, García-Culebras A, Bravo-Ferrer I, Hernández-Jiménez M, Garcia-Segura JM, Hurtado O, Pradillo JM, Lizasoain I, Moro MÁ. Defective hippocampal neurogenesis underlies cognitive impairment by carotid stenosis-induced cerebral hypoperfusion in mice. Front Cell Neurosci. 2023;17:1219847. doi: 10.3389/fncel.2023.1219847. [DOI] [PMC free article] [PubMed] [Google Scholar]
- 20.Li BQ, Leng J, Şencan-Eğilmez I, Takase H, Ali H, Alfadhel M, Fu BY, Shahidi M, Lo EH, Arai K, Sakadžić S. Differential reductions in the capillary red-blood-cell flux between retina and brain under chronic global hypoperfusion. Neurophotonics. 2023;10(3):035001. doi: 10.1117/1.NPh.10.3.035001. [DOI] [PMC free article] [PubMed] [Google Scholar]
- 21.Wang Y, Wang XL, Xie GL, Li HY, Wang YL. Collapsin response mediator protein-2-induced retinal ischemic injury in a novel mice model of ocular ischemia syndrome. Chin Med J. 2017;130(11):1342–1351. doi: 10.4103/0366-6999.206340. [DOI] [PMC free article] [PubMed] [Google Scholar]
- 22.Li Y, Tan L, Yang CX, He LY, Liu L, Deng BW, Liu SJ, Guo JL. Distinctions between the Koizumi and zea longa methods for middle cerebral artery occlusion (MCAO) model: a systematic review and meta-analysis of rodent data. Sci Rep. 2023;13(1):10247. doi: 10.1038/s41598-023-37187-w. [DOI] [PMC free article] [PubMed] [Google Scholar]
- 23.Davidson CM, Pappas BA, Stevens WD, Fortin T, Bennett SA. Chronic cerebral hypoperfusion: loss of pupillary reflex, visual impairment and retinal neurodegeneration. Brain Res. 2000;859(1):96–103. doi: 10.1016/s0006-8993(00)01937-5. [DOI] [PubMed] [Google Scholar]
- 24.Qin YL, Ji MQ, Deng TT, Luo D, Zi YX, Pan L, Wang ZJ, Jin M. Functional and morphologic study of retinal hypoperfusion injury induced by bilateral common carotid artery occlusion in rats. Sci Rep. 2019;9(1):80. doi: 10.1038/s41598-018-36400-5. [DOI] [PMC free article] [PubMed] [Google Scholar]
- 25.Marchesi N, Fahmideh F, Boschi F, Pascale A, Barbieri A. Ocular neurodegenerative diseases: interconnection between retina and cortical areas. Cells. 2021;10(9):2394. doi: 10.3390/cells10092394. [DOI] [PMC free article] [PubMed] [Google Scholar]
- 26.Hilal S, Ong YT, Cheung CY, Tan CS, Venketasubramanian N, Niessen WJ, Vrooman H, Anuar AR, Chew M, Chen C, Wong TY, Ikram MK. Microvascular network alterations in retina of subjects with cerebral small vessel disease. Neurosci Lett. 2014;577:95–100. doi: 10.1016/j.neulet.2014.06.024. [DOI] [PubMed] [Google Scholar]
- 27.Rim TH, Teo AWJ, Yang HHS, Cheung CY, Wong TY. Retinal vascular signs and cerebrovascular diseases. J Neuro Ophthalmol. 2020;40(1):44–59. doi: 10.1097/WNO.0000000000000888. [DOI] [PubMed] [Google Scholar]
- 28.Moss HE. Retinal vascular changes are a marker for cerebral vascular diseases. Curr Neurol Neurosci Rep. 2015;15(7):40. doi: 10.1007/s11910-015-0561-1. [DOI] [PMC free article] [PubMed] [Google Scholar]
- 29.Sood G, Siddik AB. StatPearls. Treasure Island (FL): StatPearls Publishing; 2024. Ocular ischemic syndrome. 2023. [PubMed] [Google Scholar]
- 30.Lee D, Tomita Y, Yang LZ, Negishi K, Kurihara T. Ocular ischemic syndrome and its related experimental models. Int J Mol Sci. 2022;23(9):5249. doi: 10.3390/ijms23095249. [DOI] [PMC free article] [PubMed] [Google Scholar]
- 31.Shabanzadeh AP, D'Onofrio PM, Monnier PP, Koeberle PD. Neurosurgical modeling of retinal ischemia-reperfusion injury. J Stroke Cerebrovasc Dis. 2018;27(4):845–856. doi: 10.1016/j.jstrokecerebrovasdis.2017.10.019. [DOI] [PubMed] [Google Scholar]
- 32.Trost A, Motloch K, Bruckner D, Schroedl F, Bogner B, Kaser-Eichberger A, Runge C, Strohmaier C, Klein B, Aigner L, Reitsamer HA. Time-dependent retinal ganglion cell loss, microglial activation and blood-retina-barrier tightness in an acute model of ocular hypertension. Exp Eye Res. 2015;136:59–71. doi: 10.1016/j.exer.2015.05.010. [DOI] [PubMed] [Google Scholar]
- 33.Ritzel RM, Pan SJ, Verma R, Wizeman J, Crapser J, Patel AR, Lieberman R, Mohan R, McCullough LD. Early retinal inflammatory biomarkers in the middle cerebral artery occlusion model of ischemic stroke. Mol Vis. 2016;22:575–588. [PMC free article] [PubMed] [Google Scholar]
- 34.Ficarrotta KR, Mohamed YH, Passaglia CL. Experimental glaucoma model with controllable intraocular pressure history. Sci Rep. 2020;10(1):126. doi: 10.1038/s41598-019-57022-5. [DOI] [PMC free article] [PubMed] [Google Scholar]
- 35.Urcola JH, Hernández M, Vecino E. Three experimental glaucoma models in rats: comparison of the effects of intraocular pressure elevation on retinal ganglion cell size and death. Exp Eye Res. 2006;83(2):429–437. doi: 10.1016/j.exer.2006.01.025. [DOI] [PubMed] [Google Scholar]
- 36.Mukai R, Park DH, Okunuki Y, Hasegawa E, Klokman G, Kim CB, Krishnan A, Gregory-Ksander M, Husain D, Miller JW, Connor KM. Mouse model of ocular hypertension with retinal ganglion cell degeneration. PLoS One. 2019;14(1):e0208713. doi: 10.1371/journal.pone.0208713. [DOI] [PMC free article] [PubMed] [Google Scholar]
- 37.Alarcon-Martinez L, Yilmaz-Ozcan S, Yemisci M, Schallek J, Kılıç K, Villafranca-Baughman D, Can A, Di Polo A, Dalkara T. Retinal ischemia induces α-SMA-mediated capillary pericyte contraction coincident with perivascular glycogen depletion. Acta Neuropathol Commun. 2019;7(1):134. doi: 10.1186/s40478-019-0761-z. [DOI] [PMC free article] [PubMed] [Google Scholar]
- 38.O'Farrell FM, Mastitskaya S, Hammond-Haley M, Freitas F, Wah WR, Attwell D. Capillary pericytes mediate coronary no-reflow after myocardial ischaemia. eLife. 2017;6:e29280. doi: 10.7554/eLife.29280. [DOI] [PMC free article] [PubMed] [Google Scholar]
- 39.Lešták J, Pitrová Š, Nutterová E, Bartošová L. Normal tension vs high tension glaucoma: an - overview. Cesk Slov Oftalmol. 2019;75(2):55–60. doi: 10.31348/2019/2/1. [DOI] [PubMed] [Google Scholar]
- 40.Trivli A, Koliarakis I, Terzidou C, Goulielmos GN, Siganos CS, Spandidos DA, Dalianis G, Detorakis ET. Normal-tension glaucoma: Pathogenesis and genetics. Exp Ther Med. 2019;17(1):563–574. doi: 10.3892/etm.2018.7011. [DOI] [PMC free article] [PubMed] [Google Scholar]
- 41.Muthaian R, Minhas G, Anand A. Pathophysiology of stroke and stroke-induced retinal ischemia: emerging role of stem cells. J Cell Physiol. 2012;227(3):1269–1279. doi: 10.1002/jcp.23048. [DOI] [PubMed] [Google Scholar]
- 42.Schmid H, Renner M, Dick HB, Joachim SC. Loss of inner retinal neurons after retinal ischemia in rats. Invest Ophthalmol Vis Sci. 2014;55(4):2777–2787. doi: 10.1167/iovs.13-13372. [DOI] [PubMed] [Google Scholar]
- 43.Lee D, Tomita Y, Negishi K, Kurihara T. Retinal ischemic diseases and promising therapeutic molecular targets. Histol Histopathol. 2024:18756. doi: 10.14670/HH-18-756. [DOI] [PubMed] [Google Scholar]
- 44.Rattner A, Williams J, Nathans J. Roles of HIFs and VEGF in angiogenesis in the retina and brain. J Clin Invest. 2019;129(9):3807–3820. doi: 10.1172/JCI126655. [DOI] [PMC free article] [PubMed] [Google Scholar]
- 45.Liao F, Liu HT, Milla-Navarro S, Villa P, Germain F. Origin of retinal oscillatory potentials in the mouse, a tool to specifically locate retinal damage. Int J Mol Sci. 2023;24(4):3126. doi: 10.3390/ijms24043126. [DOI] [PMC free article] [PubMed] [Google Scholar]
- 46.Haq W, Zrenner E, Ueffing M, Paquet-Durand F. Using micro-electrode-array recordings and retinal disease models to elucidate visual functions: simultaneous recording of local electroretinograms and ganglion cell action potentials reveals the origin of retinal oscillatory potentials. Bioengineering. 2023;10(6):725. doi: 10.3390/bioengineering10060725. [DOI] [PMC free article] [PubMed] [Google Scholar]
- 47.Prencipe M, Perossini T, Brancoli G, Perossini M. The photopic negative response (PhNR): measurement approaches and utility in glaucoma. Int Ophthalmol. 2020;40(12):3565–3576. doi: 10.1007/s10792-020-01515-0. [DOI] [PMC free article] [PubMed] [Google Scholar]
- 48.Liu Q, He S, Groysman L, Shaked D, Russin J, Scotton TC, Cen S, Mack WJ. White matter injury due to experimental chronic cerebral hypoperfusion is associated with C5 deposition. PLoS One. 2013;8(12):e84802. doi: 10.1371/journal.pone.0084802. [DOI] [PMC free article] [PubMed] [Google Scholar]


