Abstract
The present study focuses on the development of a photochemical reactor coupled with a mass spectrometer for the in situ detection of the H2 generation rate of the photochemical water splitting process. To do so, sphalerite-type Zn1−xCdxS catalysts were synthesized, characterized, and tested as a proof-of-concept for the development of the equipment with applied materials. The sulphides were obtained by means of a green synthetic method, which avoids the use of toxic non-aqueous solvents and the application of high temperatures. The prepared Zn/Cd sulphide catalysts were physicochemically characterized by XRD, TEM, diffuse reflectance spectroscopy and electrochemical impedance spectroscopy. Afterwards, the catalytic performance of the materials towards hydrogen (photo)production was studied by means of the photoreactor coupled with the mass spectrometer. On the one hand, the results show the suitability of the photoreactor designed to measure the reaction rate under in situ conditions, exhibiting clear changes in the scan rate upon increasing the light energy (from visible to UV light). On the other hand, a high hydrogen production was achieved for Zn0.7Cd0.3S with a maximum value of 29.5 mmol gcat−1 after 100 minutes under visible light. This production is significantly higher than those previously reported in the literature for other standard materials, indicating the high potential of our materials for green hydrogen production.
Zn1−xCdxS was prepared by a new green and simple method. The best catalyst Zn0.7Cd0.3S produced 29.5 mmol h−1 gcat−1 of hydrogen under visible light and 795.4 mmol h−1 gcat−1 under UV light.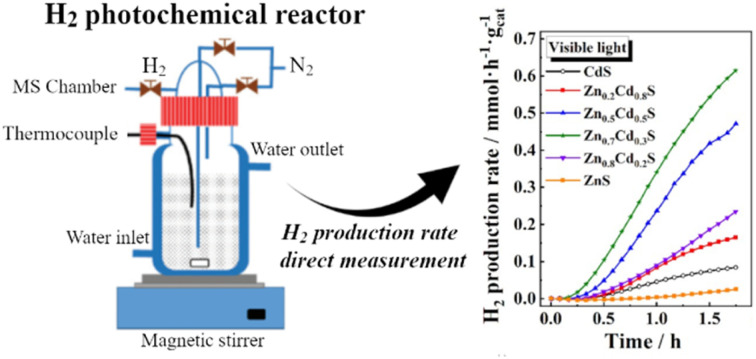
1. Introduction
The end of the 20th century and the beginning of the new millennium has been marked by the environmental and fuel crisis,1 among other political problems. Therefore, in recent decades, scientists and engineers have investigated new routes to achieve clean and sustainable energy that does not depend on fossil fuels.2 In this regard, hydrogen has been proposed as a suitable alternative. However, it is hardly found in nature, and therefore, it is desirable to develop better and cheaper ways to produce it at high purity levels. Nowadays, hydrogen production is based on the exploitation of non-renewable sources, such as gas and coal (normally labelled as non-environmental or grey hydrogen). The production of hydrogen through environmentally renewable sources (also known as green hydrogen) is still in its initial stages. Thus, the global production of green H2 was lower than 2% of the total production in 2021.3 For this reason, it is necessary to increase both research and investment in the next years. Several alternative methods have been proposed for producing green hydrogen, aiming to achieve higher production rates, lower costs, and the use of renewable sources to boost the procedure. In this sense, hydrogen photoproduction through water splitting has become an interesting option to fulfil these necessities.4 Diverse sustainable strategies on the green hydrogen production have been proposed. Among them, photocatalysis is probably the cheapest and easiest method.5,6
In 1972, Honda and Fujishima7,8 reported that water could be broken down into its elementary atoms (H2 and O2), by means of the water splitting technique onto a TiO2 surface.9 This technique consists of breaking the water molecules into molecular oxygen and hydrogen using UV and visible radiation.10 However, the rapid recombination of the photoexcited electrons and holes hinder this process, leading to an inefficient exploitation of visible light, which is among the other limitations of TiO2 in photocatalytic reactions.11 The current trend is the use of co-catalysts to reduce the recombination of electrons and holes and the activation energy. Instead, significant research efforts have been devoted to the search of semiconductor materials for water splitting, such as metal-doped and undoped oxides,12–14 (oxy)nitrides,15,16 sulfides,17etc., as well as free-metal carbon materials (g-C3N4).18 The typical metals5,19,20 used for doping are usually those with an electronic configuration of d0 and d10.
Both CdS and ZnS show wurtzite (ICSD: #154187) and sphalerite (ICSD: #81925) polymorphs. The latter is derived from cubic closest packing, while the first one comes from hexagonal closest packing. That means both crystal structures are quite close, and one can obtain wurtzite or sphalerite depending on the synthesis conditions. Most of the existing works on CdS for the sphalerite structure are heterojunctions of the sphalerite and wurtzite structure.21–23 It has been reported24–31 that the properties of CdS can be improved by forming nanocomposite structures with other functional nanomaterials, or by establishing heterojunctions between the different polymorphs.32,33 In this sense, a good example is the zinc sulphide structures doped with cadmium, Zn1−xCdxS, which presents higher activity due to the change in the positions of the valence and conduction bands.34,35 However, few authors have studied this compound under UV light conditions,36–38 and no previous studies have been found for the polymorph sphalerite under these conditions. This family of compounds is controversial because the maximum hydrogen production is not always obtained for the same composition.39 To explain this, several DFT-based theoretical calculations of free energy have been reported for related reactions on ZnS and CdS surfaces.40 Other studies suggest that the strength of this family of compounds is directly related to the position of the valence band, having enough redox power with an optimal band gap value to allow it to absorb a large amount of radiation from the visible spectrum onwards.32,36 This is mainly because the addition of cadmium to the system reduces the band gap, but maintains the conduction band at values close to 3 eV, which is considered a suitable value for water splitting. It is well known that noble metals such as rhodium, palladium and platinum dramatically enhance the efficiency of hydrogen evolution for CdS. However, platinum loading on ZnS shows limited improvement. Moreover, the high cost of noble metals limits their large-scale application.41,42 One significant challenge is to find a high-performance non-noble metal cocatalyst.14,43–45 Transition metal co-catalysts, metal–organic frameworks, or carbon-based nanocomposites are some promising options.46–48 For example, the addition of nickel or cobalt oxides significantly improves hydrogen production for CdZnS compounds.49,50 The Zn1−xCdxS photocatalyst exhibited better stability in the presence of Na2S and Na2SO3 as the sacrificial agent, whereas it exhibited relatively poor stability in the presence of ethanol.51 When no sacrificial agents are present, the reactions that take place for CdS are as follows:52,53
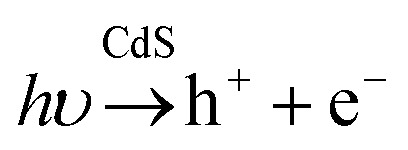 |
1 |
| CdS + 2h+ → Cd2+ + S | 2 |
| 2H2O + 2e− → H2 + 2OH− | 3 |
The sacrificial agent plays a fundamental role in preventing the corrosion that occurs on the catalyst. This problem was addressed by Ningzhong Bao et al.54 The photogenerated electrons in eqn (1) are employed in eqn (3) to give rise to hydrogen production. At the same time, the generated holes (eqn (1)) react in two pathways: (a) sulphite ions (SO32−) are oxidized to sulfate ions (SO42−); and (b) sulfide ions (S2−) are oxidized to disulfide ions (S22−):
| SO32− + 2OH− + 2h+ → SO42− + H2O | 4 |
| 2S2− + 2h+ → S22− | 5 |
The S22− ions present two problems: (a) they act as a light filter due to its yellowish coloration; and (b) they compete in the proton reduction reaction. However, with the presence of SO32− ions in the medium, the following reaction takes place:
| S22− + SO32− → S2O32− + S2− | 6 |
The presence of disulfide ions, S22−, in solution stabilizes the catalyst and inhibits the appearance of surface defects. This phenomenon, together with the processes described in eqn (4) and (5), help to stabilize and reduce the photocorrosion produced in the catalyst.54
In this study, the Zn1−xCdxS solid solution has been prepared in a facile and environmentally friendly way, and was subsequently structurally and electrochemically characterized. We combined two approaches to address the stability: doping CdS with ZnS, and using a Na2S/Na2S2O3-based sacrificial agent by keeping the synthesis route simple and environmentally friendly. We then studied the hydrogen production by water splitting using the obtained catalysts.
2. Experimental
2.1. Reagents
The following reagents were purchased and used without further purification steps: Cd(CH3COO)2·2H2O (Merck, 99.5%); Zn(CH3COO)2·2H2O (Merck, 99%); Na2S·xH2O (Aldrich, >60%); Na2SO3 (VWR-Chemicals, 98.1%), CdCl2 H2O (Aldrich, 98%); ZnCl2 (Merck, 98%); CS2 (Merck, 99.5%); ethylenediamine (Merck, synthesis grade); ethanol (Scharlau, 70%); butanol (Panreac, 99.5%); Nafion® (5%, Sigma-Aldrich); argon (Air Products, 99.999%). TGA was carried out to determine the number of water molecules in the hydrate compound, Na2S·xH2O.
2.2. Preparation of Zn1−xCdxS
2.2.1. Zn1−xCdxS with sphalerite structure
A typical synthesis was performed by dissolving 10 mmol of zinc/cadmium acetate in 50 mL of distilled water to prepare a 0.2 M solution in metal. Another solution of 25 mmol of Na2S in 50 mL of distilled water was prepared (0.5 M in S2−). The first solution was added dropwise very slowly over the latter and with stirring, which was maintained for 1 hour at room temperature. The resulting solid was separated by centrifugation at 4200 rpm for 10 minutes, washed twice with cold deionized water and once with ethanol, with centrifugation each time. Subsequently, it was dried overnight in an oven at 60 °C. A very fine yellowish powder of Zn1−xCdxS was obtained, with x = 0.0; 0.2; 0.5; 0.7; 0.8; and 1.0.
2.2.2. ZnS/CdS with wurtzite structure
The synthesis was performed following a modification of the method described elsewhere.55 In a typical synthesis, 4 mmol of zinc/cadmium chloride was dissolved in 5 mL of deionized water and 15 mL of butanol. Then, 30 mL of ethylenediamine was added dropwise to this solution, followed by 0.5 g of CS2. This mixture was heated by reflux for 1 hour. The resulting powder was obtained by centrifugation, washed twice with water and once with ethanol, and dried at 60 °C overnight.
2.3. Characterization
The XRD patterns were performed with an Empyrean PANalytical X-ray diffractometer using Cu Kα radiation (α = 1.54056 Å) in a 2θ range from 10° to 80°. The phase identification was performed using the X'Pert HighScore Plus software with the PDF-4 database. For the transmission electron microscopy study (TEM 200 kV, Jeol JEM 2100), the sample was prepared by suspending 25 mg of catalyst in absolute ethanol in an ultrasonic bath for 20 minutes. Subsequently, a portion of the dispersion was taken, and a drop was deposited onto carbon-coated copper TEM grids. The diffuse reflectance spectra (DRS) were recorded using a UV-visible spectrophotometer from Agilent Technologies, model Cary 5000. BaSO4 powder, used as the reference, was mixed in a mortar with the photocatalyst. The Fluorolog FL3-21 fluorescence spectrophotometer (Jobin Yvon HORIBA) was used to record steady-state luminescence spectra of the selected samples in the VIS region at room temperature in front face mode (backscattering geometry) using an Xe lamp (450 W) as the excitation light source. A photomultiplier tube R928 detector was used to collect the signal.
Electrochemical impedance spectroscopy (EIS) was carried out with an Autolab potentiostat/galvanostat equipped with a frequency response analyser (Autolab-PGSTAT204-FRA32M) to achieve the flat-band potential (VFB) and an estimation of the location of the conduction band. A glass three-electrode half-cell was used to perform the EIS experiments with 0.1 M Na2SO3 as the background electrolyte. The electrode setup consisted of a reversible hydrogen electrode (RHE) in the supporting electrolyte as the reference electrode and a glassy carbon (GC) rod as the auxiliary electrode. The potentials in this work are referred to the RHE. As the working electrode, several catalyst inks were produced and drop-casted onto the surface of a glassy carbon disk (geometric area = 0.0706 cm2). The inks were achieved by sonication of 4 mg of photocatalyst in 15 μL of Nafion and 5 mL of ultrapure water, and then 10 μL of the ink was immobilized onto the GC disk under argon flux. After the immersion of the working electrode, the capacitance of the system was recorded at 1000, 1500 and 2000 Hz in a potential range between −0.7 and 0.0 V, applying potential steps of 50 mV. After the experiments, the validity of the Mott–Schottky plots was assessed56 and the value of the flat-bands was obtained.
Hydrogen photocatalytic production was studied by means of a configuration designed and built in our laboratory, as described previously.14,42 Briefly, this system includes an elliptical-based cylindrical reflecting wall, which generates two focal points. Thus, the reactor is placed in one of the focal points of the ellipse and the radiation lamps in the other one. Using this configuration, a homogeneous reflection of the light is produced and concentrating at the reactor focus through the geometry of the ellipsis. The latter consists of a double-walled borosilicate flask that allows a flow of water in the inner wall for temperature control purposes during the experiment. UV mercury (Philips, HPA Synergy 300 W) and visible (Leuci Classic Halogen linear, 500 W) lamps were used as radiation sources. Hydrogen photochemical production was monitored continuously using an Omnistar mass spectrometer (Pfeiffer Vacuum) connected to the reactor outlet by a PTFE capillary. Additionally, a continuous nitrogen gas transport flow of 15 mL min−1 was passed through the reactor set by a mass flow controller. To quantify the amount of hydrogen produced, the H2 channel signal provided by the mass spectrometer was previously calibrated with the carrier gas and different concentrations of pure hydrogen.
In all experiments, 0.200 g of Zn1−xCdxS powder was added to the reactor containing 200 mL of a solution with 0.35 M Na2S and 0.25 M Na2SO3,47,57,58 which will act as a sacrificial agent. The measurements were carried out under visible light for 100 minutes, and switched to UV light for another 100 minutes. The suspension was kept under continuous stirring and the reactor temperature was maintained at 20 °C, using a water flow into the reactor jacket from a thermostat bath (Selecta, model 382), throughout the whole measurement processes.
3. Results and discussion
3.1. X-ray patterns and morphological analysis
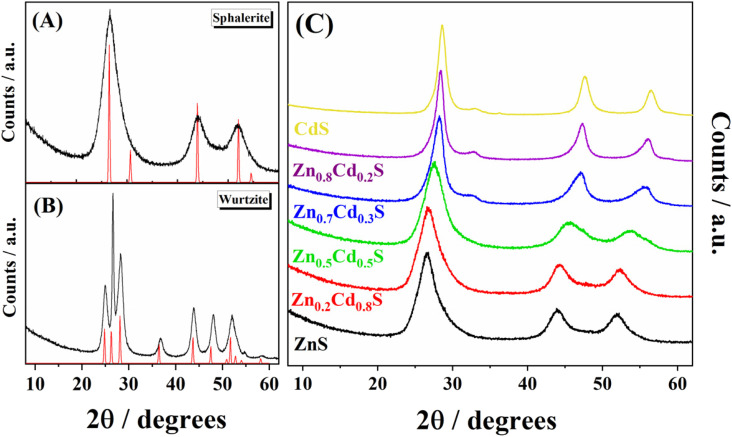
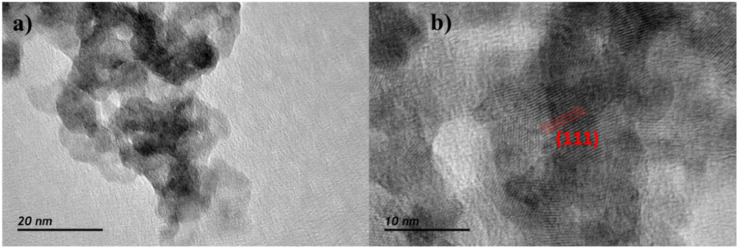
Fig. 1 shows the X-ray diffraction patterns of the synthesized CdS particles with both crystalline structures: wurtzite (Fig. 1A) and sphalerite (Fig. 1B). These patterns were compared with the references from the ICSD database: #81925 (sphalerite)59 and #154187 (wurtzite).60 The XRD patterns for the synthesized target materials (Zn1−xCdxS, see Fig. 1C) present the characteristic Bragg peak features corresponding to metal sulphides with a sphalerite structure. For the pure sphalerite-type sulphide structures, the patterns reveal the F4̄3m space group (#216), presenting a cell parameter a of 5.80 Å for the CdS. The latter decreases to 5.36 Å for the ZnS, as it has been already reported for similar materials (5.77 Å and 5.33 Å, respectively). Upon increasing the amount of cadmium content in the Zn1−xCdxS sphalerite phase, the main Bragg peaks of the zinc sulphide remain. However, the peak positions are slightly shifted towards smaller angles. This reveals the complete formation of a solid solution of the two metal cations without the existence of any other secondary phases. Considering that both share a tetrahedral coordination, the downshifting of the mixed sulphide peaks in comparison with ZnS arises since the radius of Zn2+ (0.74 Å) is smaller than the radius of Cd2+ (0.94 Å).61,62 Additionally, all experimental patterns display very wide Bragg peaks, proving that sulphide crystallites were obtained at the nanometric scale.57,58,63 The latter was corroborated by means of transmission electron microscopy, as shown in Fig. 2. As shown in Fig. 2A, the Zn1−xCdxS solid solution prepared in the present work does not exhibit the typical needle morphology of the metal sulphide with wurtzite structure.64 Instead, small and rather spherical particles (8.5 nm) have been obtained. In addition, Fig. 2B reveals the atomic domains of the different nanoparticles along with the identification of the (111) crystalline planes, presenting an interplanar distance of 0.331 nm.
Fig. 1. X-ray diffraction patterns for (A) experimental (black) and reference (red) (ICSD #81925) CdS with sphalerite structure. (B) Experimental (black) and reference (red) CdS wurtzite structure (ICSD #154187) (C) X-ray diffraction patterns of the synthesized Zn1−xCdxS, with x values ranging from 0 to 1.
Fig. 2. (a) TEM image and (b) HRTEM image showing the domains within a particle corresponding to the (111) diffraction plane. Both images are of Zn0.7Cd0.3S.
3.2. Determination of bandgaps
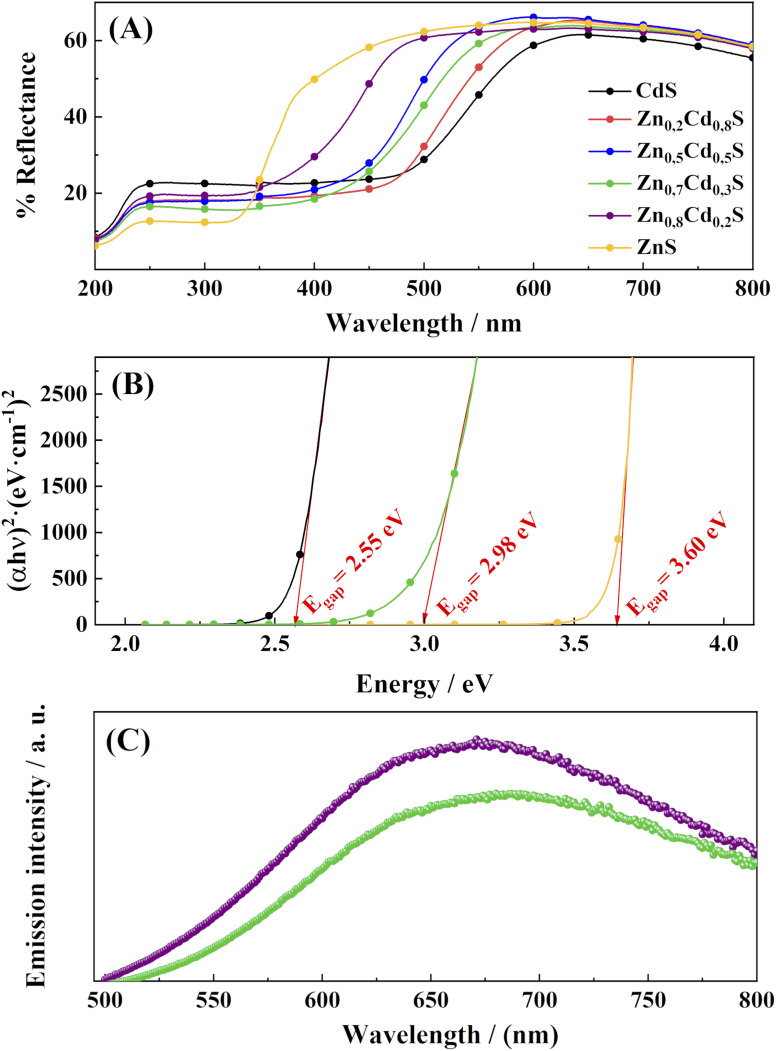
As the materials described above were designed for testing our home-made in situ mass spectrometer photocatalytic reactor, further insights about the semiconductor features of the materials are needed. Thus, the band gap energy, as well as the conduction and valence band positions, were estimated by both spectroscopic and electrochemical methods, respectively. Firstly, the band gap was estimated by means of UV-vis diffuse reflectance spectroscopy (see Fig. 3A) and the Tauc plots were subsequently obtained by applying the following equation:
| C(hν − Eg) = (αhν)1/n | 7 |
Where h is the Planck constant; ν is the frequency; Eg is the bandgap energy, C is a constant, n is 2 (as the materials present a direct allowed transition semiconductor behaviour), and α is the absorption coefficient of the semiconductor, calculated from the reflectance spectra by using the Kubelka–Munk model.65–67 The results for the band gap energy determination are depicted in Fig. 3B. For the sake of clarity, only the ZnS, Zn0.7Cd0.3S and CdS values are given. All values are presented in Fig. S1, ESI.† In this way, the value of the latter can be obtained from the extrapolation of the slope at the place where it cuts the abscissa axis. In the case of CdS and ZnS, the bandgaps are 2.55 eV and 3.60 eV, respectively. These values are close to the 2.4 eV value reported by Ullah et al.68 for CdS, and 3.6 eV reported by D'Amico et al.69 for ZnS. In addition, a value of 2.98 eV was determined for the band gap of Zn0.7Cd0.3S (i.e., the material presenting the highest H2 rate photochemical production in the next section). It can be clearly observed that the bandgap increases with the increasing content of Zn in the solid solution. Thus, the target material possesses a band gap value located between that of the pure CdS and pure ZnS (2.98 eV). Although the band gap energy is a fundamental parameter that can be modulated to achieve good photocatalytic activity,32,33 the absolute position of the latter is not the only descriptor to be considered in semiconductor chemistry. Thus, to achieve a clear picture about the semiconductor behaviour, further descriptors must be studied, such as the electron–hole recombination rate70,71 or the position of both the VB and the CB. The latter was achieved by an electrochemical impedance study of the materials.
Fig. 3. (A) Diffuse reflectance spectra of the Zn1−xCdxS solid-state photocatalysts, with x = 0 to 1. (B) Tauc plot for determining the bandgap for Zn0.7Cd0.3S, CdS and ZnS. (C) Photoluminescence spectra for Zn0.7Cd0.3S (green dots) and Zn0.8Cd0.2S (purple dots) samples obtained under excitation at 440 nm, corresponding to the mean bandgap separation energy of both samples.
Fig. 3c shows the photoluminescence (PL) spectra of the spherical nanocrystals obtained in this work. The curve displays a broad emission, which shifts to a longer wavelength with higher cadmium content. The broad peak centered at ∼640 nm and ∼700 nm for Zn0.8Cd0.2S and Zn0.7Cd0.3S, respectively, come from a trapped emission ascribed to the sulfur- and zinc-related vacancies and surface states.72 The decrease in the photoluminescence intensity is due to the decrease in the number of point defects and suppressed recombination of photogenerated electron–hole pairs.73 As was stablished in the literature, the electron recombination is directly related to the PL intensity, as lower intensity indicates a reduced recombination rate and longer carrier lifetime.74 These results explain the significant hydrogen production rate shown by the Zn0.7Cd0.3S catalyst.
3.3. Mott–Schottky analysis
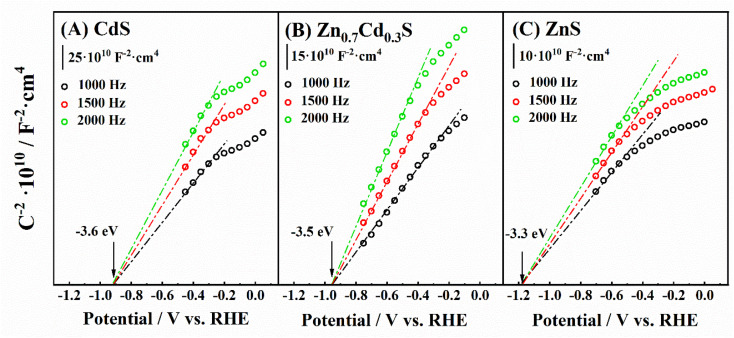
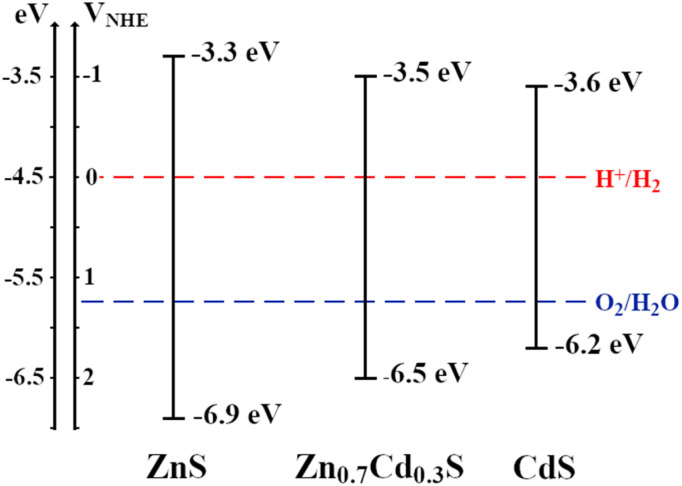
As the photocatalysts studied in this work are n-type semiconductors, the position of the valence flat band potential (VFB) is estimated to be close to the conduction band. Thus, to estimate the former, several EIS experiments have been carried out in 0.1 M Na2SO3 and the Mott–Schottky analysis was performed (Fig. 4). The Mott–Schottky technique scans the electrochemical impedance response of the material in the region where no complete (electro)chemical reactions take place. Thus, the addition of the sacrificial agent is not needed to carry this measurement, as no hydrogen is photochemically generated during the measurement. Since the calculation of the flat-band potential allows the position of the conduction band to be estimated, the position of the valence band has been solved by applying the direct subtraction of the band gap calculated in the previous section from the VFB. An energy diagram of the semiconductors is depicted in Fig. 5. Indeed, the position of the bands with respect to the redox couples for water splitting proves that the whole process is expected to take place while using these materials as photocatalytic suspensions in a photoreactor for water splitting. The value obtained for the conduction band of CdS was determined to be 6.2 eV, which is in agreement with that estimated by Kindig and Spicer (6.4 eV).75 Similarly, the value of the conduction band for ZnS synthesized in this work is similar to that calculated by Yuhong Huang et al. (−8.62 eV to −6.04 eV).76 On the other hand, the values for the CB obtained for the Zn0.7Cd0.3S (−3.5 eV) in our work is higher than those obtained by other authors77 for polycrystalline samples of similar composition (−4.3 eV). This change may have mainly resulted from the sample prepared by Arriaga et al.77 being a mixture of wurtzite and sphalerite phases.
Fig. 4. Mott–Schottky obtained by measuring the capacitance at 1000, 1500 and 2000 Hz in a 0.1 M Na2SO3 solution by EIS for (A) ZnS, (B) CdS and (C) Zn0.7Cd0.3S.
Fig. 5. Energy diagram of the valence and conduction bands of the synthesized semiconductors. The position of the conduction band has been estimated from Mott–Schottky analysis, and the value of the band gap was obtained from the diffuse reflectance spectra.
It is important to note that the catalysts must meet three different requirements for hydrogen production: (i) maintain adequate band edge energy for the overall water splitting; (ii) present band gap energy values lower than 3 eV;33 and (iii) show high stability towards the photocatalytic reaction. Moreover, for those catalysts, it is also desirable to maintain the edge of the CB as close as possible to 3 eV vs. NHE (−7.5 eV).77 By taking this into consideration, the CB of the ZnS is closer to 3 eV vs. NHE than the rest of the materials, however its band gap is too large to carry the photo water splitting (3.60 eV). CdS presents a good value for the band gap (2.55 eV), but the conduction band is too far from 3 eV vs. NHE. Thus, the Zn0.7Cd0.3S is in a situation where all the requirements are fulfilled, with a band gap slightly lower than 3 eV (2.98 eV) and a conduction band that is closer to 3 eV vs. NHE than that of the CdS. These features, along with the role of the sacrificial agent and the decrease of electron–hole recombination enhanced by the small particle size,78 boost the photocatalytic activity of Zn0.7Cd0.3S towards water splitting.
3.4. Hydrogen production
Hydrogen production tests were performed using the home-made system42 described in Section 2.4. To the best of our knowledge, this configuration has not been previously reported in the photochemistry field. Thus, it is important to mention its advantages, especially for the study of water splitting. Most of the research studies devoted to the photochemical production of hydrogen by water splitting use gas chromatography to characterize the catalytic activity of the materials. Thus, the experiments are carried in batch regime. This means that gas chromatography allows the detection of the accumulated hydrogen production at several times. Thus, after several batches, one can divide the generated hydrogen (normally expressed in mmol gcat−1) by the time (normally expressed in h) to achieve a value of the average rate production units in mmol gcat−1 h−1. However, the configuration presented in this work allows us to do the opposite. Here, the H2 production rate is measured at every moment, and the integration of the area under de curve allows to solve the amount of total hydrogen generated during the process. This concept may be interesting as a starting point to study under in situ conditions how the hydrogen production rate is affected by different parameters (i.e., changes in the wavelength of the irradiation light or in its intensity, addition of different concentrations of the sacrificial agent, etc.).
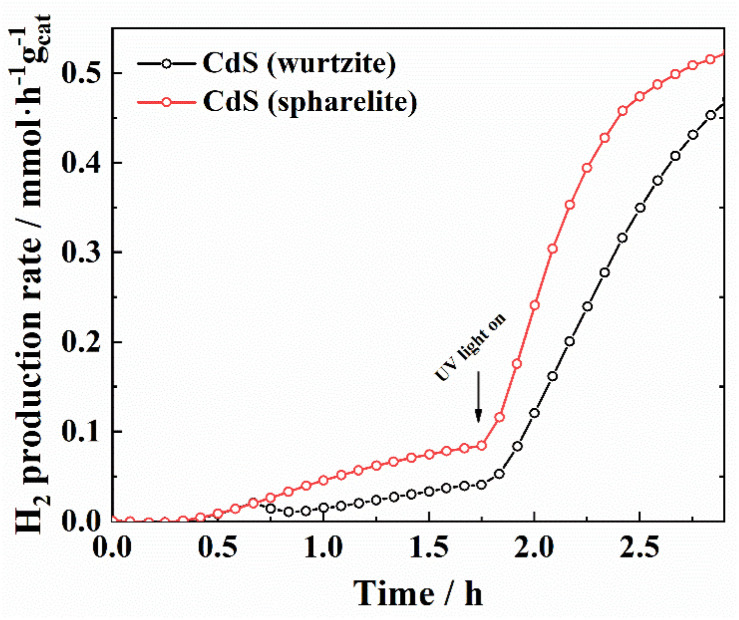
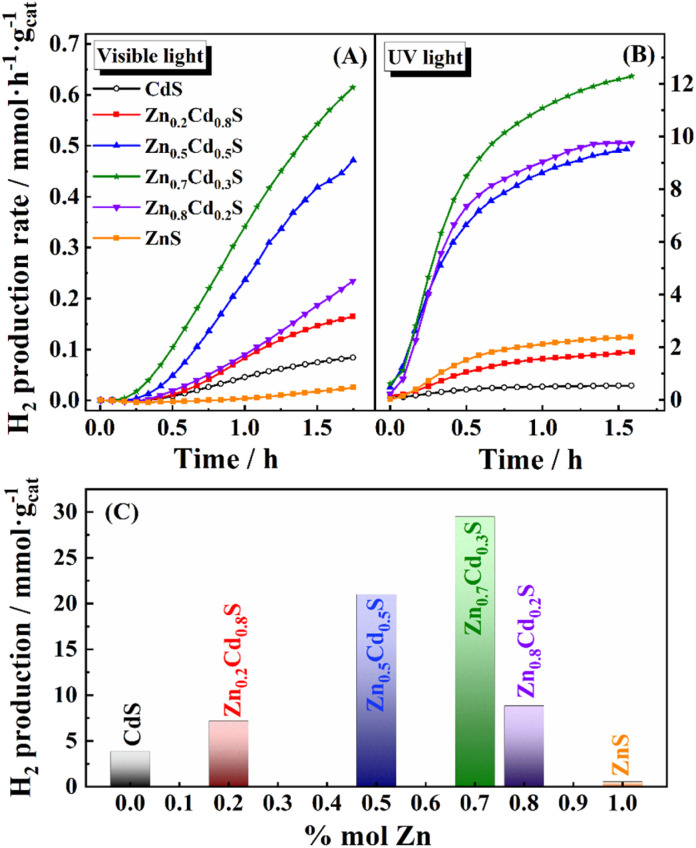
As a proof-of-principle of both the materials synthesized and the MS-coupled photochemical reactor developed in this work, the hydrogen photo-production rate was determined for pure CdS with sphalerite and wurtzite structural types (Fig. 6). Firstly, a fast response of the system towards a change in the wavelength was demonstrated. In this case, after 100 minutes of measuring under visible conditions, the light source was changed to UV, and thus an increase in the H2 production rate was immediately detected (i.e., a very fast response time of the MS configuration). This corroborates the capacity of the system to record changes in the production rate under in situ conditions. Moreover, this experiment also proves that the sphalerite structure presents slightly better photoactivity than the wurtzite one for hydrogen production under both visible and UV radiation. An analogous plot can be seen in Fig. 7 for Zn1−xCdxS semiconductors synthesized in this work with sphalerite structure. Hydrogen production measurements were performed and monitored until the concentration of hydrogen production remained stable (100 min) under visible light irradiation. The light source was then changed to an ultraviolet lamp, and the samples were irradiated for another 100 minutes (the results have been separated into two different plots to better understand the integration of the signal and its mathematical limits).
Fig. 6. Comparison of the hydrogen production rate for CdS with wurtzite and sphalerite structures.
Fig. 7. Hydrogen production rate vs. time for the Zn1−xCdxS catalysts with different zinc contents using (A) visible and (B) UV light. (C) Maximum hydrogen production rate of Zn1−xCdxS vs. zinc content, using UV radiation.
As the values are easier to compare with the existing literature on H2 production with sulfides, the accumulative hydrogen after ca. 2 h of production was resolved by integration of Fig. 7A for all the materials studied in this work. The values obtained for the visible light show that all the materials present the same production rate during the first 15 min upon illumination with visible light. However, from this point, the H2 production rate varies for every material. Indeed, it is clear that both small or large amounts of Zn at the solid solution maintain photocatalytic behavior that is similar to those of the pure ZnS/CdS phases. Nevertheless, those materials with Zn content between 0.5 < x < 0.8, particularly the Zn0.7Cd0.3S, have shown the fastest response towards photochemical H2 generation. Fig. S2, ESI,† shows the H2 production with and without a sacrificial agent for Zn0.7Cd0.3S and Zn0.8Cd0.2S and for the sacrificial agent alone, confirming that the high values of H2 production are mainly due to our catalysts. As the results obtained by this method should be comparable with the existing literature, the data depicted in Fig. 7A have been integrated to achieve the amount of hydrogen generated during the 100 minutes of illumination with visible light (the total amount of H2 over a specific period is the most common descriptor of a photochemical catalyst in literature). The results are presented in Fig. 7C. Hydrogen production obtained with Zn0.7Cd0.3S attained a value of 29.5 mmol of H2 per gcat under visible radiation, which is higher than those reported by other authors studying zinc/cadmium sulphide-based composites. To prove this, some literature results are summarized in Table 1. In particular, Shu et al.80 achieved lower production than those reported in the present work (4.5 mmol of H2 per gcat), but also used zinc/cadmium sulphide-based composites with sphalerite structures. On the other hand, a short survey of the production rates of similar catalyst compositions synthesized through different methods shows relatively low H2 production compare with our material, with values between 0.6 and 1.7 mmol gcat−1 (ref. 81) under visible light. It should be noted that the catalysts synthesized in this work have not been optimized. Furthermore, both noble metal and other co-catalysts have not been used yet, so further improvement in the activity is expected in future research for our materials.
Hydrogen production for various catalysts based on the Zn1−xCdxS composition without cocatalyst. Sacrificial agents and their concentration used are also included.
| Catalyst | Cocatalyst | H2 production (mmol gcat−1) | Sacrificial agent | Year/reference |
|---|---|---|---|---|
| Zn0.56Cd0.44S | — | 0.6 | 0.35 M Na2SO3 + 0.25 M Na2S | 2010 (ref. 53) |
| Zn0.7Cd0.3S | — | 1.7 | 0.30 M Na2SO3 + 0.25 M Na2S | 2017 (ref. 79) |
| Zn0.5Cd0.5S | Fe0.3Pt0.7 | 4.5 | 0.35 M Na2SO3 + 0.25 M Na2S | 2017 (ref. 80) |
| Zn0.7Cd0.3S | — | 29.5 | 0.35 M Na2SO3 + 0.25 M Na2S | This work |
4. Conclusions
In this work, a reactor has been coupled to a mass spectrometer detector as a method to measure the rate of a photochemical reaction under in situ conditions. The configuration allows us to directly measure the impact of experimental changes (e.g., energy of the irradiated light) during the photochemical process. This configuration allowed for the photochemical characterization of the H2 production with Zn/Cd sulphide catalysts as a proof of concept. The physicochemical characterization of the catalysts indicates the formation of nanometric size powders, where the addition of Cd to the cubic structure of ZnS produces: (i) a significant reduction of the bandgap energy and (ii) an increase of the valence band energy. These two features, along with the lower recombination rate proved by photoluminescence measurements, propose that the Zn0.7Cd0.3S material is the one with higher activity towards the photochemical water splitting. This was corroborated in the MS-coupled photochemical reactor, which showed a total production yield of 29.5 mmolH2 gcat−1 over 100 min, along with a maximum production rate of 0.6 mmol gcat−1 h−1. Altogether, the setup presented in this work has been successfully proved as an innovative technique to achieve in situ information of the photocatalytic system.
Data availability
Data will be made available from the corresponding author upon request.
Author contributions
Modesto González-Rodríguez: writing – original draft, methodology; Sergio Díaz-Coello: writing – original draft, methodology; Selene Díaz-González: methodology; Michail Žitňan: methodology, Gustavo Galleani: methodology; Jose Joaquín Velázquez: methodology, Vicente Daniel Rodríguez: supervision; Elena Pastor: writing – review & editing, Pedro Núñez: conceptualization, supervision, writing – review & editing, funding acquisition.
Conflicts of interest
The authors declare that they have no known competing financial interests or personal relationships that could have appeared to influence the work reported in this paper.
Supplementary Material
Acknowledgments
This work is supported by the following projects: 2021 ECO-05 funded by Fundación Cajacanarias (Tenerife, Spain); PID2020-117586RB-I00 funded by MCIN/AEI/10.13039/501100011033 (Spain). Also, this work is part of the dissemination activities of the FunGlass project, received funding from the European Union Horizon 2020 research and innovation programme under grant agreement no. 739566 and by the Slovak Research and Development Agency under the contract by grant VEGA 1/0844/21. The authors gratefully acknowledge the sponsorship of the Cabildo de Tenerife-Talentum project (exp. 2024/0002355).
Electronic supplementary information (ESI) available: Fig. S1 (Tauc plot) and S2 (H2 production with and without sacrificial agent). See DOI: https://doi.org/10.1039/d4ra05402d
References
- Baykara S. Z. Hydrogen as fuel: A critical technology? Int. J. Hydrogen Energy. 2005;30(5):545–553. doi: 10.1016/j.ijhydene.2004.06.010. [DOI] [Google Scholar]
- Verhelst S. Recent progress in the use of hydrogen as a fuel for internal combustion engines. Int. J. Hydrogen Energy. 2014;39(2):1071–1085. doi: 10.1016/j.ijhydene.2013.10.102. [DOI] [Google Scholar]
- Terlouw T. Bauer C. McKenna R. Mazzotti M. Large-scale hydrogen production via water electrolysis: a techno-economic and environmental assessment. Energy Environ. Sci. 2022;15(9):3583–3602. doi: 10.1039/d2ee01023b. [DOI] [Google Scholar]
- Yan Z. Yin K. Xu M. et al., Photocatalysis for synergistic water remediation and H2 production: A review. Chem. Eng. J. 2023;472:145066. doi: 10.1016/j.cej.2023.145066. [DOI] [Google Scholar]
- Chen S. Takata T. Domen K. Particulate photocatalysts for overall water splitting. Nat. Rev. Mater. 2017;2:17050. doi: 10.1038/natrevmats.2017.50. [DOI] [Google Scholar]
- Wang Q. Hisatomi T. Jia Q. et al., Scalable water splitting on particulate photocatalyst sheets with a solar-to-hydrogen energy conversion efficiency exceeding 1% Nat. Mater. 2016;15(6):611. doi: 10.1038/nmat4589. [DOI] [PubMed] [Google Scholar]
- Fujishima A. Honda K. Electrochemical Photolysis of Water at a Semiconductor Electrode. Nature. 1972;238:37. doi: 10.1038/238037a0. [DOI] [PubMed] [Google Scholar]
- Fujishima A. Rao T. N. Tryk D. A. Titanium Dioxide Photocatalysis. J. Photochem. Photobiol., C. 2000;1:1. [Google Scholar]
- Bard A. J. Photoelectrochemistry and heterogeneous photo-catalysis at semiconductors. J. Photochem. 1979;10(1):59. doi: 10.1016/0047-2670(79)80037-4. [DOI] [Google Scholar]
- Prakash J. Kumar P. Saxena N. et al., CdS based 3D nano/micro-architectures: formation mechanism, tailoring of visible light activities and emerging applications in photocatalytic H2 production, CO2 reduction and organic pollutant degradation. J. Mater. Chem. A. 2023;11:10015. doi: 10.1039/d3ta00396e. [DOI] [Google Scholar]
- Dong H. Zeng G. Tang L. et al., An overview on limitations of TiO2-based particles for photocatalytic degradation of organic pollutants and the corresponding countermeasures. Water Res. 2015;79:128. doi: 10.1016/j.watres.2015.04.038. [DOI] [PubMed] [Google Scholar]
- Ham Y. Hisatomi T. Goto Y. et al., Flux-mediated doping of SrTiO3 photocatalysts for efficient overall water splitting. J. Mater. Chem. A. 2016;4:3027. doi: 10.1039/c5ta04843e. [DOI] [Google Scholar]
- Konta R. Ishii T. Kato H. Kudo A. Photocatalytic activities of noble metal ion doped SrTiO3 under visible light irradiation. J. Phys. Chem. B. 2004;108:8992. doi: 10.1021/jp049556p. [DOI] [Google Scholar]
- Díaz L. Rodríguez V. D. González-Rodríguez M. et al., M/TiO2(M = Fe, Co, Ni, Cu, Zn) catalysts for photocatalytic hydrogen production under UV and visible light irradiation. Inorg. Chem. Front. 2021;8:3491. doi: 10.1039/d0qi01311k. [DOI] [Google Scholar]
- Maeda K. Lu D. Domen K. Direct water splitting into hydrogen and oxygen under visible light by using modified TaON photocatalysts with d0 electronic configuration. Chem.–Eur. J. 2013;19:4986. doi: 10.1002/chem.201300158. [DOI] [PubMed] [Google Scholar]
- Maeda K. Takata T. Hara M. et al., GaN:ZnO solid solution as a photocatalyst for visible-light-driven overall water splitting. J. Am. Chem. Soc. 2005;127:8286. doi: 10.1021/ja0518777. [DOI] [PubMed] [Google Scholar]
- Nasir J. A. Rehman Z. U. Shah S. N. A. Khan A. Butler I. S. Catlow C. R. A. Recent developments and perspectives in CdS-based photocatalysts for water splitting. J. Mater. Chem. A. 2020;8:20752–20780. doi: 10.1039/d0ta05834c. [DOI] [Google Scholar]
- Zuo G. Wang Y. Teo W. L. et al., Ultrathin ZnIn2S4 Nanosheets Anchored on Ti3C2TX MXene for Photocatalytic H2 Evolution. Angew. Chem., Int. Ed. 2020;59:11287. doi: 10.1002/anie.202002136. [DOI] [PubMed] [Google Scholar]
- Chen X. Shen S. Guo L. Mao S. S. Semiconductor-based photocatalytic hydrogen generation. Chem. Rev. 2010;110:6503. doi: 10.1021/cr1001645. [DOI] [PubMed] [Google Scholar]
- Kudo A. Miseki Y. Heterogeneous photocatalyst materials for water splitting. Chem. Soc. Rev. 2009;38:253. doi: 10.1039/b800489g. [DOI] [PubMed] [Google Scholar]
- Du H. Liang K. Yuan C. Z. et al., Bare Cd1-xZnxS ZB/WZ Heterophase Nanojunctions for Visible Light Photocatalytic Hydrogen Production with High Efficiency. ACS Appl. Mater. Interfaces. 2016;8:24550. doi: 10.1021/acsami.6b06182. [DOI] [PubMed] [Google Scholar]
- Liu M. Jing D. Zhou Z. Guo L. Twin-induced one-dimensional homojunctions yield high quantum efficiency for solar hydrogen generation. Nat. Commun. 2013;4:2278. doi: 10.1038/ncomms3278. [DOI] [PubMed] [Google Scholar]
- Huang M. Kong Z. Ai Z. et al., Twin Zn1−xCdxS Solid Solution: Highly Efficient Photocatalyst for Water Splitting. Nano–Micro Small. 2023;20:2304784. doi: 10.1002/smll.202304784. [DOI] [PubMed] [Google Scholar]
- Zhang W. Zhong Z. Wang Y. Xu R. Doped solid solution: (Zn0.95Cu0.05)1-xCdxS nanocrystals with high activity for H2 evolution from aqueous solutions under visible light. J. Phys. Chem. C. 2008;112:17635. doi: 10.1021/jp8059008. [DOI] [Google Scholar]
- Shang L. Tong B. Yu H. et al., CdS Nanoparticle-Decorated Cd Nanosheets for Efficient Visible Light-Driven Photocatalytic Hydrogen Evolution. Adv. Energy Mater. 2016;6:1501241. doi: 10.1002/aenm.201501241. [DOI] [Google Scholar]
- Villoria J. A. Navarro-Yerga R. M. Al-Zahrani S. M. Fierro J. L. G. Photocatalytic hydrogen production on Cd1-xZnxS solid solutions under visible light: Influence of thermal treatment. Ind. Eng. Chem. Res. 2010;49:6854. doi: 10.1021/ie901718r. [DOI] [Google Scholar]
- del Valle F. Ishikawa A. Domen K. et al., Influence of Zn concentration in the activity of Cd1-xZnxS solid solutions for water splitting under visible light. Catal. Today. 2009;143:51. doi: 10.1016/j.cattod.2008.09.024. [DOI] [Google Scholar]
- Liu M. Wang L. Lu G. Yao X. Guo L. Twins in Cd1-xZnxS solid solution: Highly efficient photocatalyst for hydrogen generation from water. Energy Environ. Sci. 2011;4:1372. doi: 10.1039/c0ee00604a. [DOI] [Google Scholar]
- Xing C. Zhang Y. Yan W. Guo L. Band structure-controlled solid solution of Cd1-xZnxS photocatalyst for hydrogen production by water splitting. Int. J. Hydrogen Energy. 2006;31:2018. doi: 10.1016/j.ijhydene.2006.02.003. [DOI] [Google Scholar]
- Kurnia F. Scott J. A. Valanoor H. Hart J. N. A review of non-oxide semiconductors for photoelectrochemical water splitting. J. Mater. Chem. C. 2022;11:802–826. doi: 10.1039/d2tc02533g. [DOI] [Google Scholar]
- Hoque M. M. Zubair M. A. Sajjad R. N. Formation of wide-bandgap, highly transparent and compact Cd1−xZnxS films with dynamically controlled pH in chemical bath deposition. J. Mater. Chem. C. 2023;13:6360. doi: 10.1039/d3tc00450c. [DOI] [Google Scholar]
- Mei Z. Zhang M. Schneider J. et al., Hexagonal Zn1-xCdxS (0.2 ≤ x ≤ 1) solid solution photocatalysts for H2 generation from water. Catal. Sci. Technol. 2017;7:982. doi: 10.1039/c6cy02572b. [DOI] [Google Scholar]
- Huang M. Luo X. Ai Z. et al., Band Structure–Controlled Zn1−xCdxS Solid Solution for Photocatalytic Hydrogen Production Improvement via Appropriately Enhancing Oxidation Capacity. Sol. RRL. 2021;5:2000685. doi: 10.1002/solr.202000685. [DOI] [Google Scholar]
- Matsumura M. Furukawa S. Saho Y. Tsubomura H. Cadmium sulfide photocatalyzed hydrogen production from aqueous solutions of sulfite: effect of crystal structure and preparation method of the catalyst. J. Phys. Chem. 1985;89:1327. doi: 10.1021/j100254a001. [DOI] [Google Scholar]
- Arora M. K. Sinha A. S. K. Upadhyay S. N. Active Cadmium Sulfide Photocatalysts for Hydrogen Production from Water. Ind. Eng. Chem. Res. 1998;37:3950. doi: 10.1021/ie970617y. [DOI] [Google Scholar]
- Xing C. Zhang Y. Yan W. Guo L. Band structure-controlled solid solution of Cd1 - xZnx S photocatalyst for hydrogen production by water splitting. Int. J. Hydrogen Energy. 2006;31:2018. doi: 10.1016/j.ijhydene.2006.02.003. [DOI] [Google Scholar]
- Liu M. Wang L. Lu G. Yao X. Guo L. Twins in Cd1-xZnxS solid solution: Highly efficient photocatalyst for hydrogen generation from water. Energy Environ. Sci. 2011;4:1372. doi: 10.1039/c0ee00604a. [DOI] [Google Scholar]
- Chen J. Shen Z. Lv S. et al., Fabricating sandwich-shelled ZnCdS/ZnO/ZnCdS dodecahedral cages with “one stone” as Z-scheme photocatalysts for highly efficient hydrogen production. J. Mater. Chem. A. 2018;6:19631. doi: 10.1039/c8ta07362g. [DOI] [Google Scholar]
- Liu Y. Zheng X. Yang Y. et al., Recent Advances in the Hydrogen Evolution Reaction of ZnxCd1−xS-Based Photocatalysts. Sol. RRL. 2022;6:2101061. doi: 10.1002/solr.202101061. [DOI] [Google Scholar]
- Zhou Z. Han F. Guo L. Prezhdo O. V. Understanding divergent behaviors in the photocatalytic hydrogen evolution reaction on CdS and ZnS: A DFT based study. Phys. Chem. Chem. Phys. 2016;18:16862. doi: 10.1039/c6cp02599d. [DOI] [PubMed] [Google Scholar]
- Yan H. Yang J. Ma G. et al., Visible-light-driven hydrogen production with extremely high quantum efficiency on Pt-PdS/CdS photocatalyst. J. Catal. 2009;266:165. doi: 10.1016/j.jcat.2009.06.024. [DOI] [Google Scholar]
- Velázquez J. J. Fernández-González R. Díaz L. Pulido-Melián E. Rodríguez V. D. Núñez P. Effect of reaction temperature and sacrificial agent on the photocatalytic H2-production of Pt-TiO2. J. Alloys Compd. 2017;721:405. doi: 10.1016/j.jallcom.2017.05.314. [DOI] [Google Scholar]
- Zhao H. Wang J. Dong Y. Jiang P. Noble-Metal-Free Iron Phosphide Cocatalyst Loaded Graphitic Carbon Nitride as an Efficient and Robust Photocatalyst for Hydrogen Evolution under Visible Light Irradiation. ACS Sustain. Chem. Eng. 2017;5:8053. doi: 10.1021/acssuschemeng.7b01665. [DOI] [Google Scholar]
- Nishikiori H. Harata N. Yamaguchi S. et al., Formation of CuO on TiO2 surface using its photocatalytic activity. Catalysts. 2019;9:383. doi: 10.3390/catal9040383. [DOI] [Google Scholar]
- Zhao Y. Xue W. Sun W. et al., Highly efficient twinned MnxCd1-xS homojunction photocatalyst modified by noble metal-free Ni12P5 for H2 evolution under visible light. Int. J. Hydrogen Energy. 2023;48:31161. doi: 10.1016/j.ijhydene.2023.04.215. [DOI] [Google Scholar]
- Hoang A. T. Pandey A. Chen W. H. et al., Hydrogen Production by Water Splitting with Support of Metal and Carbon-Based Photocatalysts. ACS Sustain. Chem. Eng. 2023;11:1221. doi: 10.1021/acssuschemeng.2c05226. [DOI] [Google Scholar]
- Xu Y. Gong Y. Ren H. et al., Insight into enhanced photocatalytic H2 production by Ni(OH)2-decorated ZnxCd1-xS nanocomposite photocatalysts. J. Alloys Compd. 2018;735:2551. doi: 10.1016/j.jallcom.2017.11.388. [DOI] [Google Scholar]
- Bai T. Shi X. Liu M. et al., A metal-organic framework-derived Zn1-xCdxS/CdS heterojunction for efficient visible light-driven photocatalytic hydrogen production. Dalton Trans. 2021;50:6064. doi: 10.1039/d1dt00667c. [DOI] [PubMed] [Google Scholar]
- Chen M. Huang X. Chen C. Hou W. Xu Y. M-Dependent activity of MCo2O4 spinels for water splitting and H2 production on Zn0.5Cd0.5S under visible light. Appl. Catal., B. 2021;298:120469. doi: 10.1016/j.apcatb.2021.120469. [DOI] [Google Scholar]
- Dong J. Fang W. Xia W. Lu Q. Zeng X. Facile preparation of ZnxCd1−xS/ZnS heterostructures with enhanced photocatalytic hydrogen evolution under visible light. RSC Adv. 2021;11:21642. doi: 10.1039/d1ra03195c. [DOI] [PMC free article] [PubMed] [Google Scholar]
- Yuan Y. J. Chen D. Yu Z. T. Zou Z. G. Cadmium sulfide-based nanomaterials for photocatalytic hydrogen production. J. Mater. Chem. A. 2018;6:11606. doi: 10.1039/c8ta00671g. [DOI] [Google Scholar]
- Fermín D. J. Ponomarev E. A. Peter L. M. A Kinetic Study of CdS Photocorrosion by Intensity Modulated Photocurrent and Photoelectrochemical Impedance Spectroscopy. J. Mater. Chem. A. 1999;473:192. doi: 10.1016/S0022-0728(99)00109-6. [DOI] [Google Scholar]
- Wang L. Wang W. Shang M. Yin W. Sun S. Zhang L. Enhanced photocatalytic hydrogen evolution under visible light over Cd1-xZnxS solid solution with cubic zinc blend phase. Int. J. Hydrogen Energy. 2010;35:19. doi: 10.1016/j.ijhydene.2009.10.084. [DOI] [Google Scholar]
- Bao N. Shen L. Takata T. Domen K. Self-templated synthesis of nanoporous CdS nanostructures for highly efficient photocatalytic hydrogen production under visible light. Chem. Mater. 2008;20:110. doi: 10.1021/cm7029344. [DOI] [Google Scholar]
- Peng W. Q. Cong G. W. Qu S. C. Wang Z. G. Synthesis and photoluminescence of ZnS:Cu nanoparticles. Opt. Mater. 2006;29:313. doi: 10.1016/j.optmat.2005.10.003. [DOI] [Google Scholar]
- Sivula K. Mott-Schottky analysis of photoelectrodes: Sanity checks are needed. ACS Energy Lett. 2021;6:2549. doi: 10.1021/acsenergylett.1c01245. [DOI] [Google Scholar]
- Oros-Ruiz S. Hernández-Gordillo A. García-Mendoza C. Rodríguez-Rodríguez A. A. Gómez R. Comparative activity of CdS nanofibers superficially modified by Au, Cu, and Ni nanoparticles as co-catalysts for photocatalytic hydrogen production under visible light. J. Chem. Technol. Biotechnol. 2016;91:2205. doi: 10.1002/jctb.4992. [DOI] [Google Scholar]
- Mir F. A. Chattarjee I. Dar A. A. Asokan K. Bhat G. M. Preparation and characterizations of cadmium sulfide nanoparticles. Optik. 2015;126:1240. doi: 10.1016/j.ijleo.2015.03.022. [DOI] [Google Scholar]
- Rodic D. Spasojevic V. Bajorek A. Similarity of Structure Properties of Hg1-xMnxS and Cd1-xMnxS (Structure Properties of HgMnS and CdMnS) J. Magn. Magn. Mater. 1996;152:159. doi: 10.1016/0304-8853(95)00435-1. [DOI] [Google Scholar]
- Sowa H. On the mechanism of the pressure-induced wurtzite- to NaCl-type phase transition in CdS: An X-ray diffraction study. Solid State Sci. 2005;7:73. doi: 10.1016/j.solidstatesciences.2004.10.011. [DOI] [Google Scholar]
- Shannon R. D. Revised Effective Ionic Radii and Systematic Studies of Interatomic Distances in Halides and Chalcogenides. Acta Crystallogr. 1976;A32:751. doi: 10.1107/S0567739476001551. [DOI] [Google Scholar]
- Shannon R. D. Prewitt C. T. Effective ionic radii in oxides and fluorides. Acta Crystallogr. 1969;B25:925. doi: 10.1107/S0567740869003220. [DOI] [Google Scholar]
- Scott S. D. Barnes H. L. Sphalerite-wurtzite equilibria and stoichiometry. Geochim. Cosmochim. Acta. 1972;36:1275. doi: 10.1016/0016-7037(72)90049-X. [DOI] [Google Scholar]
- Meng X. M. Liu J. Jiang Y. et al., Structure- and size-controlled ultrafine ZnS nanowires. Chem. Phys. Lett. 2003;382:434. doi: 10.1016/j.cplett.2003.10.093. [DOI] [Google Scholar]
- Tauc J. Grigorovici R. Vancu A. Optical Properties and Electronic Structure of Amorphous Germanium. Phys. Status Solidi B. 1966;15:627. doi: 10.1002/pssb.19660150224. [DOI] [Google Scholar]
- Kubelka P. Munk F. An Article on Optics of Paint Layers. Fuer Tekn. Physik. 1931;12:593–593. [Google Scholar]
- Li D. Liu Y. de la Mata M. et al, Strain-induced spatially indirect exciton recombination in zinc-blende/wurtzite CdS heterostructures. Nano Res. 2015;8:3035. doi: 10.1007/s12274-015-0809-8. [DOI] [Google Scholar]
- Ullah S. Bouich A. Ullah H. Mari B. Mollar M. Comparative study of binary cadmium sulfide (CdS) and tin disulfide (SnS2) thin buffer layers. Sol. Energy. 2020;208:637. doi: 10.1016/j.solener.2020.08.036. [DOI] [Google Scholar]
- D'Amico P. Calzolari A. Ruini A. Catellani A. New energy with ZnS: Novel applications for a standard transparent compound. Sci. Rep. 2017;7:16805. doi: 10.1038/s41598-017-17156-w. [DOI] [PMC free article] [PubMed] [Google Scholar]
- Marschall R. Semiconductor composites: Strategies for enhancing charge carrier separation to improve photocatalytic activity. Adv. Funct. Mater. 2014;24:2421. doi: 10.1002/adfm.201303214. [DOI] [Google Scholar]
- Cheng L. Xiang Q. Liao Y. Zhang H. CdS-Based photocatalysts. Energy Environ. Sci. 2018;11:1362. doi: 10.1039/c7ee03640j. [DOI] [Google Scholar]
- Klyuev V. G. Volykhin D. V. Ovchinnikov O. V. Sergey I. Pokutnyi Relationship between structural and optical properties of colloidal CdxZn1−xS quantum dots in gelatin. J. Nanophotonics. 2016;10(3):033507. doi: 10.1117/1.JNP.10.033507. [DOI] [Google Scholar]
- Dong J. Fang W. Xia W. Lu Q. Zeng X. Facile preparation of ZnxCd1−xS/ZnS heterostructures with enhanced photocatalytic hydrogen evolution under visible light. RSC Adv. 2021;11(35):21642–21650. doi: 10.1039/d1ra03195c. [DOI] [PMC free article] [PubMed] [Google Scholar]
- Shang Y. Wang C. Yan C. Jing F. Roostaeinia M. Wang Y. Chen G. Lv C. An Efficient and Multifunctional S-Scheme Heterojunction Photocatalyst Constructed by Tungsten Oxide and Graphitic Carbon Nitride: Design and Mechanism Study. J. Colloid Interface Sci. 2023;634:195–208. doi: 10.1016/J.JCIS.2022.12.039. [DOI] [PubMed] [Google Scholar]
- Kindig N. B. Spicer W. E. Band Structure of Cadmium Sulfide – Photoemission Studies. Phys. Rev. 1964;138:561. doi: 10.1103/PhysRev.138.A561. [DOI] [Google Scholar]
- Huang Y. Zhang Z. Ma F. Chu P. K. Dong C. Wei X. First-principles calculation of the band structure, electron states, and optical properties of Cr-doped ZnS double-wall nanotubes. Comput. Mater. Sci. 2015;101:1. doi: 10.1016/j.commatsci.2015.01.011. [DOI] [Google Scholar]
- Arriaga L. G. Fernández A. M. Determination of flat band potential and photocurrent response in (Cd,Zn)S used in photoelectrolysis process. Int. J. Hydrogen Energy. 2002;27:27. doi: 10.1016/S0360-3199(01)00084-2. [DOI] [Google Scholar]
- Maeda K. Photocatalytic water splitting using semiconductor particles: History and recent developments. J. Photochem. Photobiol., C. 2011;12:237. doi: 10.1016/j.jphotochemrev.2011.07.001. [DOI] [Google Scholar]
- Kaur M. Nagaraja C. M. Template-Free Synthesis of Zn1-xCdxS Nanocrystals with Tunable Band Structure for Efficient Water Splitting and Reduction of Nitroaromatics in Water. ACS Sustain. Chem. Eng. 2017;5:4293. doi: 10.1021/acssuschemeng.7b0032581. [DOI] [Google Scholar]
- Shu D. Wang H. Wang Y. et al., Composition dependent activity of Fe1−xPtx decorated ZnCdS nanocrystals for photocatalytic hydrogen evolution. Int. J. Hydrogen Energy. 2017;42:20888. doi: 10.1016/j.ijhydene.2016.12.037. [DOI] [Google Scholar]
- Wang L. Wang W. Shang M. Yin W. Sun S. Zhang L. Enhanced photocatalytic hydrogen evolution under visible light over Cd1-xZnxS solid solution with cubic zinc blend phase. Int. J. Hydrogen Energy. 2010;35:19. doi: 10.1016/j.ijhydene.2009.10.084. [DOI] [Google Scholar]
Associated Data
This section collects any data citations, data availability statements, or supplementary materials included in this article.
Supplementary Materials
Data Availability Statement
Data will be made available from the corresponding author upon request.


