Abstract
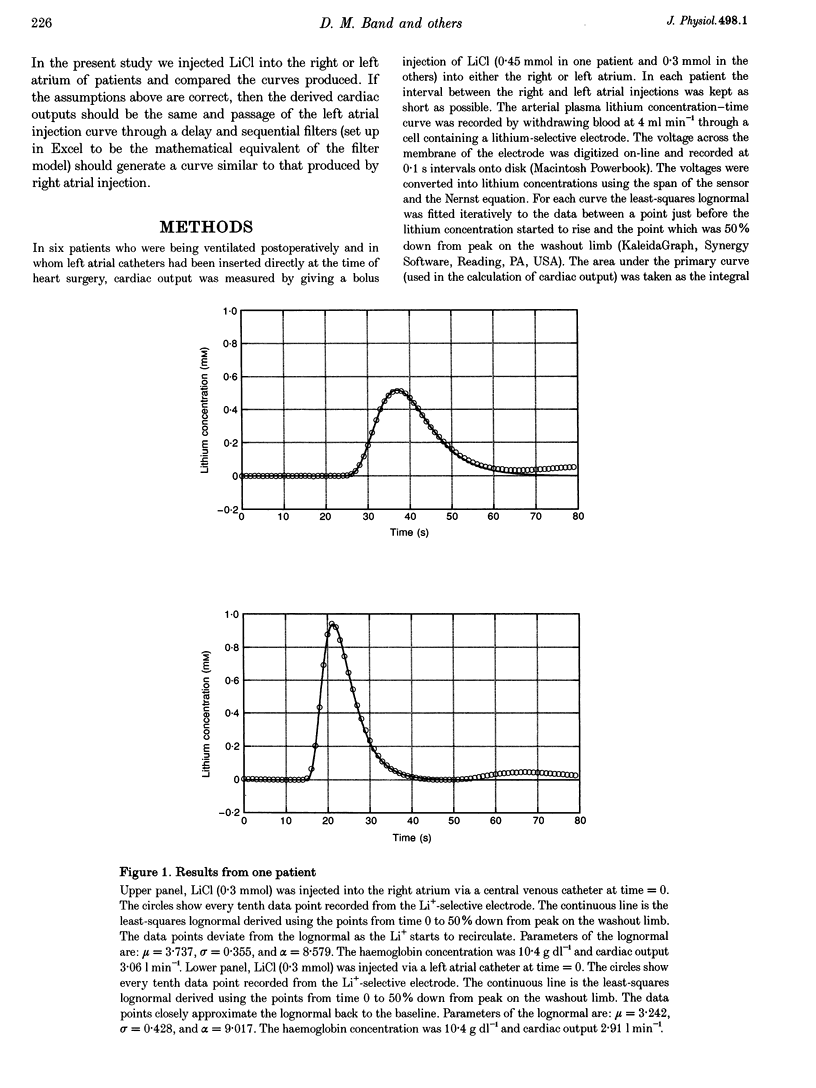
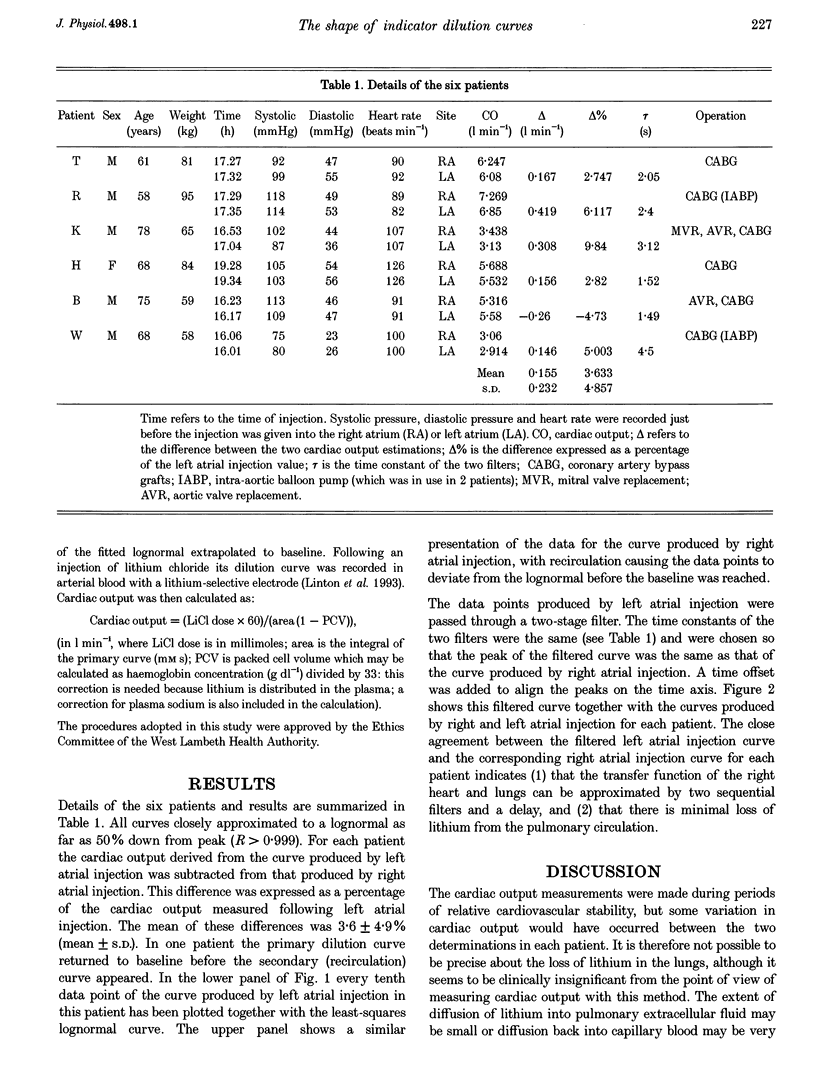
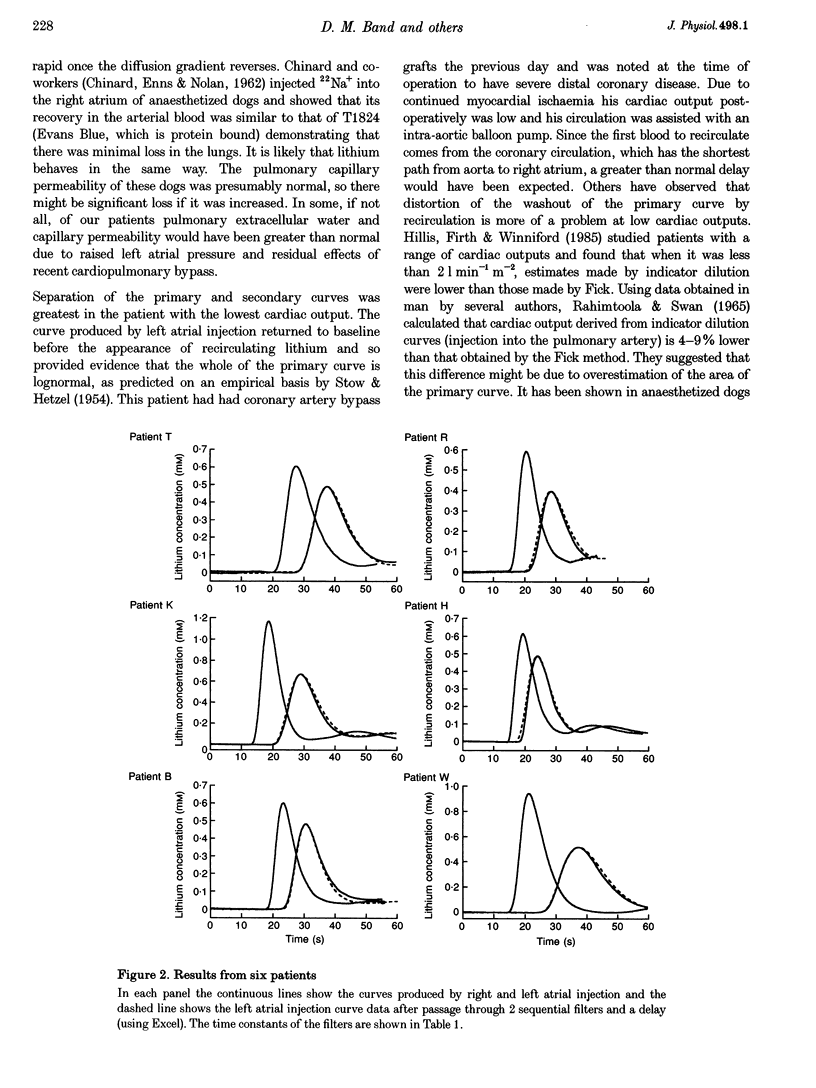
1. In six patients arterial plasma lithium concentration-time curves were recorded following injection of lithium chloride into the right or left atrium. 2. Lognormal curve fitting was used to derive the areas under the first pass dilution curves. 3. Subjecting the curves produced by left atrial injection to a delay and sequential filtering produced curves that closely approximated those produced by right atrial injection. 4. We conclude that the transfer function of the right heart and lungs is equivalent to a delay and sequential filtering, that the primary indicator dilution curve is closely approximated by a lognormal curve and that loss of lithium in the lungs following right atrial injection is clinically insignificant.
Full text
PDF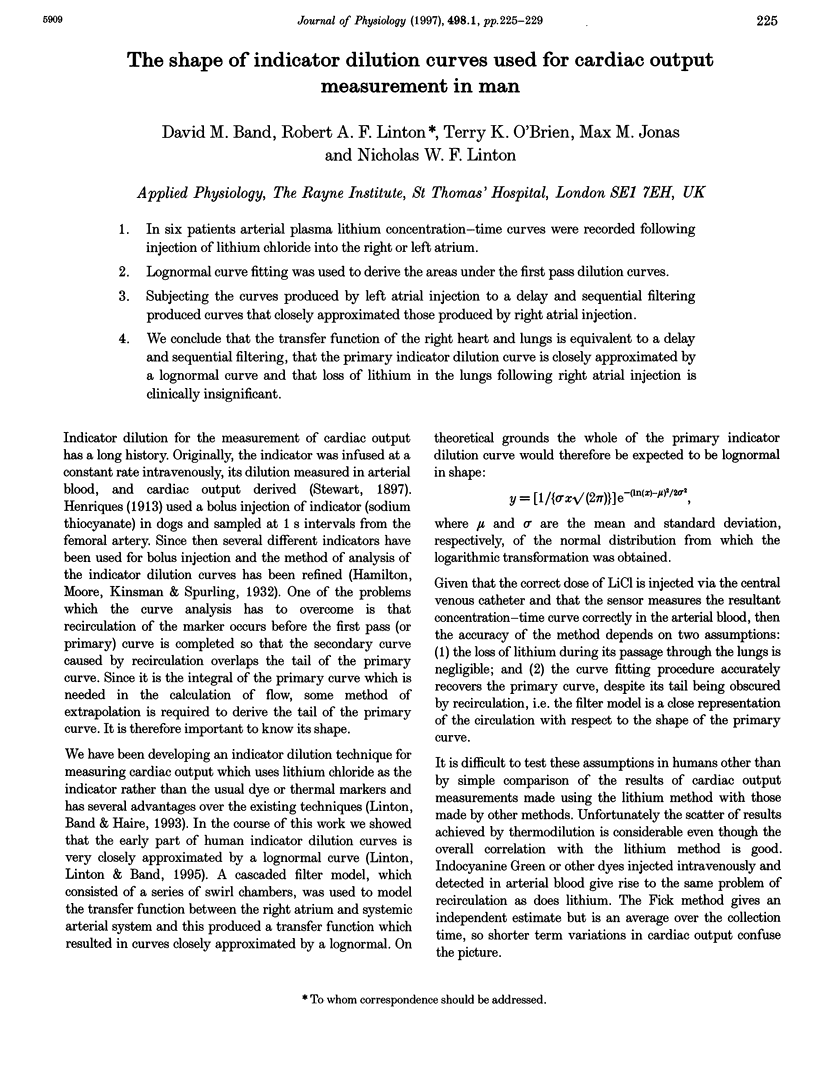
Selected References
These references are in PubMed. This may not be the complete list of references from this article.
- CHINARD F. P., ENNS T., NOLAN M. F. Indicator-dilution studies with "diffusible" indicators. Circ Res. 1962 Mar;10:473–490. doi: 10.1161/01.res.10.3.473. [DOI] [PubMed] [Google Scholar]
- Hillis L. D., Firth B. G., Winniford M. D. Analysis of factors affecting the variability of Fick versus indicator dilution measurements of cardiac output. Am J Cardiol. 1985 Nov 1;56(12):764–768. doi: 10.1016/0002-9149(85)91132-4. [DOI] [PubMed] [Google Scholar]
- Homer L. D., Moss G. S., Herman C. M. Errors in measurement of cardiac output with dye-dilution curves in shock. J Appl Physiol. 1969 Jul;27(1):101–103. doi: 10.1152/jappl.1969.27.1.101. [DOI] [PubMed] [Google Scholar]
- Linton R. A., Linton N. W., Band D. M. A new method of analysing indicator dilution curves. Cardiovasc Res. 1995 Dec;30(6):930–938. [PubMed] [Google Scholar]
- Oriol A., Sekelj P., McGregor M. Limitations of indicator-dilution methods in experimental shock. J Appl Physiol. 1967 Oct;23(4):605–608. doi: 10.1152/jappl.1967.23.4.605. [DOI] [PubMed] [Google Scholar]
- RAHIMTOOLA S. H., SWAN H. J. CALCULATION OF CARDIAC OUTPUT FROM INDICATOR-DILUTION CURVES IN THE PRESENCE OF MITRAL REGURGITATION. Circulation. 1965 May;31:711–718. doi: 10.1161/01.cir.31.5.711. [DOI] [PubMed] [Google Scholar]
- STOW R. W., HETZEL P. S. An empirical formula for indicator-dilution curves as obtained in human beings. J Appl Physiol. 1954 Sep;7(2):161–167. doi: 10.1152/jappl.1954.7.2.161. [DOI] [PubMed] [Google Scholar]
- Stewart G. N. Researches on the Circulation Time and on the Influences which affect it. J Physiol. 1897 Nov 20;22(3):159–183. doi: 10.1113/jphysiol.1897.sp000684. [DOI] [PMC free article] [PubMed] [Google Scholar]
- Weaver P. C., Bailey J. S., Redding V. J. A comparative study of cardiac outputs in dogs using indicator-dilution curves and an electromagnetic flowmeter. Cardiovasc Res. 1970 Apr;4(2):248–252. doi: 10.1093/cvr/4.2.248. [DOI] [PubMed] [Google Scholar]


