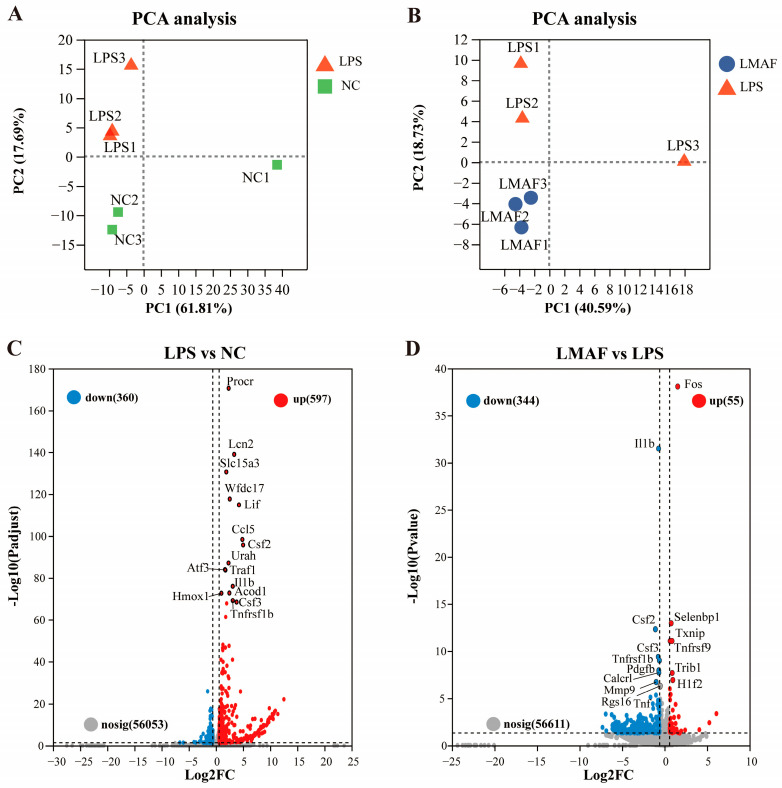
Figure 3.
Impact of LMAF on the transcriptome of RAW264.7 cells in co-cultures. (A) PCA plot of LPS versus the normal control (NC) group. (B) PCA plot comparing the LMAF and LPS group. (C) Volcano plot highlighting significant DEGs between LPS and NC. (D) Volcano plot of significant DEGs between LMAF and LPS. Red dots represent upregulated DEGs; blue dots represent downregulated DEGs (n = 3).

