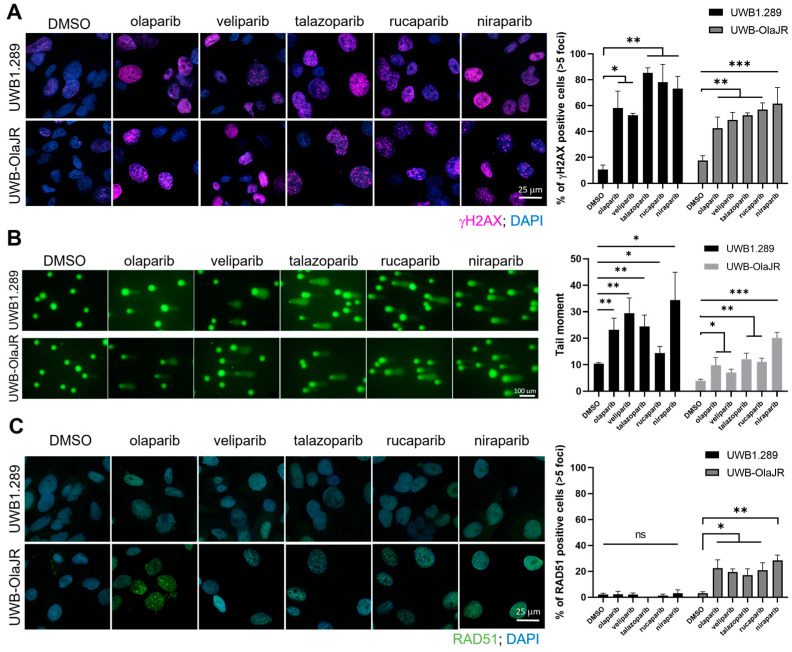
Figure 3.
UWB-OlaJR shows varying degrees of resistance to different PARPis. Cells were treated with PARPis for 48 h, and the concentrations for each PARPi used are detailed in the Section 2. (A) Immunofluorescence staining of γH2AX foci was performed to examine the DSBs. Representative images were taken at ×60 magnification. Cells with >5 γH2AX foci were counted as γH2AX-positive cells. The percentage of γH2AX-positive cells is plotted. (B) Cells were treated with alternative PARPis, and its effect on DSBs was measured by neutral comet assay. Cell events were quantified using CometScore 2.0 software. The percentage of tail DNA is plotted. (C) Immunofluorescence staining of RAD51 foci was performed to examine the functionality of homologous recombination repair. Representative images were taken at ×60 magnification. Cells with >5 RAD51 foci were counted as RAD51-positive cells. The percentage of RAD51-positive cells is plotted. All experiments were repeated in triplicate. Data are shown as mean ± SD. ***, p < 0.001; **, p < 0.01; * p < 0.05; ns, not significant.

