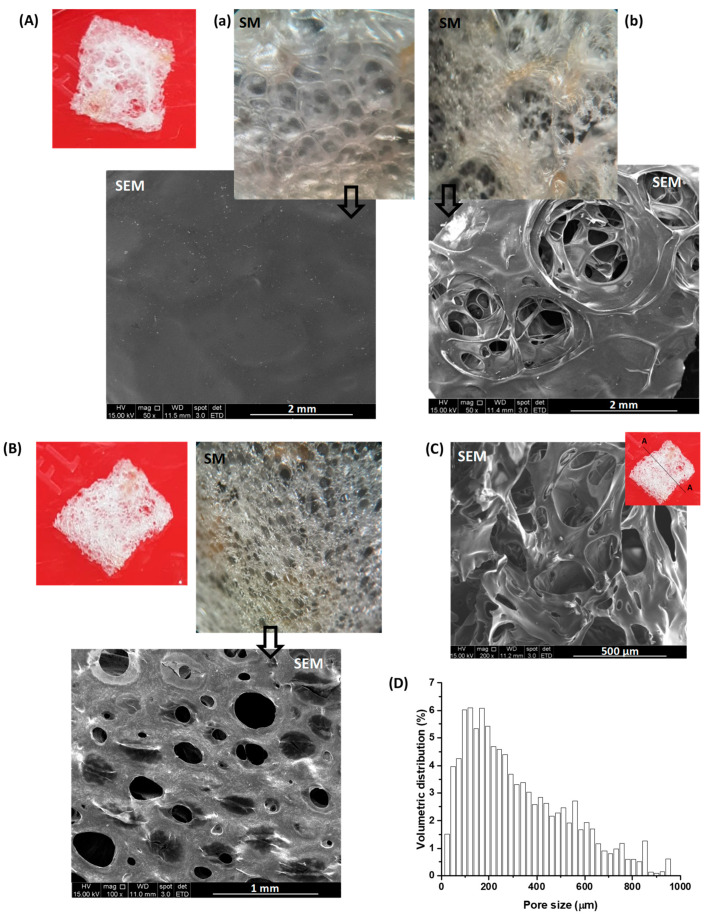
Figure 5.
Digital images (red background), stereoscopic microscope images (SM, 20×), and scanning electron microscopy images (SEM, 50×–100×) of the (A) upper and (B) lower surfaces of the porous three-dimensional structure. (C) SEM image (200×) of cross-section (Section A-A in the detail of the digital image). (D) Volumetric pore size distribution by micro-CT.

