Figure 8.
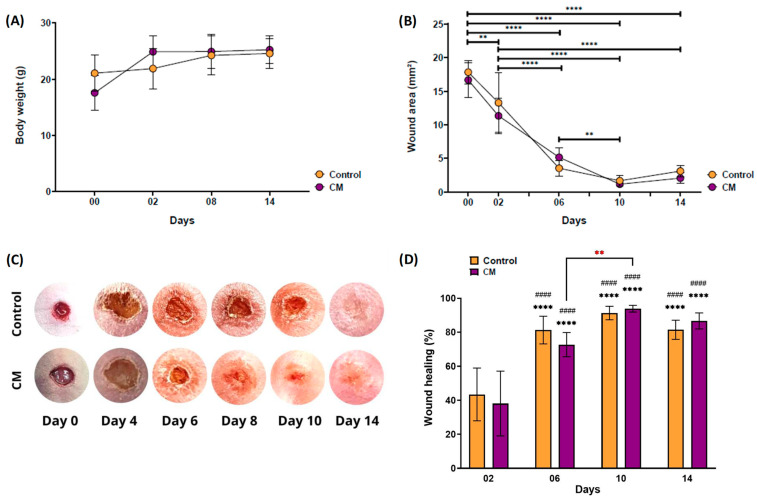
(A) Monitoring of the body weight of the mice after inducing skin lesions and applying a cell membrane (CM group) compared to the control group (without membrane). (B) Measurement of the wound area over 14 days for both the cell membrane and control groups. (C) Representative photos showing the wound healing process during the days of the experiment and (D) percentage of wound healing (WHR, %). The control group consisted of healthy female Hairless mice (n = 8), with their wound covered by a “Blood stop” bandaid but with no membrane applied. The CM group included Hairless mice with wounds covered by the tested cell membrane (CM, n = 8). In the graph plot D, (*) indicates statistical differences where all groups on days D06, D10, and D14 were compared to the control group on day D02. (#) Indicates statistical difference where all groups on days D06, D10, and D14 were compared to the membrane-treated (CM) group on day D02. The red asterisk represents the statistical difference between the membrane-treated groups (CM) at D06 and D10. Data are shown as mean ± standard deviation. **/## p < 0.01; ****/#### p < 0.0001.

