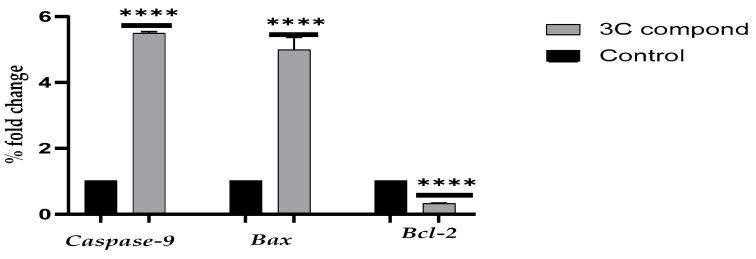
Figure 7.
Quantitative real-time PCR analysis of caspase-9 Bax and Bcl-2 expression levels in HCT-116 cells following 24 h treatment with the IC50 concentration of the drug, normalized to β-actin. Bars indicate mean ± SE. Statistical significance was assessed using an unpaired t test, with **** p < 0.0001 compared to untreated cells (control).

