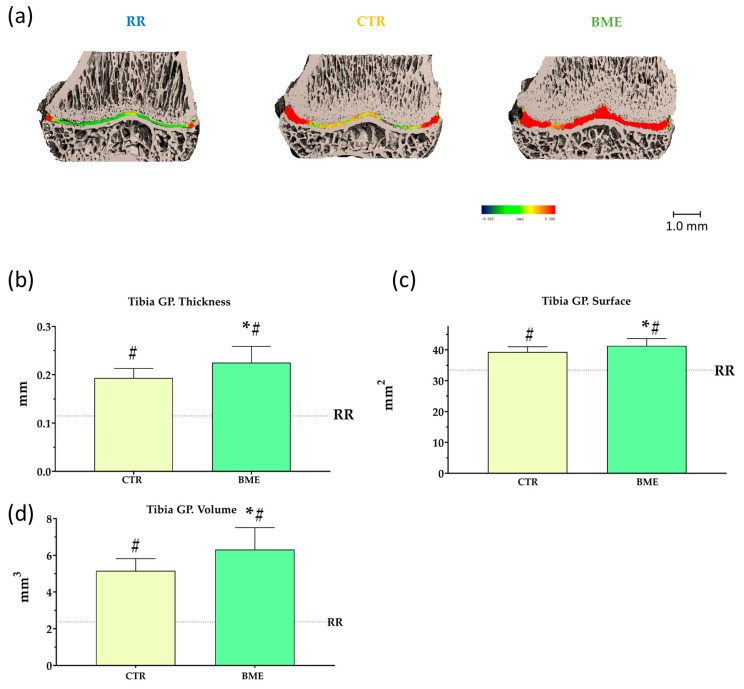
Figure 8.
Representative scans (a) and micro-CT parameters (b–d) of the tibia growth plate upon completion of the two-week refeeding period. Data represented as mean ± SD. BME—group refed with the diet supplemented with whey protein concentrate enriched in bovine milk exosomes; CTR—group refed with the control diet; GP—growth plate; and RR—restricted group. * p-value < 0.05 compared to the control refeeding group (CTR); # p-value < 0.05 compared to the restricted group (RR).

