Abstract
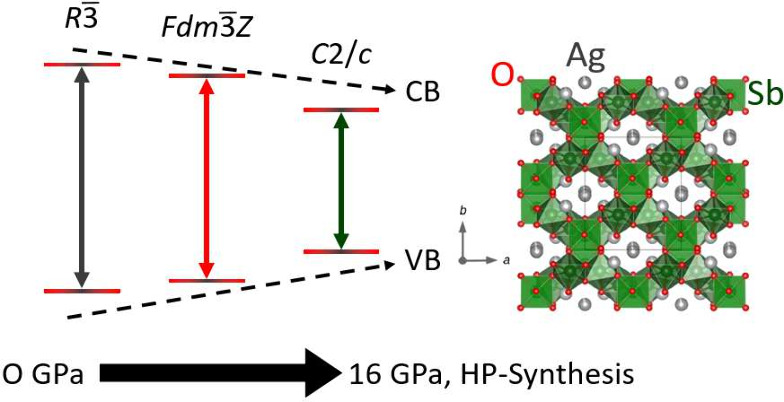
We report on a new polymorph of silver antimonate AgSbO3 discovered with the use of high-pressure high-temperature synthesis at 16 GPa and 1380 °C. The crystal structure is determined from X-ray powder diffraction, and we find this new high-pressure phase crystallizes in monoclinic space group C2/c with the following values: a = 8.4570(3) Å, b = 9.8752(3) Å, c = 8.9291(3) Å, β = 91.1750(12)°, and V = 745.56(4) Å3. We synthesized the high-pressure (16 GPa) AgSbO3 phase from the ilmenite phase as a precursor. This high-pressure monoclinic AgSbO3 consists of a three-dimensional network of corner- and edge-sharing SbO6 octahedra with channels along the c-direction containing Ag atoms. We also synthesize AgSbO3 in the defect pyrochlore phase at 4 GPa from the same ilmenite precursor and compare the Raman spectra and the cation–anion bonding of all three AgSbO3 phases. The absence of a cubic perovskite form of AgSbO3 even at pressures of ≤16 GPa is likely due to the covalency of the Sb–O bonds and the moderate electronegativity of Ag+. Hybridization of Ag d and O p orbitals results in a variation of Ag–O distances that correlates with the band gap, which is in qualitative agreement with the density of states around the Fermi level from our density functional calculations. We compare AgSbO3 with other ABX3 compounds to elucidate the dependence of the structure on the constituent atoms.
Short abstract
High-pressure (HP) AgSbO3 syntheiszed at 16 GPa and 1380 °C exhibits a monolinic C2/c space group. Compared with the ilmenite (R3̅) phase and defect pyrochlore (Fd3̅mZ), we find a smaller band gap in the monoclinic HP-AgSbO3 phase (C2/c). In all three phases, our density functional theory calculations reveal that the top of the valence band and the bottom of the conduction band are dominated by contributions from strong Ag−O hybridized states.
Introduction
Perovskite-related structures have unique
electronic and magnetic
properties, making them of great interest for technological applications.
Typically, for a composition of ABX3, where A and B are
cations and X is an anion, the stability of the perovskite structure
is evaluated on the basis of the relative sizes of the ions,1 and many stable compositions for X = O2– or F– are known.2,3 While many
ABO3 oxides crystallize in the cubic perovskite structure
with corner-sharing BO6 octahedra and a B–O–B
linkage of 180°, the A+Sb5+O3 compounds do not form structures having Sb–O–Sb groups
with 180° linkages due to the covalency of the Sb–O bond.4 All known A+Sb5+O3 compounds crystallize in structures in addition to the cubic perovskite,
including ilmenite and defect pyrochlore, when synthesized under ambient
pressure. We note that the cubic perovskite structure can be stabilized
for  for x ≥ 0.65 under
high-pressure conditions,5 where the average
oxidation state of Sb is less than 5+ with the addition of Ba2+. However, here we limit the discussion to materials with
only one element on the A site and one element on the B site, specifically
antimonates for which B = Sb5+, and the stability of the
cubic perovskite structure.
The cubic perovskite structure can
be stabilized under high-pressure
conditions for many  compounds for which B = Ge and Sn, where
the size of the Ge4+ or Sn4+ ion is comparable
to that of Sb5+.6 In addition,
under high-pressure high-temperature conditions, the orthorhombic
perovskite structure was reported for the antimonate NaSbO3 at 10.5 GPa and 1150 °C.7 However,
even under higher pressures, we are unable to stabilize a perovskite
structure for AgSbO3 but instead found a new monoclinic
phase was stabilized at 16 GPa and 1380 °C. A number of AgSbO3 phases are reported in the literature, including an ilmenite
phase synthesized through ion exchange under ambient conditions8 and a defect pyrochlore phase synthesized at
0.3–6.5 GPa.9
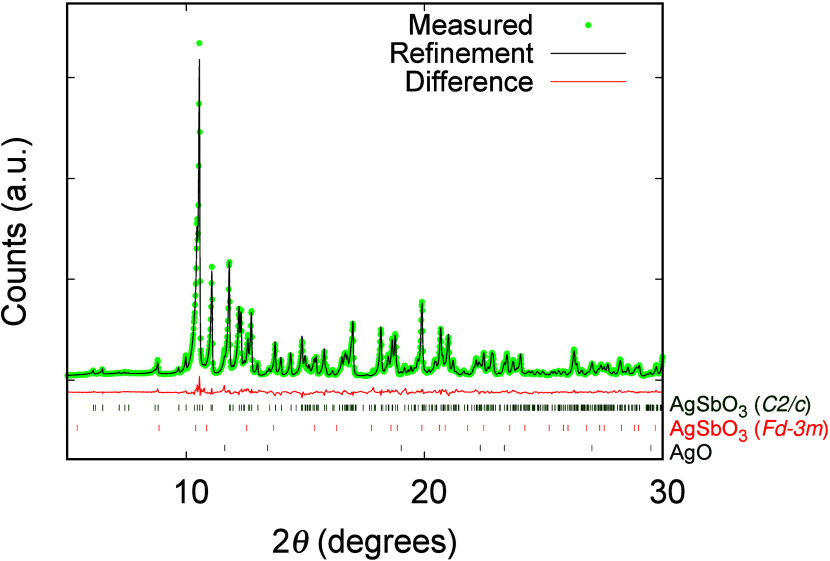
Non-perovskite ABO3 oxides can have advantageous properties, such as high ionic conductivity due to the low-symmetry structures that allow hopping between ionic sites,10 which is absent in perovskite-type ABO3. This monoclinic AgSbO3 phase crystallizes in space group C2/c, and its X-ray diffraction pattern and Rietveld refinement are shown in Figure 1. We compare the crystal structure, optical conductivity, and Raman spectra of this high-pressure monolinic phase with those of the defect pyrochlore and ilmenite phases of AgSbO3.
Figure 1.
Scattered
X-ray diffraction intensities of high-pressure monoclinic
AgSbO3 (C2/c symmetry)
[with AgO and AgSbO3 as impurity phases with 0.9 and 0.5 wt
%, respectively] at 298 K under ambient conditions as a function of
2θ. The observed pattern (blue circles) measured in Debye–Scherrer
geometry, the best combined Rietveld fit profiles (red line), and
the difference curves between the observed and calculated profiles
(gray line) are shown. The peak positions of the three phases are
presented as blue lines below. The square root of the intensity is
shown to better visualize the smaller reflections.
In the monoclinic AgSbO3 phase, we find a combination of corner- and edge-sharing SbO6 octahedra forming a three-dimensional network with channels running along the c-direction, while the Ag atoms occupy positions inside these channels. We compare Ag–O and Sb–O coordination in all of these phases and discuss the absence of a cubic perovskite phase even under high-pressure high-temperature conditions in relation to the covalency of the Sb–O bond and the moderate electronegativity of Ag+. We contrast our findings with those of other perovskite oxides with a similar ionic size at the B site and those of the cubic perovskite NaSbO3 phase stabilized at high pressure.
Results and Discussion
The crystal structure of monoclinic AgSbO3 (Figure 2) is fully ordered and can best be described as follows. Corner-sharing Sb2O10 double octahedra form a subunit with an inversion center inside (Figure 3). The two upper and lower vertices of the double octahedra are connected to the edge of neighboring SbO6 octahedra, which are thus turned by 90°. In addition, the four outer corners of the double octahedra are corner shared with two corner-sharing pairs of additional SbO6 octahedra that are connected to other Sb2O10 double octahedra thus forming a rigid three-dimensional porous network with interconnected pseudohexagonal channels along the c-direction. The results of the Rietveld refinement are listed in Table 1, and the atomic positions are listed in Table S1.
Figure 2.
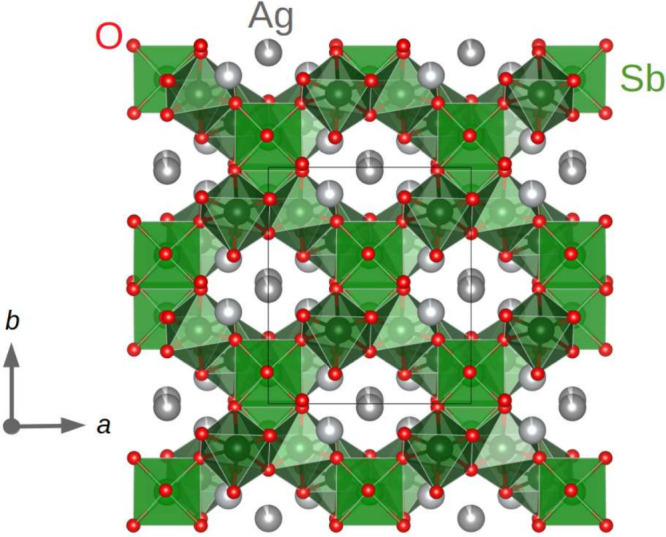
Projection of the crystal structure of monoclinic AgSbO3 (C2/c symmetry) in the a–b plane.
Figure 3.
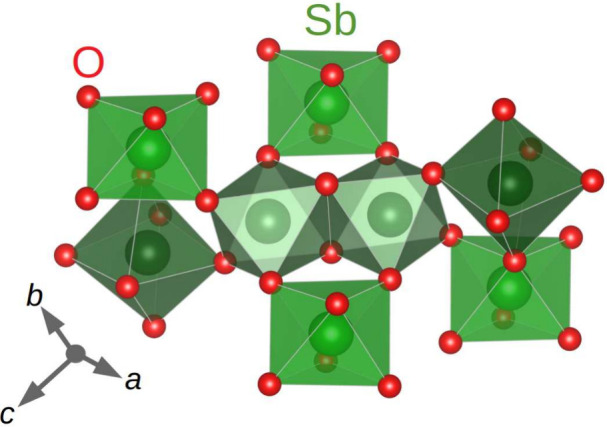
Connectivity of SbO6 octahedra forming the framework in the crystal structure of monoclinic AgSbO3.
Table 1. Crystallographic and Rietveld Refinement Data of High-Pressure Monoclinic AgSbO3a.
| cell mass (g mol–1) | 3366(11) |
| crystal system | monoclinic |
| space group | C2/c |
| wavelength (Å) | 0.55941 |
| a (Å) | 8.4570(3) |
| b (Å) | 9.8752(3) |
| c (Å) | 8.9291(3) |
| α (deg) | 90 |
| β (deg) | 91.1750(12) |
| γ (deg) | 90 |
| V (Å3) | 745.56(4) |
| T (K) | 298 |
| Z | 8 |
| Dcalc (g cm–3) | 7.420 |
| Rwp (%) | 6.02 |
| Rp (%) | 4.37 |
| RBragg (%) | 1.73 |
| measured starting angle 2θ (deg) | 2 |
| measured final angle 2θ (deg) | 112 |
| starting angle 2θ used (deg) | 4 |
| final angle 2θ used (deg) | 62 |
| step width (deg 2θ) | 0.015 |
| time (h) | 12 |
Rwp, Rp, and RBragg are as defined in TOPAS version 7.11
To gain insight into this crystal structure, we examined the ABO3 oxides, where the B cation prefers octahedral coordination. The most stable structure depends on the ionic or covalent nature of the bonding. In the case of covalent bonding, we must consider the σ-bonding and the π-bonding between the B and O ions. Ionic forces between the atoms tend to favor corner-sharing cubic perovskite structure and have been suggested to explain the stability of the perovskite phases. AGeO3 and ASnO3 compounds crystallize in the cubic perovskite phase, some stable only under high pressure.12,13 The Shannon radii of octahedrally coordinated Ge4+ and Sn4+ on the B site are 0.67 and 0.83 Å, respectively, while Sb5+ has a radius of 0.74 Å.6 With A+ and A2+ ions with similar radii available among group I and group II elements, we must consider effects beyond the cation size to explain the lack of stability of a cubic perovskite structure of A+SbO3.
The electronegativity of Sb5+ relative to that of Ge4+ and Sn4+ ions can explain the edge sharing found in ASbO3. We find that edge sharing of octahedra is preferred in all ASbO3 compounds synthesized under ambient conditions. In monoclinic AgSbO3, we find the Sb–O–Sb group with linkages of 94.1° and 119.8°, and this deviation from a linear Sb–O–Sb group is consistent with strong covalent Sb–O bonding. Considering covalent bonding, linear Sb–O–Sb bonding would require the same O 2p orbital to participate in σ-bonding to two Sb atoms. However, the covalent bonding would be much stronger if different anionic orbitals were to participate in the bonding with each of the cations. This is consistent with the observation of edge-sharing octahedra with a Sb–O–Sb angle of 90° found in many ASbO3 compounds.
Via application of a pressure of 10.5 GPa, NaSbO3 can be stabilized as an orthorhombically distorted perovskite, where the Na+ and [SbO3]− ionic interactions allow for the stabilization of the perovskite phase.7 In monoclinic AgSbO3, we go to an even higher pressure of 16 GPa and might expect a similar Ag+ and [SbO3]− interaction to facilitate the stability of the perovskite structure. However, the instability of the perovskite phase even at these pressures is likely due the weaker ionic interaction of [SbO3]− with Ag+ than with Na+. As discussed below, the more covalent nature of Ag+ is evidenced by the color of the samples relative the Ag+–O distance as discussed below, and we find a variation in the oxygen coordination of Ag+. The Ag atoms are located in the channels and are interconnected in a three-dimensional fashion with Ag–Ag distances between 2.866 and 3.085 Å (Figure 4); such a network is expected to facilitate Ag+ hopping, resulting in significant ionic conductivity.
Figure 4.
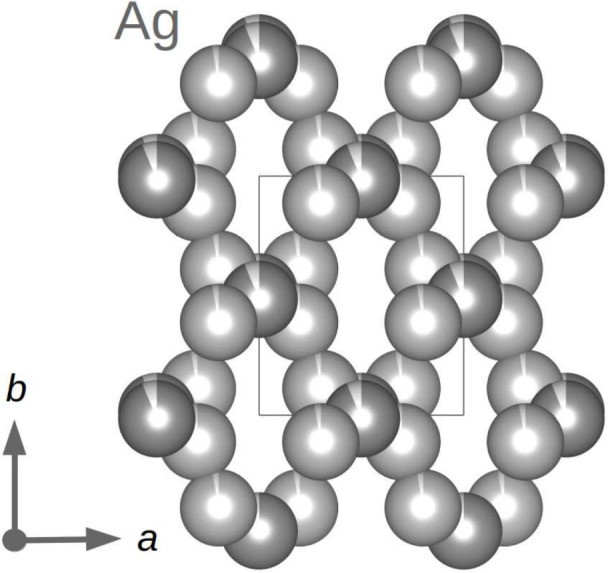
Three-dimensional silver network in the crystal structure of monoclinic AgSbO3 (C2/c symmetry).
We examine the Ag–O distances in all three AgSbO3 phases and find a shortest Ag–O distance of 2.220 Å in monoclinic AgSbO3. The shortest Ag–O distances in the ilmenite and defect pyrochlore phases are 2.414 and 2.555 Å, respectively. These distances are consistent with the correlation between the Ag–O distance and color in various Ag oxides discussed previously.4 The O coordination around the Ag atoms, which can also effect the band gap due to the change in orbital overlap, varies between the ilmenite and defect pyrochlore phases and is highly asymmetric in monoclinic AgSbO3. We find a variation in the Ag+–O bonding with the Ag1 site having one O atom with a distance of 2.220 Å and two O atoms with a distance of 2.514 Å in a triangular planar configuration. For the Ag2 site, we find O atoms at distances of 2.393, 2.414, and 2.498 Å in a deformed trigonal pyramidal configuration. This uneven bonding can originate from the coordinated covalency of oxygen atoms that results in deformation of the 4d10 orbital of the Ag+ ion due to 4d–5s hybridization.
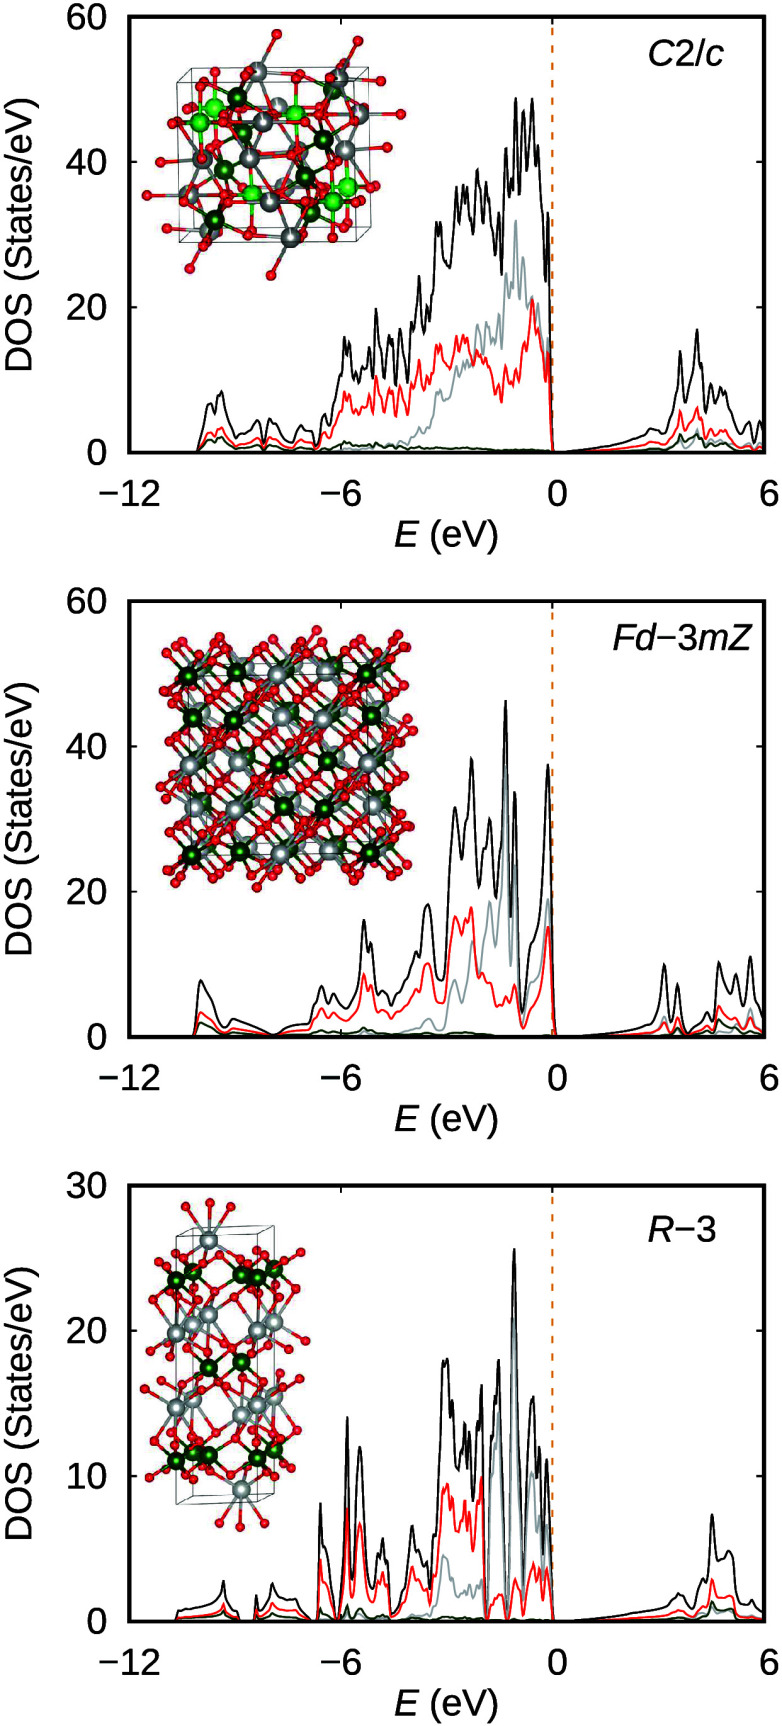
From density functional calculations, we look at the density of states (DOS), shown in Figure 5, for all three AgSbO3 phases. From the partial contribution of Ag, Sb, and O, we indeed find that Ag and O contribute heavily below the Ef. Also, we find the peaks for both Ag and O appear at similar energies, supporting the scenario for suspected strong hybridization based on the short Ag–O distance. This is especially evident for the ilmenite and defect pyrochlore phases with single Ag and O sites. Upon examination of the band structure in Figure S3, the density of bands below the Fermi level increases in the C2/c symmetry due to the increased number of unique sites, with two Ag sites, two Sb sites, and five O sites. We examine the partial DOS for the monoclinic AgSbO3 phase in Figure S4 considering the shortest distance between cations and oxygen anions. We find the shortest distance between the nearest O atoms and Ag1, Ag2, Sb1, and Sb2 corresponds to peaks in the partial DOS. The O4 site seems to be strongly bonded to the Ag1 site and has a short distance of 2.221 Å. However, this distance does not necessarily reflect the strongest bonding between Ag1 and O4, because O4 is strongly bonded to the Sb2 atom as part of the surrounding O atoms in an octahedral arrangement. This results in deformation of the core 4d10 orbital from a sphere to an ellipsoid, allowing for shorter bonds along the shorter directions of the ellipsoid. Such a variation in Ag–O bonds was previously reported for Ag+ salts and discussed for the cubic Im3̅ phase of AgSbO3.4 The color of AgSbO3 samples reflects the band gap, Eg, where an Eg of <1.7 eV results in black compounds and an Eg of >3.0 eV results in white compounds.4
Figure 5.
Density of states of all three AgSbO3 phases: ilmenite (synthesized at ambient pressure, R3̅ symmetry), defect pyrochlore (synthesized at 4 GPa, Fd3̅mZ symmetry), and monoclinic phase (synthesized at 16 GPa, C2/c symmetry). The total density of states (black) and partial contributions from Ag (gray), Sb (green), and O (red) are highlighted.
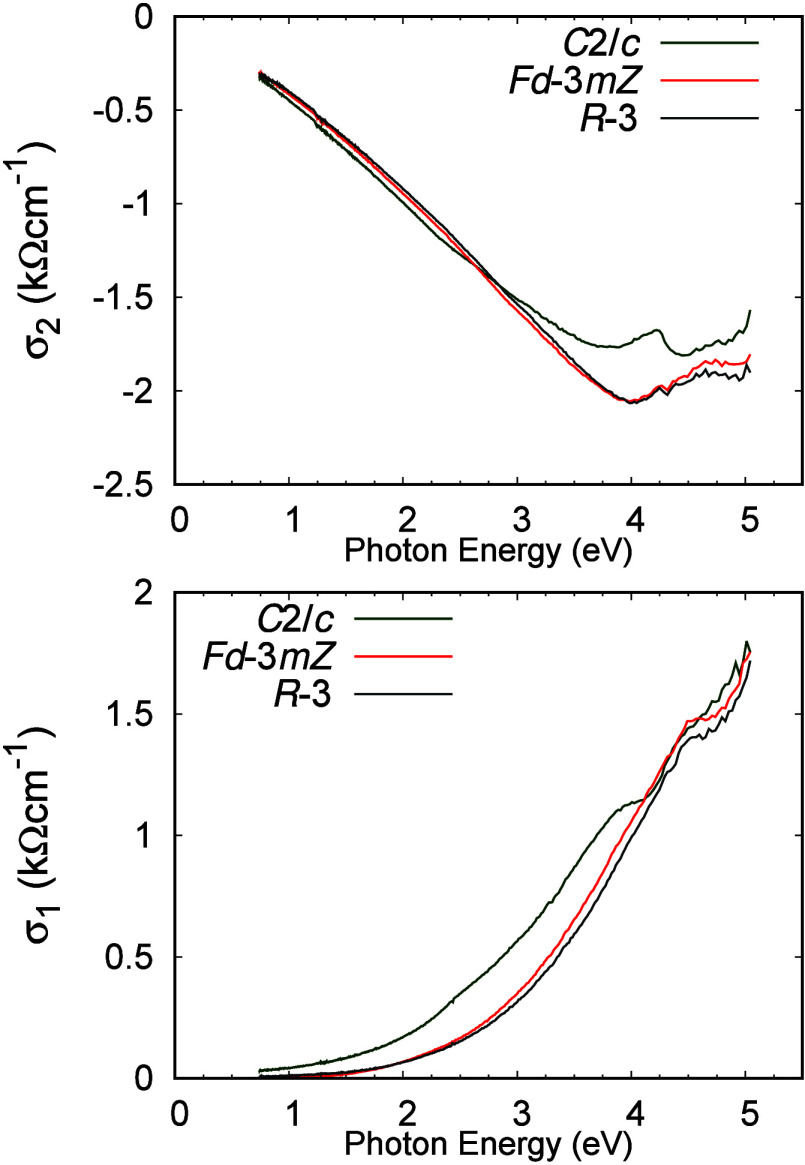
The change in band gap with Ag–O bond length can be understood if nonbonding core orbitals, 4d or hybridized 4d–5s of the Ag+, contribute to the top of the valence band and 5s orbitals contribute to the bottom of the conduction band. Hybridization will increase the 4d levels relative to the 5s levels, thus decreasing the gap between the 4d-like bands and the 5s-like bands. Reduction of the Ag–O bond length requires greater 4d–5s hybridization; therefore, we find a decrease in the energy gap with a decrease in the Ag–O bond length. This is consistent with our findings from ellipsometry measurements, shown in Figure 6, for determining the optical conductivities of all three AgSbO3 phases. The ilmenite phase has the largest band gap of 2.50 eV, which is slightly reduced to 2.30 eV in the defect pyrochlore phase and much reduced to 1.90 eV in the monoclinic AgSbO3 phase. This supports the strong 4d–5s hybridization of the Ag+ suspected from the Ag–O bonding based on the crystal structure. The band structure in Figure S3 shows a band above the Fermi level that is separated by only 100 meV from the valence band. However, this band may be optically inactive, or its position appears closer to the Fermi level due to the functionals used, which results in an underestimation of the optical band gap. Considering the number of distinct sites in the monoclinic C2/c phase, this band likely comes from a cluster of atoms that extends across the unit cell. We utilize a molecular orbital approach to examine this possibility as demonstrated in Figure S5 and find the band above the Fermi level is dominated by Ag and O contributions. This confirms the Ag–O hybridization suspected on the basis of atomic distances and the change in the observed optical band gap.
Figure 6.
Real (σ1) and imaginary (σ2) parts of the electrical conductivity of AgSbO3, ilmenite (synthesized at ambient pressure, R3̅ symmetry), defect pyrochlore (synthesized at 4 GPa, Fd3̅mZ symmetry), and the monoclinic phase (synthesized at 16 GPa, C2/c symmetry).
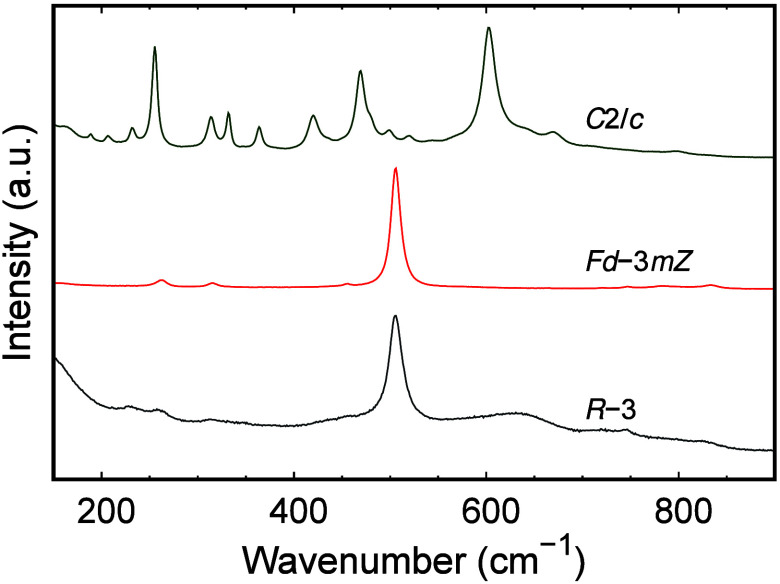
We examine the Raman spectra of all three phases in Figure 7, measured without any polarizers in the range of 100–800 cm–1. We find similar spectra for the ilmenite and defect pyrochlore phases with a strong peak at ∼500 cm–1. For the monoclinic AgSbO3 phase, we find richer spectra with many peaks, where the strongest peaks are at 250 and 600 cm–1. The strongly bonded Sb–O network is likely to affect the Raman spectra in all three phases. We find only one Sb site and one O site in the ilmenite and defect pyrochlore phases, whereas we have two Sb sites and five O sites in the monoclinic AgSbO3 phase.
Figure 7.
Raman spectra of different phases of AgSbO3, ilmenite (synthesized at ambient pressure, R3̅ symmetry), defect pyrochlore (synthesized at 4 GPa, Fd3̅mZ symmetry), and the monoclinic phase (synthesized at 16 GPa, C2/c symmetry).
The large number of distinct Sb and O sites and the low symmetry in the monoclinic AgSbO3 phase (C2/c) are consistent with the large number of optical modes observed in the Raman spectra. With 30 independent atoms in the primitive unit cell, we have 3n = 90 phonon modes in monoclinic AgSbO3, with three accoustic modes and 87 optical phonon modes, where 45 are Raman active optical phonons. Denoted by the irreducible representations, for the monoclinic C2/c phase of AgSbO3 with the C2h(2/m) point group we have 21 Ag and 24 Bg modes.14 To characterize the Raman spectra in more detail and identify the different optical modes, calculations and further polarization-dependent Raman experiments will be needed. The low symmetry of the crystal structure and the large change in the DOS below the Fermi level may result in the good performance of this material for thermoelectric applications.
Conclusion
We find a new polymorph of AgSbO3 stabilized using a high-pressure, high-temperature synthesis technique at 16 GPa and 1380 °C from an ilmenite phase as the starting material. The crystal structure is determined from XRPD to be in the monoclinic C2/c space group with two Sb sites and five oxygen sites. This monoclinic AgSbO3 consists of a three-dimensional network of corner- and edge-sharing SbO6 octahedra with channels along the c-direction containing two crystallographically distinct Ag cations. Upon comparison with AgSbO3 in the defect pyrochlore phase synthesized at 4 GPa and the ilmenite phase, we find edge-sharing SbO6 octahedra in all three phases.
The Ag–O bonding varies in all three phases, which is expected to change the degree of 4d–5s hybridization and the resulting band gap. Indeed, we find a reduction in the optical band gap in our ellipsometry measurement with a shorter Ag–O distance, with the smallest band gap of 1.90 eV in monoclinic AgSbO3. The Raman spectra were recorded for all three AgSbO3 phases, and we find a rich spectrum for monoclinic AgSbO3 with many peaks, which is consistent with increased number of Sb sites and O sites compared with the ilmenite and defect pyrochlore phase showing a single dominant peak. The absence of cubic perovskites in AgSbO3 even at pressures of ≤16 GPa is likely due to the covalency of the Sb–O bonds and the moderate electronegativity of Ag+. The Ag–Ag distances and the channels within the Sb–O network will make this phase an ideal candidate for the exploration of ionic conductivity in the future.
Experimental Section
Materials
We synthesized a monoclinic AgSbO3 sample employing a high-pressure high-temperature (HPHT) technique with a Walker-type multianvil module. Polycrystalline ilmenite AgSbO3 was used as a precursor, obtained by ion exchange in solution from NaSbO3 and AgNO3 as a yellowish green color. The ilmenite AgSbO3 powder was placed in a Pt capsule and subjected to HPHT treatment at 5 GPa and 800 °C for 1 h, followed by quenching to room temperature and slow decompression, to obtain the red defectitve pyrochlore phase color as reported.4 At 16 GPa and 1380 °C, we obtained a new high-pressure phase of AgSbO3 (monoclinic AgSbO3) with a reddish-brown color at room temperature after slow decompression. The pressure and temperature were calibrated prior to the experiments by recording the resistance changes of bismuth and thermocouple calibration runs, respectively. We used the dense pellet obtained from this treatment for X-ray powder diffraction and Raman spectroscopy measurement.
Raman Measurements
Raman scattering measurements were performed using a Horiba Jobin-Yvon LabRAM monochromator, equipped with a grating of 1800 grooves/mm and a Peltier cooled CCD camera. We used the 532 nm line of a diode laser at a power of 1 mW, and the spot diameter was ∼10 μm on the sample using a 50× microscopic objective for both focusing and collection of light. The spectral resolution was ∼1 cm–1 in this study. A Semrock RazorEdge filter was used to block the elastically scattered laser light, where the cutoff energy was 79 cm–1.
Ellipsometry Measurements
Pressed pellets of all three phases were polished with fine sand paper (down to 2000 grit), and an ellipsometry measurement was performed on the polished surface. Room-temperature ellipsometric spectra were recorded angles of incidence of 50°, 60°, and 70° in a spectral range from 0.75 to 5 eV using a commercial ellipsometer (J. A. Woollam M-2000FI). The data collected using an angle of incidence of 70° are analyzed herein. The real and imaginary parts of the dielectric constant are converted into optical conductivity.15
Band Structure Calculations
Electronic structure calculations were performed within the framework of density functional theory (DFT) as implemented in Wien2k.16 The generalized gradient approximation with the PBE parametrization17 was used. The basis set size was set to RmtKmax = 7.0, and the irreducible Brillouin zone (BZ) was sampled with a 15 × 12 × 15 k mesh. The monoclinic crystal structure (C2/c space group with a = 8.4570 Å, b = 9.8752 Å, c = 8.9291 Å, and β = 91.175°) was used for the high-pressure phase. The structures previously reported for the illmenite8 [a = 10.0696(1) Å, and c = 31.5599(1) Å] and defect pyrochlore18 [a = 19.3588(1) Å] phases were used to calculate their band structure. The muffin tin radius (RMT) for each of the elements for all three phases was set as follows: 1.25 Å for Ag, 1.04 Å for Sb, and 0.90 Å for O. The irreducible Brillouin zone (BZ) was sampled with 20 × 20 × 20 and 25 × 25 × 25 k meshes for the ilmenite phase and defect pyrochlore phase, respectively. An RmtKmax of 7.0 was used for both phases.
Laboratory X-ray Powder Diffraction (XRPD)
XRPD measurements for structure determination under ambient conditions were performed by using a Stoe Transmission Powder Diffraction System (STADI-P) equipped with a Ge(111) Johann-type primary beam monochromator from STOE & CIE with Ag Kα1 radiation (λ = 0.55941 Å) that was equipped with an array of three linear position-sensitive MYTHEN 1K detectors from Dectris Ltd. with a 2θ opening ange of ∼18° for each. The finely powdered sample of AgSbO3 was placed in a 0.3 mm glass capillary (Hilgenberg glass No. 14) and spun during measurement or to improve particle statistics. The measurement in the 2θ range from 2.0° to 112° with a 2θ step width of 0.015° took 12 h (Figure 1).
For indexing of the powder pattern of monoclinic AgSbO3 at 298 K, TOPAS version 7 (Coelho, 2018) was used. Indexing was performed by iterative use of single-value decomposition (LSI) (Coelho, 2003), leading to a C-centered monoclinic unit cell with the following unit cell parameters: a = 8.4570(3) Å, b = 9.8752(3) Å, c = 8.9291(3) Å, and β = 91.1750(12)° [V = 745.56(4) Å3]. From the observed extinction rules, the most probable space group could be determined to be Cc, and C2/c from which the latter was confirmed after structure determination. The number of formula units per unit cell (Z) could be estimated to be 8 from volume increments. The peak profiles and precise lattice parameters of the powder patterns of monoclinic gSbO3 were first determined by a Pawley fit (Pawley, 1981) using the fundamental parameter (FP) approach of TOPAS (Cheary, Coelho, and Cline, 2005). Beforehand, the instrumental peak profile was determined using the NIST LaB6 SRM 660C line profile standard (Black et al., 2020) by applying the Thompson–Cox–Hastings pseudo-Voigt function (Thompson et al., 1987) using four line profile parameters. For the modeling of the background, Chebychev polynomials were employed. The refinement converged quickly.
The structure of high-pressure monoclinic AgSbO3 was determined in an iterative manner by the global optimization method of simulated annealing in real space by using TOPAS (Coelho, 2007). From the formula, space group, and number of formula units per unit cell, the following numbers of atoms in the asymmetric unit are purely arithmetically possible: two or three silver cations, two or three antimony cations, and between five and nine oxygen anions, totalling a minimum of nine and a maximum of 15 independent ions. Not all combinations make crystallographic sense. The following strategy was applied. The simulated annealing was started with a minimum of nine independent ions with the occupancy included in the simulated annealing process and a maximum number of 46 electrons, equivalent to the number for Ag+ or Sb5+. In that way, oxygen atoms could be clearly distinguished from the strong scatterers. In addition, atoms close to a special position were constrained to that position, and the occupancy factor was adjusted accordingly. A global minimum was repeatedly found with nine atoms in the asymmetric form. The distinction between the isoelectronic Ag+ or Sb5+ cations was based on their coordination spheres.
The structure giving the best fit to the data in space group C2/c was validated by Rietveld refinement (Rietveld, 1969) using TOPAS. Small amounts of AgO (∼0.9 wt %) and the AgSbO3 starting phase (∼0.5 wt %) were detected and included as additional phases in the Rietveld refinement. The final Rietveld refinement is shown in Figure 1. Agreement factors are listed in Table 1. The atomic coordinates are listed in Table 1, and a selection of intramolecular distances and bond angles are listed in Tables S2 and S3, respectively. The crystallographic data have been deposited at the ICSD under CSD No. 2370184 (Table 2).
Table 2. Comparison of Ag–O Distances in the Three AgSbO3 Phases.
| atoms | distance (Å) |
|---|---|
| C2/c | |
| (Ag1–O3) × 2 | 2.514 |
| Ag1–O4 | 2.220 |
| Ag2–O1 | 2.689 |
| Ag2–O2 | 2.498 |
| Ag2–O3 | 2.414 |
| Ag2–O5 | 2.393 |
| Fd3̅mZ | |
| (Ag1–O1) × 6 | 2.556 |
| R3̅ | |
| (Ag1–O1) × 3 | 2.414 |
| (Ag1–O1) × 3 | 2.706 |
Acknowledgments
The authors thank George Sawatzky for valuable discussion, Claus Muehle at MPI-FKF for supplying the AgSbO3 ilmenite sample, Uwe Engelhardt and Frank Falkenberg for their support during the high-pressure synthesis experiments, Christine Stefani for help with X-ray diffraction measurements, and Hsiang-Hsi (Sean) Kung for help with ellipsometry measurements.
Supporting Information Available
The Supporting Information is available free of charge at https://pubs.acs.org/doi/10.1021/acs.inorgchem.4c03021.
Atomic positions, atomic distances, bond angles, and DFT calculations for high-pressure AgSbO3 (PDF)
Open access funded by Max Planck Society.
The authors declare no competing financial interest.
Supplementary Material
References
- Goldschmidt V. M.Geochemische Verteilungsgesetze der Elemente, Vol. 1; Dybwad, 1923. [Google Scholar]
- Peña M. A.; Fierro J. L. Chemical structures and performance of perovskite oxides. Chem. Rev. 2001, 101, 1981–2018. 10.1021/cr980129f. [DOI] [PubMed] [Google Scholar]
- Chadwick A.; Strange J.; Ranieri G. A.; Terenzi M. Studies of ionic motion in perovskite fluorides. Solid State Ionics 1983, 9, 555–558. 10.1016/0167-2738(83)90294-1. [DOI] [Google Scholar]
- Hong H.-P.; Kafalas J.; Goodenough J. Crystal chemistry in the system MSbO3. J. Solid State Chem. 1974, 9, 345–351. 10.1016/0022-4596(74)90093-0. [DOI] [Google Scholar]
- Kim M.; McNally G. M.; Kim H.-H.; Oudah M.; Gibbs A. S.; Manuel P.; Green R. J.; Sutarto R.; Takayama T.; Yaresko A.; et al. Superconductivity in (Ba, K) SbO3. Nat. Mater. 2022, 21, 627–633. 10.1038/s41563-022-01203-7. [DOI] [PMC free article] [PubMed] [Google Scholar]
- Shannon R. D. Revised effective ionic radii and systematic studies of interatomic distances in halides and chalcogenides. Acta crystallographica section A: crystal physics, diffraction, theoretical and general crystallography 1976, 32, 751–767. 10.1107/S0567739476001551. [DOI] [Google Scholar]
- Mizoguchi H.; Woodward P. M.; Byeon S.-H.; Parise J. B. Polymorphism in NaSbO3: structure and bonding in metal oxides. J. Am. Chem. Soc. 2004, 126, 3175–3184. 10.1021/ja038365h. [DOI] [PubMed] [Google Scholar]
- Nalbandyan V. B.; Avdeev M.; Pospelov A. A. Ion exchange reactions of NaSbO3 and morphotropic series MSbO3. Solid state sciences 2006, 8, 1430–1437. 10.1016/j.solidstatesciences.2006.05.017. [DOI] [Google Scholar]
- Sleight A. AgSbO3: Chemical characterization and structural considerations. Mater. Res. Bull. 1969, 4, 377–380. 10.1016/0025-5408(69)90094-4. [DOI] [Google Scholar]
- Ramadass N. ABO3-type oxides—Their structure and properties—A bird’s eye view. Materials Science and Engineering 1978, 36, 231–239. 10.1016/0025-5416(78)90076-9. [DOI] [Google Scholar]
- Coelho A. A. TOPAS and TOPAS-Academic: an optimization program integrating computer algebra and crystallographic objects written in C++. J. Appl. Crystallogr. 2018, 51, 210–218. 10.1107/S1600576718000183. [DOI] [Google Scholar]
- Ross N. L.; Akaogi M.; Navrotsky A.; Susaki J.-i.; McMillan P. Phase transitions among the CaGeO3 polymorphs (wollastonite, garnet, and perovskite structures): Studies by high-pressure synthesis, high-temperature calorimetry, and vibrational spectroscopy and calculation. Journal of Geophysical Research: Solid Earth 1986, 91, 4685–4696. 10.1029/JB091iB05p04685. [DOI] [Google Scholar]
- Grzechnik A.; Hubert H.; McMillan P.; Petuskey W. SrGeO3-SrTiO3 perovskites: high-pressure synthesis, structure, and dielectric properties. Integr. Ferroelectr. 1997, 15, 191–198. 10.1080/10584589708015710. [DOI] [Google Scholar]
- Kroumova E.; Aroyo M.; Perez-Mato J.; Kirov A.; Capillas C.; Ivantchev S.; Wondratschek H. Bilbao Crystallographic Server: Useful Databases and Tools for Phase-Transition Studies. Phase Transitions 2003, 76, 155–170. 10.1080/0141159031000076110. [DOI] [Google Scholar]
- Tompkins H.; Irene E. A.. Handbook of ellipsometry; William Andrew, 2005. [Google Scholar]
- Blaha P.; Schwarz K.; Madsen G. K.; Kvasnicka D.; Luitz J.. wien2k. An augmented plane wave+ local orbitals program for calculating crystal properties; 2001.
- Perdew J. P.; Burke K.; Wang Y. Generalized gradient approximation for the exchange-correlation hole of a many-electron system. Phys. Rev. B 1996, 54, 16533. 10.1103/PhysRevB.54.16533. [DOI] [PubMed] [Google Scholar]
- Schrewelius N. Röntgenuntersuchung der Verbindungen NaSb(OH)6, NaSbF6, NaSbO3 und gleichartiger Stoffe. Zeitschrift für anorganische und allgemeine Chemie 1938, 238, 241–254. 10.1002/zaac.19382380209. [DOI] [Google Scholar]
Associated Data
This section collects any data citations, data availability statements, or supplementary materials included in this article.


