

Abstract
The population pharmacokinetics (PK) of quizartinib and its pharmacologically active metabolite AC886 have been previously described in healthy volunteers (HV) and relapsed/refractory (R/R) FLT3‐internal‐tandem‐duplication‐positive (FLT3‐IDT‐positive) acute myeloid leukemia (AML) patients receiving quizartinib monotherapy. In this analysis, we characterized the population PK of quizartinib and AC886 in newly diagnosed FLT3‐ITD‐positive AML patients receiving standard induction and consolidation chemotherapy as background treatment, using data from the Phase 3 QuANTUM‐First trial and 12 earlier studies. Quizartinib PK were best described by a three‐compartment model with sequential zero‐ and first‐order absorption and first‐order elimination. A two‐compartment model with first‐order metabolite formation and first‐order elimination best fitted AC886 data. The PK of both moieties showed large interindividual variability (approximately 70% coefficient of variation for systemic clearances). The use of strong cytochrome P450 3A (CYP3A) inhibitors had the largest impact on exposure, increasing the steady‐state area under the curve during the dosing interval (AUCss) by 1.8‐fold. This is consistent with observations in HV and R/R AML patients and confirms the need for dose adjustments during coadministration. A novel finding in newly diagnosed AML patients was the phase‐dependent change in steady‐state quizartinib exposure: dose‐normalized AUCss values were 0.6‐fold during induction, similar during consolidation, and 1.4‐fold during continuation compared to R/R AML patients receiving quizartinib monotherapy. The present analysis highlighted the comparison of quizartinib and AC886 PK between newly diagnosed AML patients and previously studied populations, informed dose modifications needed with strong CYP3A inhibitors, and supported the use of derived individual exposure metrics in separate exposure‐response analyses.
Study Highlights.
WHAT IS THE CURRENT KNOWLEDGE ON THE TOPIC?
The population pharmacokinetics (PK) of quizartinib and its active metabolite AC886 have been previously characterized in healthy volunteers and patients with relapsed/refractory (R/R) acute myeloid leukemia (AML) receiving quizartinib monotherapy.
WHAT QUESTION DID THIS STUDY ADDRESS?
What is the population PK of quizartinib and AC886 in newly diagnosed AML patients receiving quizartinib in addition to standard induction and consolidation chemotherapy, and followed by quizartinib maintenance monotherapy?
WHAT DOES THIS STUDY ADD TO OUR KNOWLEDGE?
Quizartinib steady‐state exposure in newly diagnosed AML patients varies across treatment phases (induction, consolidation, continuation). Other covariate effects were consistent with those found in the R/R population.
HOW MIGHT THIS CHANGE CLINICAL PHARMACOLOGY OR TRANSLATIONAL SCIENCE?
The study provides supportive evidence of the need for quizartinib dose adjustments in subgroups of newly diagnosed AML subjects.
INTRODUCTION
Acute myeloid leukemia (AML) is an aggressive heterogeneous cancer with poor prognosis. The Feline McDonough Sarcoma (FMS)‐like receptor tyrosine kinase 3 (FLT3), involved in the regulation of cell growth, differentiation, and survival, is frequently activated by genetic alterations or overexpressed in AML. 1 , 2 , 3 FLT3 activation by internal‐tandem duplication (ITD) is observed in 25% of the cases 4 , 5 , 6 , 7 and serves as an independent prognostic factor associated with increased relapse rate and reduced overall survival (OS). 1 , 8
Quizartinib is an oral, highly potent type II FLT3 inhibitor developed for the treatment of AML. Its pharmacologically active metabolite, AC886, formed and eliminated via cytochrome P450 3A (CYP3A)‐mediated metabolism, is also a potent and selective FLT3 inhibitor with similar activity as quizartinib. 9 , 10 In the Phase 3 QuANTUM‐R clinical trial, single‐agent quizartinib treatment resulted in improved OS in FLT3‐ITD‐positive patients with relapsed/refractory (R/R) AML, as compared to salvage chemotherapy. 11 Recently, the Phase 3 QuANTUM‐First trial demonstrated that the addition of quizartinib to standard induction and consolidation chemotherapy in newly diagnosed FLT3‐ITD‐positive AML patients, followed by continuation with quizartinib monotherapy for up to 3 years, resulted in improved OS compared to placebo (31.9 vs. 15.1 months; hazard ratio 0.78; 95% CI 0.62–0.98; p = 0.032). 12
The population pharmacokinetics (PK) of quizartinib and AC886 have been previously described in healthy volunteers and patients with R/R AML who received monotherapy of quizartinib in a pooled analysis from eight clinical studies. 13
The aim of the present analysis was to characterize the population PK of quizartinib and AC886 in newly diagnosed AML patients by pooling data from 12 previous studies and the recent Phase 3 QuANTUM‐First trial, where patients received quizartinib in combination with standard cytarabine‐anthracycline induction and cytarabine consolidation chemotherapy, and as maintenance monotherapy. Particular emphasis was put on assessing the impact of intrinsic and extrinsic factors on the PK parameters of both quizartinib and AC886.
METHODS
Clinical data
The data for the population PK analysis originated from a total of 13 clinical studies: nine Phase 1, two Phase 2, and two Phase 3 studies. All study protocols were approved by the institutional review board or ethics committee at each study site and the studies were conducted in accordance with Good Clinical Practice guidelines and adhered to the Declaration of Helsinki. All subjects provided written informed consent before any study procedures were undertaken. A summary of the clinical studies used in the analysis, including a short description, sample size, dose regimen, and PK sampling schedule, is provided in Table 1. Seven of these studies were used in the previous PK analysis in healthy volunteers and R/R AML patients. The additional studies included in the current work were three studies in Japanese patients, one study in subjects with hepatic impairment, one Phase 1 study in newly diagnosed AML patients, and QuANTUM‐First. The analysis data set included 14,160 quizartinib and 13,399 AC886 PK observations from 932 subjects.
TABLE 1.
Summary of the clinical studies included in the population PK analysis.
| Study ID | Phase | Population | Short description | Subjects a | Number of PK samples a | Quizartinib dose (formulation) | PK sampling | |
|---|---|---|---|---|---|---|---|---|
| Quizartinib | AC886 | |||||||
| AC220‐014 | 1 | Healthy subjects | Relative bioavailability and dose proportionality | 80 | 1526 | 1439 | Single dose of 60 mg (oral solution) or 30, 60, or 90 mg (tablet) | 0, 0.25, 0.5, 1, 2, 3, 4, 5, 6, 8, 12, 24, 36, 48, 72, 96, 120, 144, 168, 240, 312, 384 and 480 h post‐dose |
| AC220‐015 | 1 | Healthy subjects | DDI with ketoconazole and fluconazole | 89 | 1973 | 1572 | Single dose of 30 mg (tablet) | 0, 0.25, 0.5, 1, 2, 3, 4, 5, 6, 8, 12, 24, 36, 48, 72, 96, 120, 144, 168, 192, 216, 288, 360,432, and 504 h post‐dose |
| AC220‐018 | 1 | Healthy subjects | DDI with lansoprazole | 62 | 1423 | 1341 | Single dose of 30 mg (tablet) | 0, 0.25, 0.5, 1, 2, 3, 4, 5, 6, 8, 12, 24, 36, 48, 72, 96, 120, 144, 168, 192, 216, 288, 360, 432, and 504 h post‐dose |
| AC220‐016 | 1 | Healthy subjects and subjects with hepatic impairment | Hepatic impairment based on Child‐Pugh score b | 30 | 684 | 654 | Single dose of 30 mg (tablet) | 0, 0.25, 0.5, 1, 2, 3, 4, 5, 6, 8, 12, 24, 36, 48, 72, 96, 120, 144, 168, 192, 216, 288, 360, 432, and 504 h post‐dose |
| AC220‐A‐U105 | 1 | Healthy subjects and subjects with hepatic impairment | Hepatic impairment based on NCI‐ODWG c criteria | 12 | 181 | 183 | Single dose of 30 mg (tablet) | 0, 1, 2, 4, 6, 8, 12, 24, 48, 72, 96, 144, 216, 288, 360, 432, and 504 h post‐dose |
| 2689‐CL‐0005 | 1 | Newly diagnosed AML patients | Dose‐escalation study | 15 | 242 | 236 | Multiple daily doses of 40, 60, or 90 mg (oral solution) | 0, 1, 2, 4, and 8 h post‐dose (cycle 1 days 4 and 10). Predose samples on other days |
| 2689‐CL‐0011 | 1 | AML patients post hematopoietic stem cell transplant | Maintenance following transplantation for AML | 13 | 253 | 249 | Multiple daily doses of 30, 40, 60, or 90 mg (oral solution) | 0, 1, 2, 4, 6, and 24 h post‐dose (cycle 1 days 1 and 15). Less frequently, 1 or 2 samples, on other days |
| 2689‐CL‐2004 | 2 | R/R AML patients | Dose‐ranging study | 73 | 1156 | 1136 | Multiple daily doses of 30 or 60 mg (oral solution) | 0, 1, 2, 4, 6, and 24 h post‐dose (cycle 1 days 1 and 15). Less frequently, 1 or 2 samples, on other days |
| AC220‐A‐J101 | 1 | R/R AML Japanese patients | Dose‐escalation study | 15 | 408 | 397 | Multiple daily doses of 20 mg (tablet) | 0, 0.5, 1, 2, 4, and 6, hours postdose (cycle 1 days 1 and 15). Less frequently, 1 or 2 samples, on other days |
| AC220‐A‐J102 | 1b | Newly diagnosed AML Japanese patients | Dose‐ranging study in AML | 7 | 134 | 133 | Multiple daily doses of 20 or 40 mg (tablet) | 0, 0.5, 1, 2, 4, and 6, hours post‐dose (cycle 1 days 8 and 21). Less frequently, 1 or 2 samples, on other days |
| AC220‐A‐J201 | 2 | R/R AML Japanese patients | Dose‐ranging study | 38 | 732 | 703 | Multiple daily doses of 20, 30, or 60 mg (tablet) | 0, 1, 2, 4, 6, and 24 h post‐dose (cycle 1 days 1 and 15). Less frequently, 1 or 2 samples, on other days |
| QuANTUM‐R (AC220‐007) | 3 | R/R AML patients | Quizartinib monotherapy Phase 3 study | 239 | 3672 | 3553 | Multiple daily doses of 20, 30, or 60 mg (tablet) | 0, 1, 2, 4, 6, and 24 h post‐dose (cycle 1 days 1 and 15). Less frequently, 1 or 2 samples, on other days |
| QuANTUM‐First (AC220‐A‐U302) | 3 | Newly diagnosed AML patients | Quizartinib plus chemotherapy Phase 3 study | 259 | 1776 | 1803 | Multiple daily doses of 20, 30, 40, or 60 mg (tablet) | 0, 1, 2, 4, 6, 24 h postdose (cycle 1 days 8 and 21) Less frequently, 1 or 2 samples, on other days |
| Total | 932 | 14,160 | 13,399 | |||||
Abbreviations: AML, acute myeloid leukemia; DDI, drug–drug interaction; R/R, relapse/refractory.
Number of Subjects and PK samples included in the analysis.
Clinical scoring system assessing liver disease severity and prognosis.
National Cancer Institute‐Organ Dysfunction Working Group.
In QuANTUM‐First, 539 newly diagnosed AML patients aged 20–75 years were randomly assigned (1:1) to receive quizartinib or placebo in addition to standard AML chemotherapy. During the induction phase, patients received quizartinib/placebo plus intravenous cytarabine and anthracycline. Patients with remission could proceed to the consolidation phase to receive standard consolidation with high‐dose cytarabine plus quizartinib/placebo, allogeneic hematopoietic cell transplantation (allo‐HTC), or both. Finally, patients with blood count recovery entered the continuation phase with single‐agent quizartinib or placebo for up to 3 years. 12 Dose adjustments due to adverse events or concomitant use of strong CYP3A inhibitors were applied throughout the trial duration. 12
Bioanalytical methods
Plasma concentrations of quizartinib and AC886 were measured by using one of two validated liquid chromatography–tandem mass spectrometry methods, developed by BASi (Bioanalytical Systems, West Lafayette, IN, USA). For the first method, the lower limit of quantification (LLOQ) was 2 ng/mL and for the second it was 0.5 ng/mL. The methods were cross‐validated and proven to have similar precision and accuracy. 13
Model development
The population analyses were carried out in NONMEM version 7.4.4 (ICON Development Solutions, Ellicott City, Maryland), 14 using the first‐order conditional estimation method with interaction for parameter estimation. The standard errors of the parameter estimates were computed using the MATRIX = S option in NONMEM. Visual predictive checks (VPCs) were generated with the PsN toolkit, 15 , 16 , 17 version 4.9.0. PsN was also used to execute the covariate search algorithm. Data management and further post‐processing of NONMEM output was carried out in R version 3.5.3. 18
The starting point for quizartinib structural model building was the model previously developed in R/R AML patients. 13 This was a three‐compartment model with sequential zero‐order and first‐order absorption, an absorption lag time, and linear elimination from the central compartment.
A sequential approach was used to develop the AC886 model, where individual quizartinib PK parameters were fixed to their Empirical Bayes Estimates from the final quizartinib model. The starting point for AC886 structural model building was the two‐compartment model with first‐order metabolite formation developed in R/R AML patients. 13 Due to unavailability of intravenous data and given the challenges associated with identifying the metabolism and formation parameters in joint parent and metabolite population models, the parent‐to‐metabolite conversion fraction (f MET) in the original model was fixed to 0.5, based on the quizartinib/AC886 exposure ratio in the Phase 2 study 2689‐CL‐2004. 13 , 19 Although this represents an assumption, it had no impact on the conclusion of the analysis because the model fit is not affected by the value of f MET. Elimination was linear from the central compartment.
Interindividual variability (IIV) was evaluated on all relevant PK parameters and was generally added in an exponential manner (Equation 1).
| (1) |
where θ p is the typical value of the parameter θ, θ i is the individual value of the parameter, and η pi is a normally distributed random variable with mean 0 and standard deviation ω.
A box‐cox transformation for IIV was considered when dealing with skewed η pi distributions (Equation 2).
| (2) |
where λi is a shape parameter.
The model for the residual unexplained variability (RUV) was additive on the logarithmic scale (Equation 3).
| (3) |
where is the jth observation from the ith individual, is the corresponding model individual predictions (IPRED), and is a normally distributed random variable with mean 0 and standard deviation σ.
Covariate analysis was performed using the stepwise covariate model (SCM) algorithm with adaptive scope reduction and stage‐wise filtering. 20 Stage‐wise filtering consists of categorizing covariates into three groups: mechanistic, structural, and exploratory. Mechanistic covariates are those known to have an impact on one or more parameters of the model and are included in the base model without statistical testing (e.g., body weight (WT) on elimination and disposition based on allometric principles). 21 , 22 Structural covariates are those that have a strong rationale to impact one or more model parameters; these are often specific to the study design (e.g., formulation or diet status). Structural covariates are tested prior to exploratory covariates. Exploratory covariates are those that are not mechanistic nor structural and are explored for hypothesis‐generating reasons. Baseline descriptive statistics for the continuous and categorical covariates in the analysis data set are summarized in Table 2, alongside their type (mechanistic, stochastic, or exploratory) and the parameters they were included or tested on. The forward selection and backward elimination p‐values were 0.01 and 0.001, respectively. The adaptive scope reduction threshold p‐value was 0.01. Missing covariates were imputed with the median (continuous covariates) or most common category (categorical covariates).
TABLE 2.
Baseline statistics for the continuous and categorical covariates in the analysis and parameters they were included or tested on.
| Covariate | Categorical N (%) | Continuous median (range) | Missing N (%) | Quizartinib model parameters | AC886 model parameters | ||||
|---|---|---|---|---|---|---|---|---|---|
| Mechanistic | Structural | Exploratory | Mechanistic | Structural | Exploratory | ||||
| Age (years) | 50.0 (18.0, 91.0) | V p | CL, V c | CL, V c, V p | |||||
| Body weight (kg) | 72.0 (36.8, 153) | CL, Q, V c, V p | CL, Q, V c, V p | ||||||
| Sex | CL, V c, V p | CL, V c, V p | |||||||
| Male | 495 (53.1) | ||||||||
| Female | 437 (46.9) | ||||||||
| Race | 29 (3.1) | CL, V c, V p, F rel | CL, V c, V p | ||||||
| White | 610 (65.4) | ||||||||
| Black/African American | 79 (8.5) | ||||||||
| Asian | 169 (18.1) | ||||||||
| Other | 45 (4.8) | ||||||||
| Ethnicity for Asian race | |||||||||
| Japanese | CL, V c, V p, F rel | CL, V c, V p | |||||||
| Yes | 75 (8.0) | ||||||||
| No | 857 (92.0) | ||||||||
| Chinese or Taiwanese or Hongkonger | CL, V c, V p, F rel | CL, V c, V p | |||||||
| Yes | 29 (3.1) | ||||||||
| No | 903 (96.9) | ||||||||
| Korean | CL, V c, V p, F rel | CL, V c, V p | |||||||
| Yes | 45 (4.8) | ||||||||
| No | 887 (95.2) | ||||||||
| Liver function tests | |||||||||
| Alkaline phosphatase (IU/L) | 74.5 (19.0, 823) | 14 (1.5) | CL | CL | |||||
| Alanine aminotransferase (IU/L) | 20.0 (1.50, 377) | 14 (1.5) | CL | CL | |||||
| Aspartate aminotransferase (IU/L) | 21.0 (3.00, 688) | 15 (1.6) | CL | CL | |||||
| Total bilirubin (mg/L) | 0.526 (0.100, 3.40) | 12 (1.3) | CL | CL | |||||
| Albumin (g/dL) | 3.80 (1.70, 5.20) | 21 (2.3) | V c | CL | CL, V c | ||||
| Creatinine Clearance (mL/min) | 115 (22.1, 390) | 10 (1.1) | CL | ||||||
| NCI‐ODWG grade a | 14 (1.5) | CL | CL | ||||||
| Normal | 763 (81.9) | ||||||||
| Mild | 139 (14.9) | ||||||||
| Moderate | 16 (1.7) | ||||||||
| Formulation | k a, F rel | ||||||||
| Tablet | 805 (86.4) | ||||||||
| Solution | 127 (13.6) | ||||||||
| Population | |||||||||
| Non‐AML subjects | 273 (29.3) | ||||||||
| R/R AML | 365 (39.2) | F rel | CL, k a | V c, V p | CL | V c, V p | |||
| Newly diagnosed AML | 294 (31.5) | CL, F rel | V c, V p, k a | CL | V c, V p | ||||
| Concomitant medication | |||||||||
| CYP3A inhibitors | |||||||||
| No | 487 (52.3) | ||||||||
| Weak | 85 (9.1) | CL, F rel | |||||||
| Moderate | 176 (18.9) | CL, F rel | |||||||
| Strong | 184 (19.7) | CL, F rel | CL, V c | ||||||
| CYP3A inducers | |||||||||
| No | 895 (96.0) | ||||||||
| Weak | 36 (3.9) | CL, F rel | |||||||
| Moderate | 1 (0.1) | ||||||||
| Antacids | k a, F rel | ||||||||
| No | 842 (90.3) | ||||||||
| Yes | 90 (9.7) | ||||||||
| Proton Pump Inhibitors | k a, F rel | ||||||||
| No | 605 (64.9) | ||||||||
| Yes | 327 (35.1) | ||||||||
| Total | 932 (100) | ||||||||
Abbreviations: AML, acute myeloid leukemia; CL, apparent clearance; F rel, bioavailability; k a, first‐order absorption rate constant; Q, apparent intercompartmental clearances for multi‐compartmental models; R/R, relapse/refractory; V c, apparent volume of distribution of central compartment; V p, apparent volumes of distribution of peripheral compartments for multi‐compartmental models.
National Cancer Institute‐Organ Dysfunction Working Group.
Covariates were tested only on parameters associated with IIV. While baseline values were tested for all other covariates, concomitant medications were evaluated as covariates varying over time. Continuous covariate‐parameter relationships were implemented as exponential models (Equation 4) and categorical covariate‐parameter relationships as a fractional difference to the most common category (Equation 5).
| (4) |
| (5) |
where is the covariate coefficient for covariate , and is a reference covariate value for covariate , to which the covariate model is normalized (median or mode).
The effect of AML was tested as a dichotomous covariate, grouping subjects into two subpopulations: AML patients (including R/R AML and newly diagnosed AML patients), and non‐AML subjects (including healthy volunteers and subjects with hepatic impairment). The AML patient group was set as the reference category versus which the effect of non‐AML subjects was estimated (Equation 5).
For the mechanistic covariate WT, the power relationship was applied (Equation 6).
| (6) |
where was fixed to 0.75 for clearance (CL) and 1 for the volume of distribution (V) parameters. 21 , 22 The total effect of covariates on parameter is the product of covariate terms (Equation 7).
| (7) |
where is the typical value of parameter for patient and is the population‐typical parameter value (for a patient with typical or reference covariate values).
The influence of covariates on exposure metrics (steady‐state area under the curve in the 24‐h dosing interval AUCss, maximum concentration at steady‐state C max,ss and minimum concentration at steady‐state C min,ss) of quizartinib, AC886, and their sum, was illustrated graphically using Forest plots. 23 The illustration was based on the final models and the uncertainty in covariate effects was obtained by drawing 250 samples from the variance–covariance matrix of the estimates. Given the <3% difference in the molecular weight of quizartinib and AC886 (560.68 g/mol vs. 576.67 g/mol), the exposure metrics of the individual moieties were summed up on the ng/mL scale when computing the total (quizartinib plus AC886) exposure parameter values.
Model building was guided by changes in the objective function value (OFV), the precision and plausibility of parameter estimates, and the visual inspection of graphical diagnostics, including goodness of fit plots and prediction‐corrected VPCs (pcVPCs). 24 , 25
RESULTS
Quizartinib population PK model
The final quizartinib model had a three‐compartment structure with sequential zero‐ and first‐order absorption, and a first‐order elimination from the central compartment (Figure 1a). The model consisted of the following parameters: duration of zero‐order input to the depot compartment (D1), first‐order absorption rate constant (k a), absorption lag time (T lag), relative bioavailability (F rel), apparent CL (CLquiz), apparent central V (V c,quiz), apparent Vs for the peripheral compartments (V p1,quiz and V p2,quiz), and apparent intercompartmental CL for the peripheral compartments (Q 1,quiz and Q 2,quiz).
FIGURE 1.
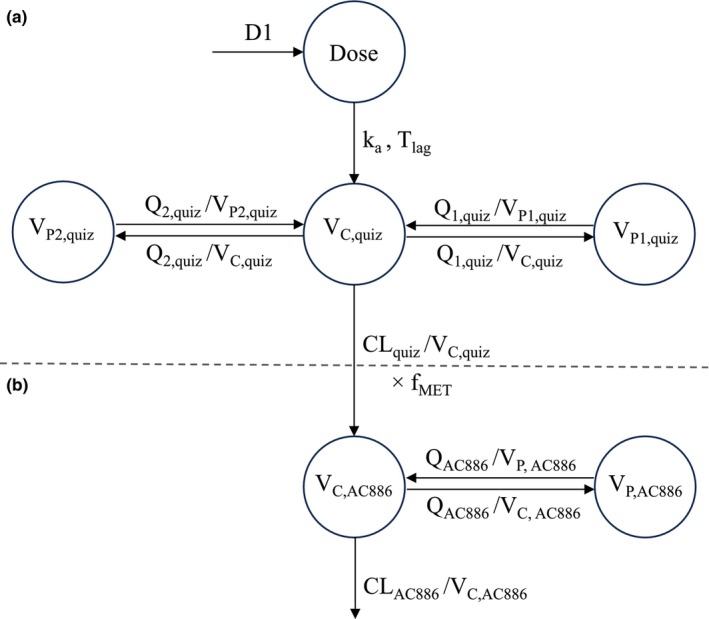
Illustration of the structural population PK models for quizartinib (a) and AC886 (b). D1 is the duration of zero‐order input to the depot compartment, k a is the first‐order absorption rate constant, T lag is the absorption lag time, CLquiz is the apparent clearance of quizartinib, V c,quiz is the apparent central volume of distribution (V c) of quizartinib, V p1,quiz is the apparent peripheral volume of distribution (V p) of quizartinib for the first peripheral compartment, V p2,quiz is the apparent V p of quizartinib for the second peripheral compartment, Q 1,quiz is the apparent intercompartmental clearance 1 of quizartinib, and Q 2,quiz is the apparent intercompartmental clearance 2 of quizartinib. CLAC886 is the apparent clearance of AC886, V c,AC886 is the apparent V c of AC886, V p,AC886 is the apparent V p of AC886, Q AC886 is the apparent intercompartmental clearance of AC886, and f MET is the parent‐to‐metabolite conversion fraction.
IIV terms were supported on CLquiz, Q 1,quiz, V c,quiz, T lag, k a, D1, and F rel. Two different IIV terms for F rel were estimated, one for AML patients and one for non‐AML subjects, to account for the higher IIV observed in patient data. Mechanistic covariates included in the model were (i) strong CYP3A inhibitors coadministration on CL and F rel, (ii) non‐AML subjects' effect on F rel, and (iii) allometric WT scaling of CLquiz, Q 1,quiz, Q 2,quiz, V c,quiz, V p1,quiz, and V p2,quiz with a fixed exponent of 0.75 for the clearances and 1 for the volumes of distribution. Using the SCM procedure, the following covariate‐parameter relationships were found to be statistically significant and were hence included in the covariate model: concomitant use of moderate CYP3A inhibitors on F rel, non‐AML population subgroup on k a, age on V p1,quiz, Black or African American (Black) race on CLquiz, and female sex on V c,quiz. The RUV model was additive on the logarithmic scale comprising two separate terms for AML patients and non‐AML subjects, to capture the larger RUV associated with AML studies.
During model building, an overprediction of quizartinib concentrations in the induction phase of newly diagnosed AML patients was observed, followed by adequate data prediction during consolidation, and underprediction in the continuation phase (Figure 2a). To account for these differences in PK among study phases, a phase covariate was included on the F rel of newly diagnosed patients. Similarly to the other categorical covariates, this phase covariate tested the fractional difference of each study phase (induction, consolidation, and continuation) in newly diagnosed AML patients against a reference category. The reference was set to the R/R AML patients, for whom no distinct treatment phases were reported. The phase effect allowed for an adequate fitting of newly diagnosed patient data across all study phases (Figure 2b).
FIGURE 2.
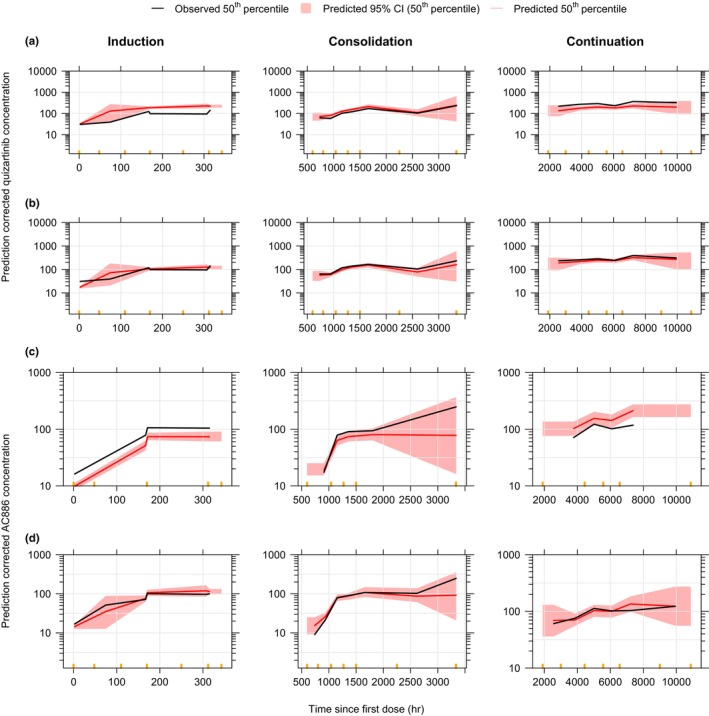
Prediction‐corrected VPCs of quizartinib (a, b) and AC886 (c, d) models, before (a, c) and after (b, d) adding the phase covariate on F rel and f MET, in newly diagnosed AML patients, stratified by study phase. Concentrations are displayed versus time after the first dose on a semi‐logarithmic scale. Orange markers delimit the bins.
The parameter estimates of the final quizartinib model are provided in Table 3 and the parametrization of the covariate effects is provided in Equations 8 to 15 in Supporting Information. The final quizartinib NONMEM model code is also provided in Supporting Information.
TABLE 3.
Parameter estimates of the final quizartinib and AC866 models.
| Final quizartinib model | Final AC886 model | ||||||||
|---|---|---|---|---|---|---|---|---|---|
| Unit | Value | RSE(%) | SHR(%) | Unit | Value | RSE(%) | SHR(%) | ||
| CLquiz | L/h | 6.65 | 1.61 | CLAC886 | L/h | 4.61 | 3.75 | ||
| V c,quiz | L | 371 | 3.13 | V c,AC886 | L | 8.93 | 6.84 | ||
| Q 1,quiz | L/h | 40.7 | 4.68 | V p,AC886 | L | 68.5 | 1.78 | ||
| V p1,quiz | L | 312 | 1.95 | Q AC886 | L/h | 3.76 | 2.06 | ||
| Q 2,quiz | L/h | 0.757 | 3.89 | ||||||
| V p2,quiz | L | 91.9 | 2.24 | ||||||
| T lag | h | 0.196 | 4.24 | ||||||
| k a | 1/h | 1.10 | 6.28 | ||||||
| D1 | h | 0.710 | 6.37 | ||||||
| Fractional change in CLquiz with strong CYP3A inhibitors | −0.301 | 7.38 | Fractional change in CLAC886 for non‐AML subjects | 0.843 | 11.0 | ||||
| Fractional change in F rel with strong CYP3A inhibitors | 0.273 | 10.7 | Fractional change in CLAC886 for Black race | 0.488 | 20.9 | ||||
| F rel for non‐AML subjects | 1.73 | 2.96 | Fractional change in CLAC886 with strong CYP3A inhibitors | 0.298 | 8.01 | ||||
| Fractional change in F rel with moderate CYP3A inhibitors | 0.116 | 13.8 | Fractional change in V c,AC886 with strong CYP3A inhibitors | 2.79 | 7.34 | ||||
| Fractional change in k a for non‐AML subjects | −0.188 | 28.9 | Fractional change in f MET during Induction | 0.715 | 6.38 | ||||
| Age effect on V p1,quiz | 1/year | 0.0152 | 5.97 | Fractional change in f MET during Consolidation | 0.272 | 13.3 | |||
| Fractional change in CLquiz for Black race | −0.261 | 38.0 | Fractional change in f MET during Continuation | −0.249 | 8.47 | ||||
| Fractional change in V c,quiz for females | −0.169 | 16.0 | |||||||
| Fractional change in F rel during Induction | −0.419 | 4.92 | |||||||
| Fractional change in F rel during Consolidation | −0.192 | 15.6 | |||||||
| Fractional change in F rel during Continuation | 0.418 | 12.5 | |||||||
| Shape box‐cox parameter for IIV on F rel for AML patients | −1.28 | 14.4 | |||||||
| IIV Q 1,quiz | (CV) | 0.691 | 4.60 | 43.9 | IIV CLAC886 AML patients | (CV) | 0.740 | 2.25 | 4.65 |
| IIV CLquiz | (CV) | 0.695 | 2.34 | 11.8 | IIV CLAC886 non‐AML subjects | (CV) | 0.516 | 5.31 | 1.56 |
| IIV V c,quiz | (CV) | 0.186 | 11.0 | 60.2 | IIV V c,AC886 | (CV) | 1.36 | 3.55 | 13.7 |
| IIV T lag | (CV) | 0.647 | 4.10 | 44.5 | |||||
| IIV k a | (CV) | 0.423 | 6.77 | 46.6 | |||||
| IIV D1 | (CV) | 0.821 | 4.50 | 38.1 | |||||
| IIV F rel AML patients | (CV) | 0.444 | 4.81 | 17.5 | |||||
| IIV F rel non‐AML subjects | (CV) | 0.256 | 4.22 | 6.58 | |||||
| Additive RUV log scale AML patients | (CV) | 0.440 | 0.363 | 8.53 | Additive RUV log scale AML patients | (CV) | 0.452 | 0.364 | 6.61 |
| Additive RUV log scale non‐AML subjects | (CV) | 0.102 | 0.667 | 13.0 | Additive RUV log scale non‐AML subjects | (CV) | 0.312 | 0.405 | 5.09 |
| OFV | −16,373.5 | OFV | −6691.71 | ||||||
| Condition number | 985.5 | Condition number | 25.09 | ||||||
Note: The RSE for IIV and RUV parameters are reported on the approximate SD scale.
The characteristics of the typical subject are reported in Equations 8 to 15 in Supporting Information for the final quizartinib model, and in Equations 16 to 20 in Supporting Information for the final AC886 model.
Abbreviations: AML, acute myeloid leukemia; CL, clearance; CLAC886, apparent CL of AC886; CLquiz, apparent CL of quizartinib; CV, coefficient of variation; D1, duration of zero‐order input to depot compartment; F rel, relative bioavailability; IIV, interindividual variability; k a, first‐order absorption rate constant; OFV: objective function value; Q AC886, apparent intercompartmental clearance of AC886; Q 1,quiz, apparent intercompartmental clearance 1 of quizartinib; Q 2,quiz, apparent intercompartmental clearance 2 of quizartinib; RSE, relative standard error; RUV, residual unexplained variability; SHR, shrinkage; T lag, absorption lag time; V c,AC886, apparent central volume of distribution of AC886; V c,quiz, apparent central volume of distribution of quizartinib; V p,AC886, apparent peripheral volume of distribution of AC886; V p1,quiz, apparent peripheral volume of distribution 1 of quizartinib; V p2,quiz, apparent peripheral volume of distribution 2 of quizartinib.
Model parameters were estimated with adequate precision (relative standard error (RSE) <40%). The estimated magnitude of IIV was high for D1 (82% coefficient of variation (CV)), CLquiz, and Q 1,quiz (69% CV each). Both IIV on F rel and RUV terms were higher for AML patients versus non‐AML subjects (Table 3). The pcVPCs for the final quizartinib model show that the model was able to describe the median PK profile and the associated variability in newly diagnosed AML patients during all study phases (induction, consolidation, and continuation) (Figures 2b and 3a). The model was also able to adequately capture the data across relevant subpopulations, such as those receiving concomitant medication with CYP3A inducers or inhibitors of various intensities (Figure 3b), or the different disease status subpopulations, ie, newly diagnosed AML patients, R/R AML patients, and non‐AML subjects (Figure S1). Additional goodness of fit plots confirmed the satisfactory performance of the final quizartinib model (Figure S2).
FIGURE 3.
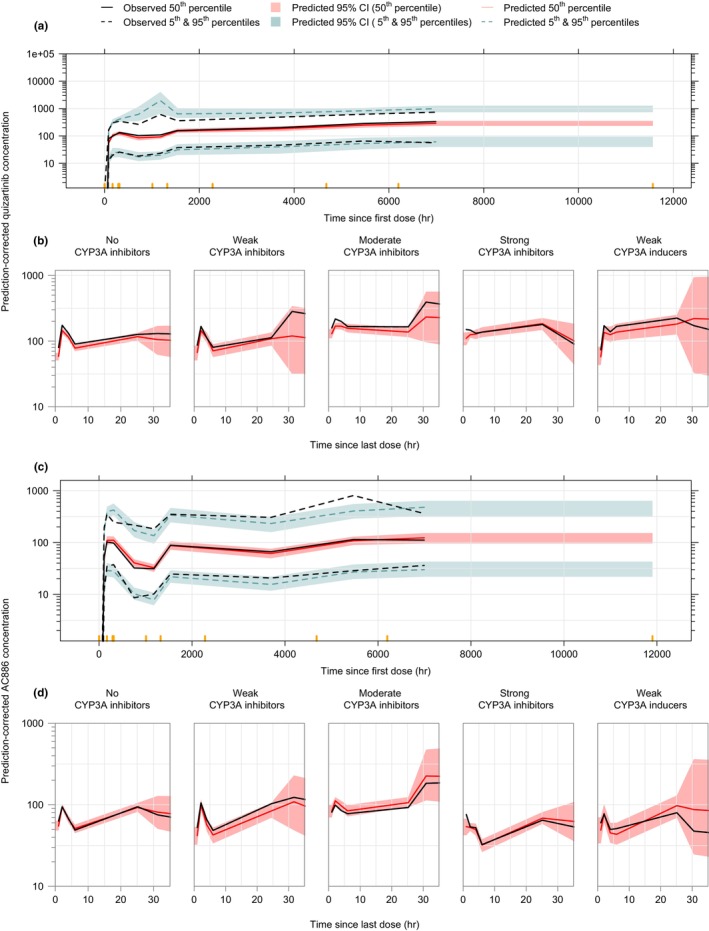
Prediction‐corrected VPCs for the final quizartinib (a, b) and AC886 (c, d) models in newly diagnosed AML patients from QuANTUM‐First trial (a, c) and all subjects stratified by the intensity of coadministered CYP3A inhibitors and inducers (b, d). Concentrations are displayed versus time after the first dose (a, c) or time after the last dose (b, d) on a semi‐logarithmic scale. Orange markers delimit the bins.
AC886 population PK model
The final AC886 model was a two‐compartment model with first‐order elimination from the central compartment and first‐order formation from the quizartinib central compartment (Figure 1b). The parameters included in the AC886 model were the following: f MET, apparent CL (CLA886), apparent central V (V c,AC886), apparent peripheral V (V p,AC886), and apparent intercompartmental CL (Q AC886). The f MET was kept fixed to 0.5. An IIV term was included on V c,AC886 and two separate IIV terms were supported on CLAC886 for AML patients and non‐AML subjects. CL and V parameters were allometrically scaled by WT. Black race, non‐AML subjects population, and use of strong CYP3A inhibitors were found to have a statistically significant impact on CLAC886, while the use of strong CYP3A inhibitors also had a statistically significant impact on V c,AC886. These factors were hence part of the covariate model. The RUV for AML patients and non‐AML subjects was described by separate additive error models on the logarithmic scale.
The model provided an adequate fit to the data, but underpredicted AC886 concentrations in the induction phase and overpredicted them in the continuation phase (Figure 2c). Thus, similarly to the addition made on F rel in the quizartinib model, a phase effect was included on f MET for adequate fitting of the data across all study phases (Figures 2d and 3c). However, in the case of AC886, no effect of non‐AML subjects was demonstrated on f MET, thus the non‐AML subjects, with no distinct treatment phase reported, were combined with R/R patients in the reference group.
The parameter estimates for the final AC886 model are provided in Table 3, and the parametrization of the covariate effects is provided in Equations 16 to 20 in Supporting Information. The final AC886 model NONMEM code is also provided in Supporting Information.
AC886 population PK parameters were estimated with an adequate precision (RSE < 21%). As with the quizartinib data, both IIV on CLAC886 and RUV were higher for AML patients versus non‐AML subjects (Table 3). The pcVPCs for the final AC886 model (Figures 2d and 3c) showed that the model was able to capture the typical AC886 PK profile and the associated variability in newly diagnosed AML patients during all study phases. The final AC886 model was able to adequately capture the data across relevant comedications (Figure 3d) and subpopulation (Figure S3) groups. The model's satisfactory performance was additionally confirmed with goodness of fit plots (Figure S4).
The impact of covariates on AUCss, C max,ss, and C min,ss of quizartinib, AC886, and their sum, is illustrated in Figure 4. The covariate with the largest impact on quizartinib exposure was the concomitant administration of strong CYP3A inhibitors: it was estimated to increase exposure by almost 2‐fold. Quizartinib exposure was higher in non‐AML subjects compared to AML patients (approximately 1.7‐fold difference). The effect of Black race was also pronounced but it was associated with large uncertainty. In newly diagnosed AML patients, compared to the reference R/R AML patient, quizartinib exposures changed by 0.6‐, 0.8‐, and 1.4‐fold, respectively, during induction, consolidation, and continuation treatment. The point estimate of the remaining covariate effects was within the [0.8–1.25] limits. For AC886, only Black race led to a median difference in exposure outside the +/−20% reference interval (almost 0.7‐fold change compared to all other race categories). The race effect was canceled out when assessing the impact on the total exposure to quizartinib and AC886 (Figure 4c), while the effect of strong CYP3A inhibitors and non‐AML subjects remained large.
FIGURE 4.
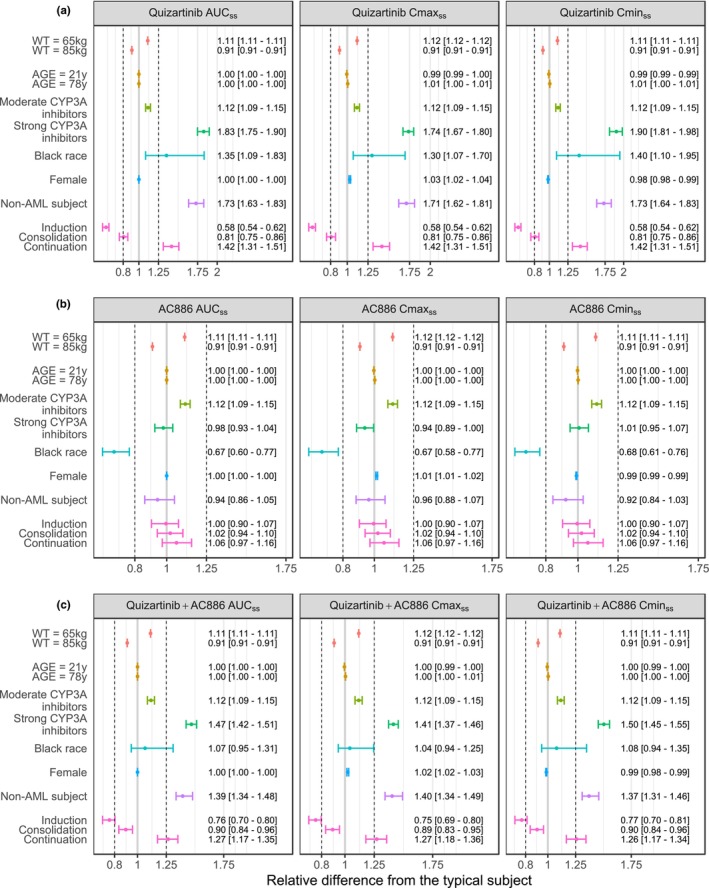
Forest plots illustrating the impact of covariate effects on PK parameters of quizartinib (a), AC886 (b), and on the sum of quizartinib and AC886 PK parameters (c). The vertical dashed lines indicate the 80%–125% margins relative to the reference subject, indicated by the solid gray line (male relapse/refractory AML patient, WT = 75 kg, AGE = 47 years, no CYP3A coadministration and not Black) and are based on the standard bioequivalence limits. The dots and whiskers represent the median and 95% CI of the relative difference from the typical subject for AUCss, C max,ss, and C min,ss, colored by covariate. The numbers are medians [95% CI] of the relative difference from the typical subject.
DISCUSSION
Population PK models for quizartinib and AC886 were developed using pooled data from nine Phase I, two Phase II, and two Phase III studies which were conducted in healthy volunteers, subjects with hepatic impairment, R/R AML patients, and newly diagnosed AML patients. This was a comprehensive analysis including both densely and sparsely sampled PK data after single‐ and multiple‐dose administrations ranging from 20 to 90 mg/day.
A three‐compartment model with sequential zero and first‐order absorption and first‐order elimination from the central compartment best described quizartinib PK observations. A two‐compartment model with first‐order elimination and first‐order formation best described AC886 concentrations. The IIV of quizartinib and AC886 PK was large in AML patients, as shown by a CV of 44% for F rel and 74% for CLAC886.
The total exposure to quizartinib and AC886 in both newly diagnosed and R/R AML patients was approximately 40% lower compared to the non‐AML population (Figure 4c). The reasons for this difference are unclear but could be due to changes in drug absorption in AML patients.
The PK of quizartinib in newly diagnosed AML patients were found to vary across treatment phases. The ratio of quizartinib steady‐state exposure between R/R versus newly diagnosed AML patients was 0.58 (95% CI 0.54–0.62) during the induction phase, and it increased to 1.42 (95% CI 1.31–1.51) during continuation (Figure 4a). A VPC performed excluding patients that did not enter the continuation phase of QuANTUM‐First study (data not shown) confirmed that the effect was due to treatment phase‐related factors rather than subject‐related ones. This phase effect on quizartinib exposure in newly diagnosed AML patients hinders a formal comparison with R/R AML patients, as it encompasses various underlying factors that vary between phases, such as background chemotherapy and patient conditions, whereas R/R AML patients received quizartinib monotherapy. Nevertheless, it is worth mentioning that, from a PK standpoint, the treatment phase during which newly diagnosed patients behaved most similarly to R/R patients was the consolidation. During this phase, the time elapsed after the initiation of chemotherapy is comparable between the two AML subpopulations since R/R patients can be considered as newly diagnosed patients with induction treatment failure. Moreover, as the treatment phase increases, differences between AML and non‐AML groups taper off. Thus, improving patient conditions might be one of the determinants of the observed phase effect. In addition, chemotherapy agents administered in QuANTUM‐First (cytarabine, daunorubicin, and idarubicin) are not known to inhibit CYP3A or transporters involved in quizartinib metabolism and disposition (p‐glycoprotein). 26 , 27 Therefore, it is unlikely that the phase effect is due to PK interactions between quizartinib and background chemotherapy.
To account for this between‐phase variation, a phase covariate was added on F rel, which allowed for an adequate description of quizartinib data across all study phases. As far as AC886 is concerned, an opposite trend was observed, with an underprediction of AC886 concentrations in the induction phase, adequate prediction in consolidation, and overprediction of observations in the continuation phase (Figure 2c). This spurious finding is due to the inherent assumption made in parent‐metabolite modeling, that effects on parent F rel are proportionally transferred to the metabolite exposure. In reality, F rel is related to all metabolic pathways and not only those leading to the AC886 formation. To counterbalance the carried‐over F rel effect, a phase covariate was also added on f MET, resulting in similar AC886 exposures across all treatment phases (Figure 2d).
The results of the covariate analysis are consistent with previous findings in R/R AML patients. 13 Among the statistically significant covariates, only the concomitant use of strong CYP3A inhibitors led to a clinically relevant effect on quizartinib exposure. This effect was not propagated to AC886, likely as a result of the net effect on its formation and elimination. Overall, the effect of strong and moderate CYP3A inhibitors estimated in the present analysis is in agreement with findings from the DDI study AC220‐0159 (Table 1).
In conclusion, population PK models for quizartinib and AC886 in newly diagnosed AML patients were established. Their satisfactory predictive performance was confirmed across several data subgroups, including R/R AML patients, non‐AML subjects, and subjects receiving concomitant medication with CYP3A inducers and inhibitors of different intensities. Steady‐state, dose‐normalized quizartinib exposure was found to be increasing in newly diagnosed AML patients as they move along induction, consolidation, and continuation treatment. The coadministration of strong CYP3A inhibitors had the largest impact on quizartinib exposure.
The established PK models were used for deriving individual exposure metrics for subsequent exposure‐response analyses. They also informed the clinical drug development, providing evidence that no dose adjustments were necessary for different age, sex, body weight, or race groups, as reflected in both the US Food and Drug Administration Prescribing Information 26 and the European Medicines Agency Summary of Product Characteristics. 27 Finally, they confirmed the need to adjust the quizartinib dose during concomitant treatment with strong CYP3A inhibitors.
AUTHOR CONTRIBUTIONS
P.V., A.G., G.S., S.N., H.I., A.K., M.A., and M.Z. wrote the manuscript. M.A. and M.Z. designed the research. S.N., H.I., M.A., and M.Z. performed the research. P.V., A.G., G.S., S.N., H.I., A.K., M.A., and M.Z. analyzed the data.
FUNDING INFORMATION
This work was supported by Daiichi Sankyo, Inc.
CONFLICT OF INTEREST STATEMENT
Anaïs Glatard and Giovanni Smania are employees of Pharmetheus AB. Abhinav Kurumaddali, Malaz Abutarif, and Ming Zheng are employees of Daiichi Sankyo, Inc., Basking Ridge, NJ, USA. Pavan Vaddady was an employee of Daiichi Sankyo, Inc., Basking Ridge, NJ, USA during the time of the study. Shintaro Nakayama and Hiroyuki Inoue are employees of Daiichi Sankyo Co, Ltd., Tokyo, Japan. The authors declared no competing interests for this work.
Supporting information
Data S1.
ACKNOWLEDGMENTS
The authors thank Sofia Friberg Hietala, PhD, and Martin Bergstrand, PhD of Pharmetheus, Uppsala, Sweden, for the fruitful discussions during the model‐building stage. The authors thank Christina Pentafragka, PhD of Pharmetheus, Uppsala, Sweden for providing medical writing support, which was funded by Daiichi Sankyo, Inc. in accordance with Good Publication Practice guidelines (http://www.ismpp.org/gpp‐2022).
Vaddady P, Glatard A, Smania G, et al. Population pharmacokinetic analysis of quizartinib in patients with newly diagnosed FLT3‐internal‐tandem‐duplication‐positive acute myeloid leukemia. Clin Transl Sci. 2024;17:e70074. doi: 10.1111/cts.70074
DATA AVAILABILITY STATEMENT
Anonymized individual participant data (IPD) and applicable supporting clinical study documents may be available upon request at https://vivli.org/. In cases where clinical study data and supporting documents are provided pursuant to our company policies and procedures, Daiichi Sankyo Companies will continue to protect the privacy of the company and our clinical study subjects. Details on data sharing criteria and the procedure for requesting access can be found at this web address: https://vivli.org/ourmember/daiichi‐sankyo/.
REFERENCES
- 1. Kiyoi H, Kawashima N, Ishikawa Y. FLT3 mutations in acute myeloid leukemia: therapeutic paradigm beyond inhibitor development. Cancer Sci. 2020;111(2):312‐322. doi: 10.1111/cas.14274 [DOI] [PMC free article] [PubMed] [Google Scholar]
- 2. Meshinchi S, Appelbaum FR. Structural and functional alterations of FLT3 in acute myeloid leukemia. Clin Cancer Res. 2009;15(13):4263‐4269. doi: 10.1158/1078-0432.CCR-08-1123 [DOI] [PMC free article] [PubMed] [Google Scholar]
- 3. Gebru MT, Wang HG. Therapeutic targeting of FLT3 and associated drug resistance in acute myeloid leukemia. J Hematol Oncol. 2020;13(1):155. doi: 10.1186/s13045-020-00992-1 [DOI] [PMC free article] [PubMed] [Google Scholar]
- 4. Daver N, Schlenk RF, Russell NH, Levis MJ. Targeting FLT3 mutations in AML: review of current knowledge and evidence. Leukemia. 2019;33(2):299‐312. doi: 10.1038/s41375-018-0357-9 [DOI] [PMC free article] [PubMed] [Google Scholar]
- 5. Levis MJ. FLT3 mutations in acute myeloid leukemia: what is the best approach in 2013? Hematology Am Soc Hematol Educ Program. 2013;2013(1):220‐226. doi: 10.1182/asheducation-2013.1.220 [DOI] [PMC free article] [PubMed] [Google Scholar]
- 6. Fröhling S, Schlenk RF, Breitruck J, et al. Prognostic significance of activating FLT3 mutations in younger adults (16 to 60 years) with acute myeloid leukemia and normal cytogenetics: a study of the AML study group Ulm. Blood. 2002;100(13):4372‐4380. doi: 10.1182/blood-2002-05-1440 [DOI] [PubMed] [Google Scholar]
- 7. Rosenberg MW, Watanabe‐Smith K, Tyner JW, Tognon CE, Druker BJ, Borate U. Genomic markers of midostaurin drug sensitivity in FLT3 mutated and FLT3 wild‐type acute myeloid leukemia patients. Oncotarget. 2020;11(29):2807‐2818. doi: 10.18632/oncotarget.27656 [DOI] [PMC free article] [PubMed] [Google Scholar]
- 8. Kennedy VE, Smith CC. FLT3 mutations in acute myeloid Leukemia: key concepts and emerging controversies. Front Oncol. 2020;10:612880. doi: 10.3389/fonc.2020.612880 [DOI] [PMC free article] [PubMed] [Google Scholar]
- 9. Li J, Kankam M, Trone D, Gammon G. Effects of CYP3A inhibitors on the pharmacokinetics of quizartinib, a potent and selective FLT3 inhibitor, and its active metabolite. Br J Clin Pharmacol. 2019;85(9):2108‐2117. doi: 10.1111/bcp.14022 [DOI] [PMC free article] [PubMed] [Google Scholar]
- 10. Aikawa T, Togashi N, Iwanaga K, et al. Quizartinib, a selective FLT3 inhibitor, maintains antileukemic activity in preclinical models of RAS‐mediated midostaurin‐resistant acute myeloid leukemia cells. Oncotarget. 2020;11(11):943‐955. doi: 10.18632/oncotarget.27489 [DOI] [PMC free article] [PubMed] [Google Scholar]
- 11. Cortes JE, Khaled S, Martinelli G, et al. Quizartinib versus salvage chemotherapy in relapsed or refractory FLT3‐ITD acute myeloid leukaemia (QuANTUM‐R): a multicentre, randomised, controlled, open‐label, phase 3 trial. Lancet Oncol. 2019;20(7):984‐997. doi: 10.1016/S1470-2045(19)30150-0 [DOI] [PubMed] [Google Scholar]
- 12. Erba HP, Montesinos P, Kim HJ, et al. Quizartinib plus chemotherapy in newly diagnosed patients with FLT3‐internal‐tandem‐duplication‐positive acute myeloid leukaemia (QuANTUM‐first): a randomised, double‐blind, placebo‐controlled, phase 3 trial. Lancet. 2023;401(10388):1571‐1583. doi: 10.1016/S0140-6736(23)00464-6 [DOI] [PubMed] [Google Scholar]
- 13. Kang D, Ludwig E, Jaworowicz D, et al. Population pharmacokinetic analysis of Quizartinib in healthy volunteers and patients with relapsed/refractory acute myeloid Leukemia. J Clin Pharmacol. 2020;60(12):1629‐1641. doi: 10.1002/jcph.1680 [DOI] [PMC free article] [PubMed] [Google Scholar]
- 14. Beal S, Sheiner LB, Boeckmann A, Bauer RJ. NONMEM User's guides (1989‐2010). Icon development Solutions. 2010.
- 15. Lindbom L, Ribbing J, Jonsson EN. Perl‐speaks‐NONMEM (PsN)—a Perl module for NONMEM related programming. Comput Methods Prog Biomed. 2004;75(2):85‐94. doi: 10.1016/j.cmpb.2003.11.003 [DOI] [PubMed] [Google Scholar]
- 16. Lindbom L, Pihlgren P, Jonsson EN. PsN‐toolkit—a collection of computer intensive statistical methods for non‐linear mixed effect modeling using NONMEM. Comput Methods Prog Biomed. 2005;79:241‐257. doi: 10.1016/j.cmpb.2005.04.005 [DOI] [PubMed] [Google Scholar]
- 17. Harling K, Hooker AC, Ueckert S, Jonsson EN, Karlsson MO. Perl speaks NONMEM (PsN) and Xpose. Population Approach Group Europe (PAGE) 2010 Abstr 1842. Accessed October 17, 2024. www.page‐meeting.org/?abstract=1842
- 18. R Core Team . R: A Language and Environment for Statistical Computing. R Foundation for Statistical Computing; 2019. Accessed October 17, 2024. http://www.R‐project.org [Google Scholar]
- 19. Bertrand J, Laffont CM, Mentré F, Chenel M, Comets E. Development of a complex parent‐metabolite joint population pharmacokinetic model. AAPS J. 2011;13(3):390‐404. doi: 10.1208/s12248-011-9282-9 [DOI] [PMC free article] [PubMed] [Google Scholar]
- 20. Svensson RJ, Jonsson EN. Efficient and relevant stepwise covariate model building for pharmacometrics. CPT Pharmacometrics Syst Pharmacol. 2022;11(9):1210‐1222. doi: 10.1002/psp4.12838 [DOI] [PMC free article] [PubMed] [Google Scholar]
- 21. Holford NH. A size standard for pharmacokinetics. Clin Pharm. 1996;30(5):329‐332. doi: 10.2165/00003088-199630050-00001 [DOI] [PubMed] [Google Scholar]
- 22. Anderson BJ, Anderson NH. Mechanism‐based concepts of size and maturity in pharmacokinetics. Annu Rev Pharmacol Toxicol. 2008;48:303‐332. doi: 10.1146/annurev.pharmtox.48.113006.094708 [DOI] [PubMed] [Google Scholar]
- 23. Menon‐Andersen D, Yu B, Madabushi R, et al. Essential pharmacokinetic information for drug dosage decisions: a concise visual presentation in the drug label. Clin Pharmacol Ther. 2011;90(3):471‐474. doi: 10.1038/clpt.2011.149 [DOI] [PubMed] [Google Scholar]
- 24. Karlsson MO, Holford N. A tutorial on visual predictive checks. Population Approach Group Europe (PAGE). 2008; Abstr 1434. Accessed October 17, 2024. https://www.page‐meeting.org/?abstract=1434
- 25. Bergstrand M, Hooker AC, Wallin JE, Karlsson MO. Prediction‐corrected visual predictive checks for diagnosing nonlinear mixed‐effects models. AAPS J. 2011;13(2):143‐151. doi: 10.1208/s12248-011-9255-z [DOI] [PMC free article] [PubMed] [Google Scholar]
- 26. Daiichi Sankyo, Inc . Vanflyta (quizartinib) prescribing information. U.S. Food and Drug Administration. 2023. Accessed October 17, 2024. https://www.accessdata.fda.gov/drugsatfda_docs/label/2023/216993s000lbl.pdf
- 27. European Medicines Agency . Quizartinib (Vanflyta) Summary of Product Characteristics. European Union Register of Medicinal Products. November 6, 2023. Accessed October 17, 2024. https://ec.europa.eu/health/documents/community‐register/2023/20231106160706/anx_160706_en.pdf
Associated Data
This section collects any data citations, data availability statements, or supplementary materials included in this article.
Supplementary Materials
Data S1.
Data Availability Statement
Anonymized individual participant data (IPD) and applicable supporting clinical study documents may be available upon request at https://vivli.org/. In cases where clinical study data and supporting documents are provided pursuant to our company policies and procedures, Daiichi Sankyo Companies will continue to protect the privacy of the company and our clinical study subjects. Details on data sharing criteria and the procedure for requesting access can be found at this web address: https://vivli.org/ourmember/daiichi‐sankyo/.